
|
|||||
|
 | |
| |
| |
| |
| |
| |
|
Gene: VPS26A |
Gene summary for VPS26A |
| Gene information | Species | Human | Gene symbol | VPS26A | Gene ID | 9559 |
| Gene name | VPS26, retromer complex component A | |
| Gene Alias | HB58 | |
| Cytomap | 10q22.1 | |
| Gene Type | protein-coding | GO ID | GO:0006810 | UniProtAcc | O75436 |
Top |
Malignant transformation analysis |
| Identification of the aberrant gene expression in precancerous and cancerous lesions by comparing the gene expression of stem-like cells in diseased tissues with normal stem cells |
| Entrez ID | Symbol | Replicates | Species | Organ | Tissue | Adj P-value | Log2FC | Malignancy |
| 9559 | VPS26A | P107T-E | Human | Esophagus | ESCC | 2.07e-51 | 1.19e+00 | 0.171 |
| 9559 | VPS26A | P126T-E | Human | Esophagus | ESCC | 1.13e-07 | 7.53e-01 | 0.1125 |
| 9559 | VPS26A | P127T-E | Human | Esophagus | ESCC | 3.81e-23 | 2.67e-01 | 0.0826 |
| 9559 | VPS26A | P128T-E | Human | Esophagus | ESCC | 3.15e-24 | 7.19e-01 | 0.1241 |
| 9559 | VPS26A | P130T-E | Human | Esophagus | ESCC | 2.87e-76 | 1.89e+00 | 0.1676 |
| 9559 | VPS26A | S43 | Human | Liver | Cirrhotic | 2.84e-03 | -1.65e-01 | -0.0187 |
| 9559 | VPS26A | HCC1_Meng | Human | Liver | HCC | 4.02e-64 | -5.24e-02 | 0.0246 |
| 9559 | VPS26A | HCC2_Meng | Human | Liver | HCC | 4.37e-28 | 5.14e-02 | 0.0107 |
| 9559 | VPS26A | cirrhotic1 | Human | Liver | Cirrhotic | 1.09e-03 | -7.89e-02 | 0.0202 |
| 9559 | VPS26A | cirrhotic2 | Human | Liver | Cirrhotic | 4.94e-08 | 9.30e-02 | 0.0201 |
| 9559 | VPS26A | HCC1 | Human | Liver | HCC | 1.10e-11 | 4.26e+00 | 0.5336 |
| 9559 | VPS26A | HCC2 | Human | Liver | HCC | 1.14e-25 | 4.63e+00 | 0.5341 |
| 9559 | VPS26A | Pt13.b | Human | Liver | HCC | 9.73e-09 | 4.15e-02 | 0.0251 |
| 9559 | VPS26A | S014 | Human | Liver | HCC | 1.17e-19 | 7.73e-01 | 0.2254 |
| 9559 | VPS26A | S015 | Human | Liver | HCC | 2.58e-09 | 7.31e-01 | 0.2375 |
| 9559 | VPS26A | S016 | Human | Liver | HCC | 3.38e-21 | 8.40e-01 | 0.2243 |
| 9559 | VPS26A | S027 | Human | Liver | HCC | 1.60e-03 | 8.10e-01 | 0.2446 |
| 9559 | VPS26A | S028 | Human | Liver | HCC | 3.25e-11 | 6.74e-01 | 0.2503 |
| 9559 | VPS26A | S029 | Human | Liver | HCC | 6.53e-16 | 9.52e-01 | 0.2581 |
| 9559 | VPS26A | C04 | Human | Oral cavity | OSCC | 6.22e-19 | 1.15e+00 | 0.2633 |
| Page: 1 2 3 4 5 6 |
| Tissue | Expression Dynamics | Abbreviation |
| Esophagus | 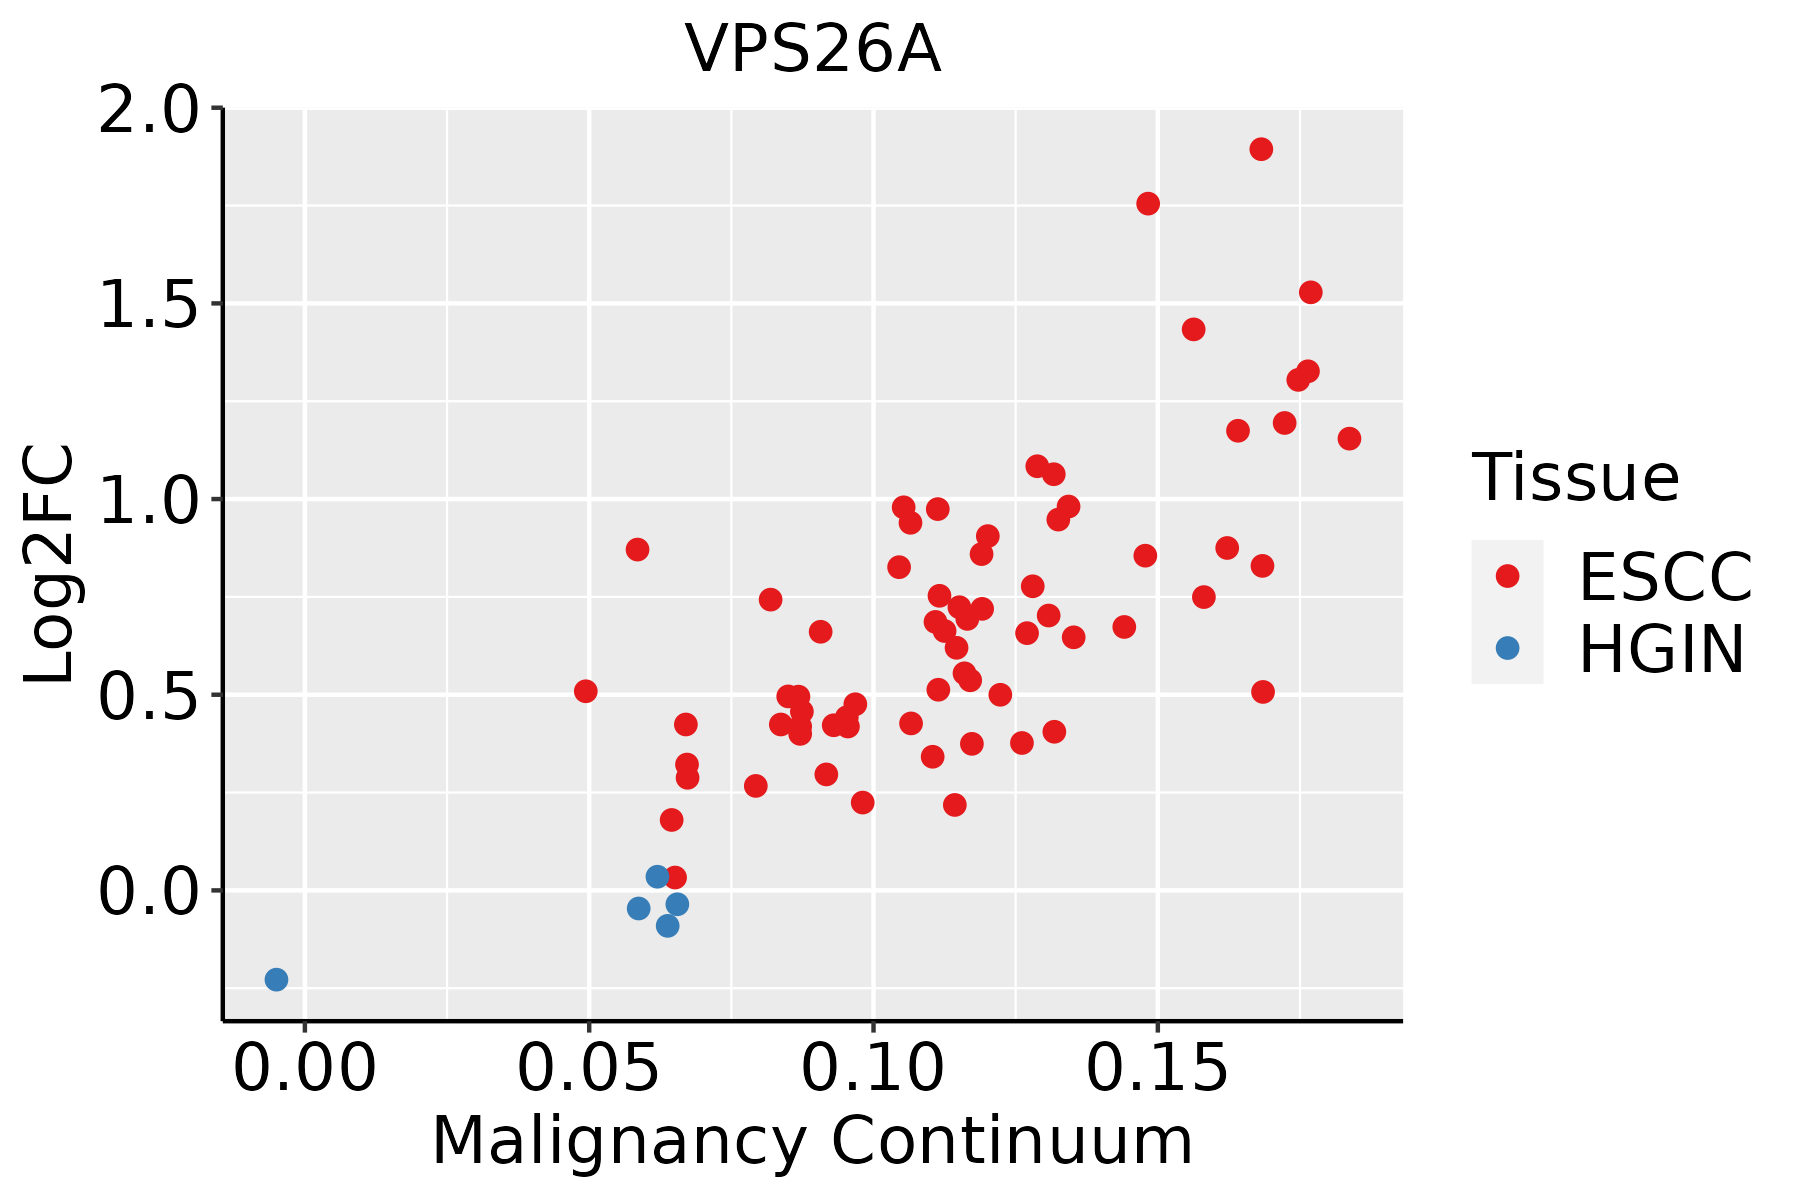 | ESCC: Esophageal squamous cell carcinoma |
| HGIN: High-grade intraepithelial neoplasias | ||
| LGIN: Low-grade intraepithelial neoplasias | ||
| Liver |  | HCC: Hepatocellular carcinoma |
| NAFLD: Non-alcoholic fatty liver disease | ||
| Oral Cavity | 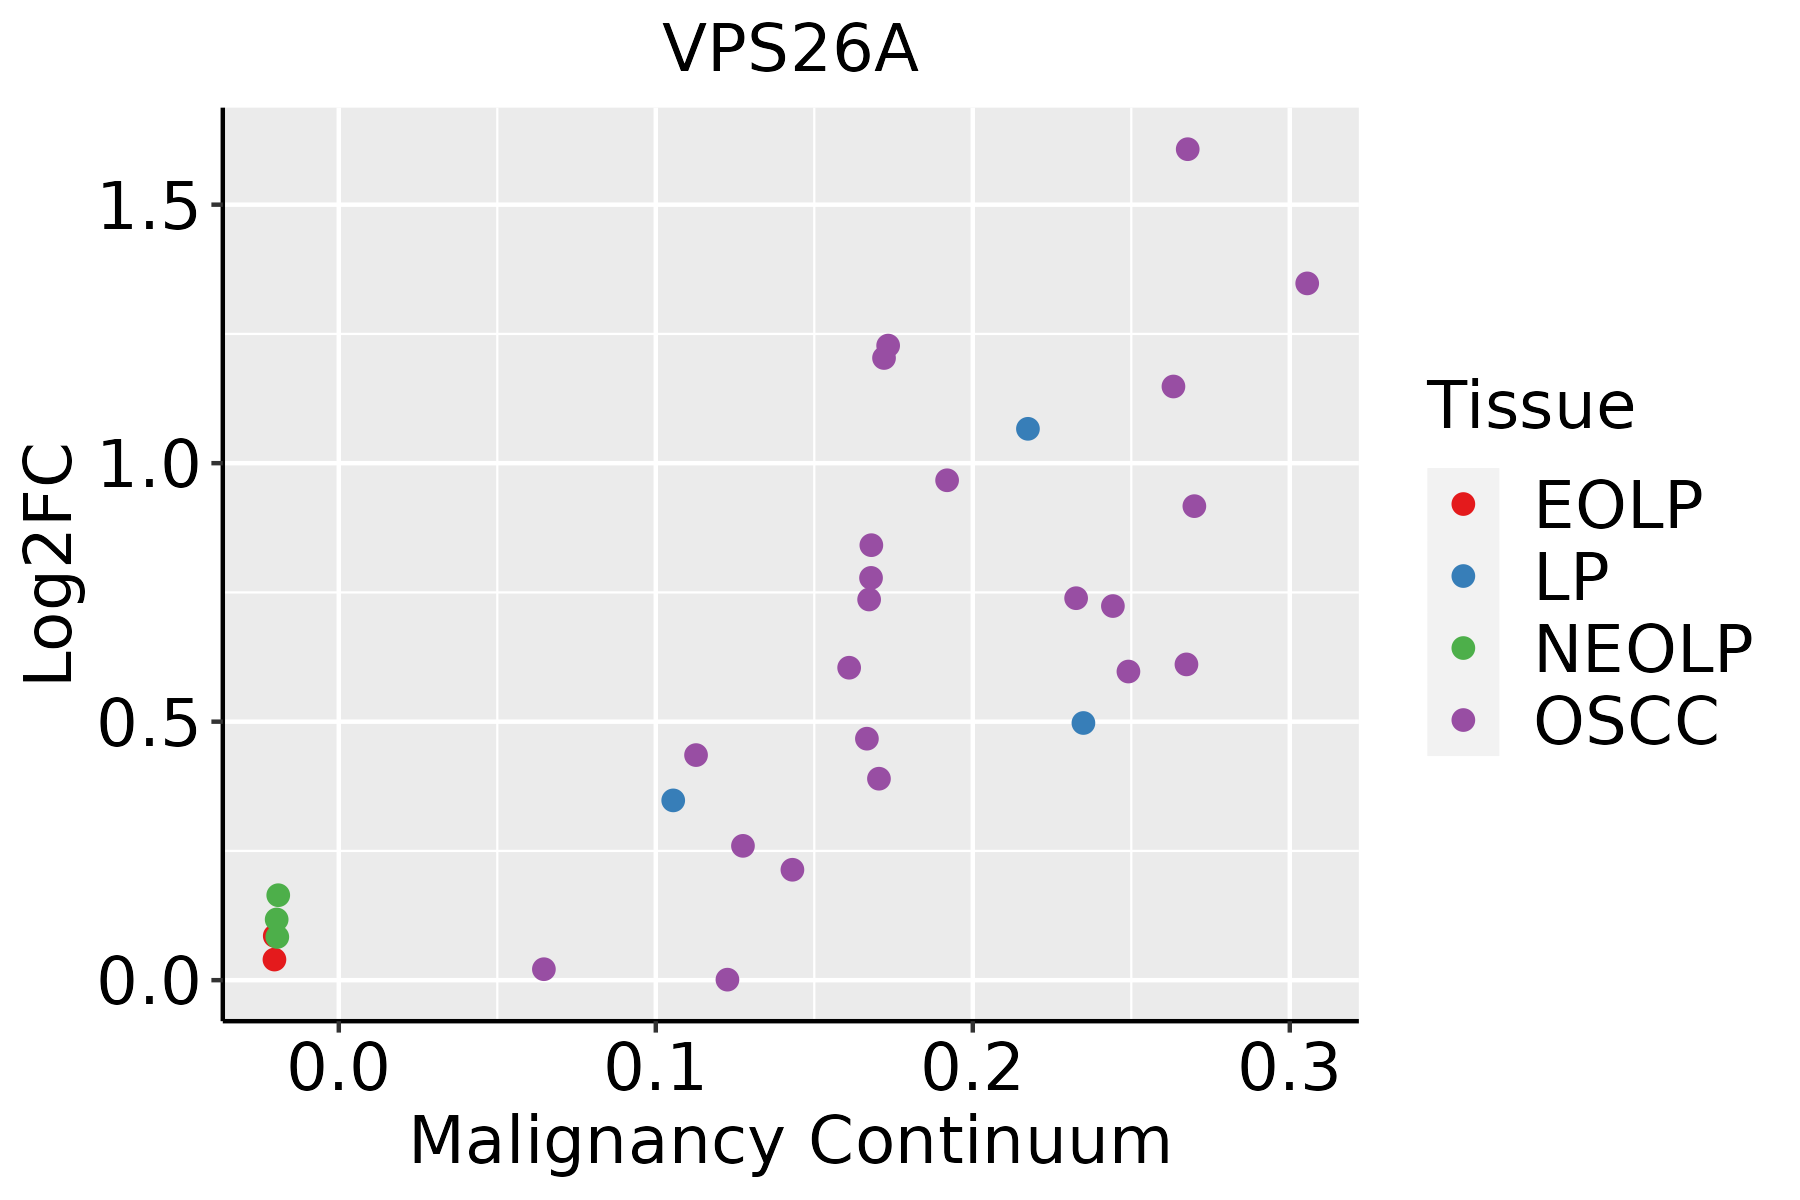 | EOLP: Erosive Oral lichen planus |
| LP: leukoplakia | ||
| NEOLP: Non-erosive oral lichen planus | ||
| OSCC: Oral squamous cell carcinoma | ||
| Skin | 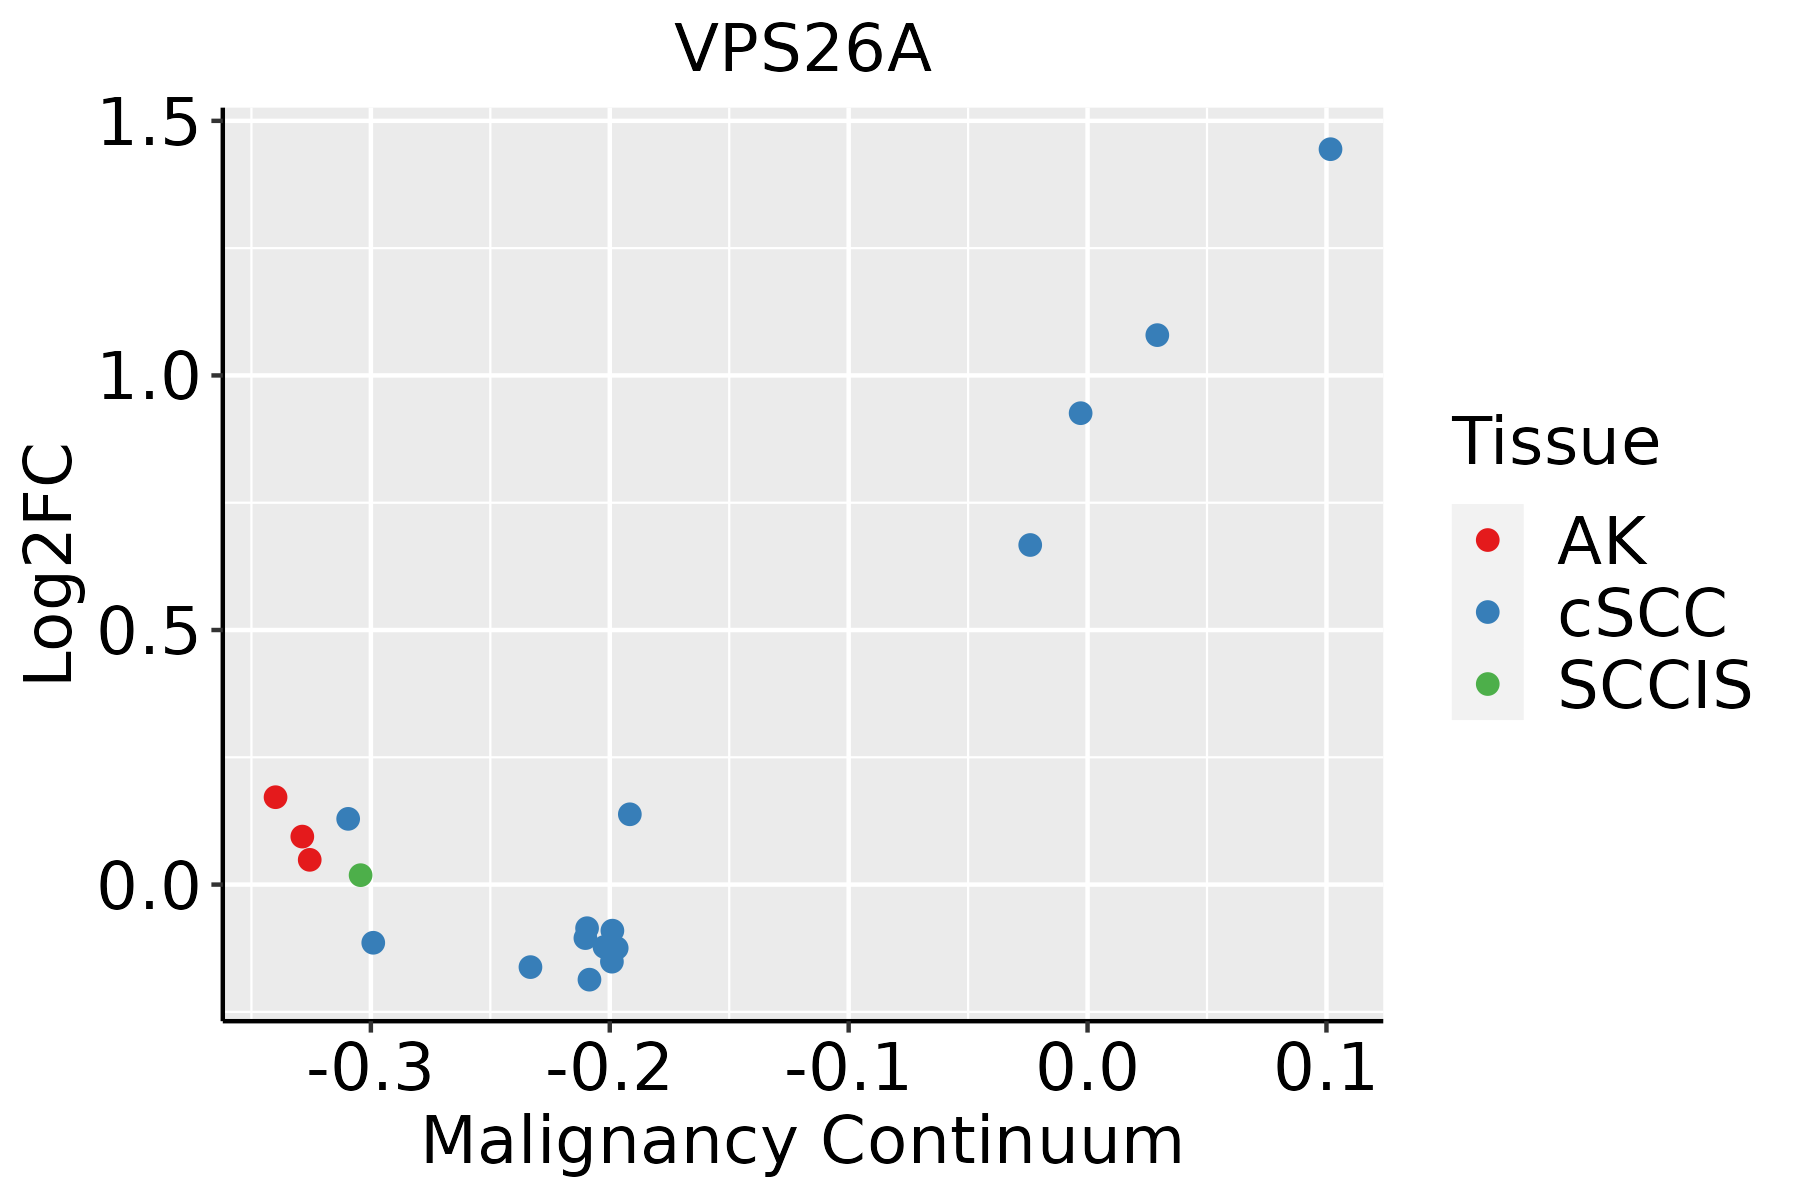 | AK: Actinic keratosis |
| cSCC: Cutaneous squamous cell carcinoma | ||
| SCCIS:squamous cell carcinoma in situ | ||
| Thyroid | 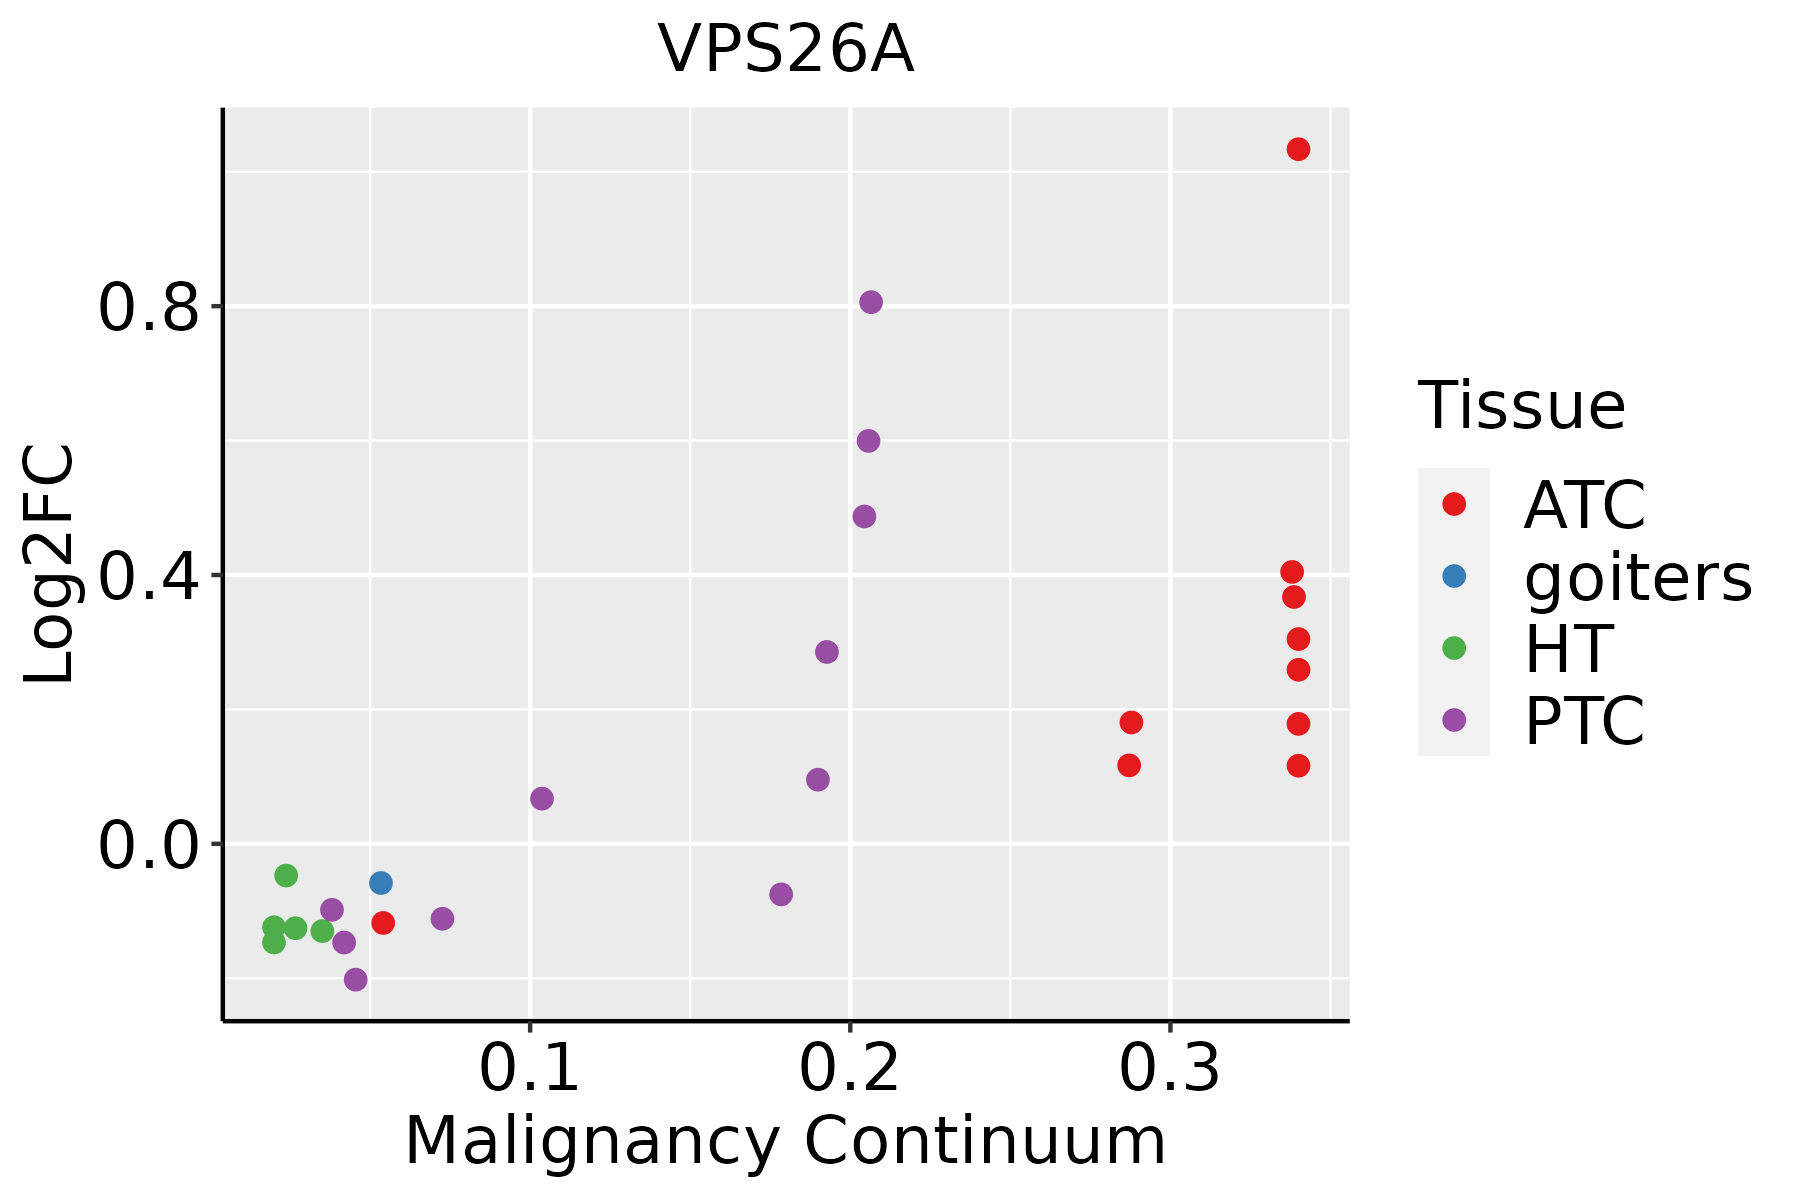 | ATC: Anaplastic thyroid cancer |
| HT: Hashimoto's thyroiditis | ||
| PTC: Papillary thyroid cancer |
| ∗log2FC in expression of this searched gene in stem-like cells from each diseased tissue sample relative to stem-like cells in normal samples in each tissue plotted against the malignancy continuum. Samples are colored based on if they are from different disease stage. |
Top |
Malignant transformation related pathway analysis |
| Find out the enriched GO biological processes and KEGG pathways involved in transition from healthy to precancer to cancer |
| Tissue | Disease Stage | Enriched GO biological Processes |
| Colorectum | AD |  |
| Colorectum | SER |  |
| Colorectum | MSS |  |
| Colorectum | MSI-H |  |
| Colorectum | FAP |  |
| ∗Top 15 enriched GO BP terms are showed in the bar plot of each disease state in each tissue. Each row represents a significant GO biological process which is colored according to the -log10(p.adjust). |
| Page: 1 2 3 4 5 6 7 8 9 |
| GO ID | Tissue | Disease Stage | Description | Gene Ratio | Bg Ratio | pvalue | p.adjust | Count |
| GO:001623617 | Esophagus | ESCC | macroautophagy | 216/8552 | 291/18723 | 1.94e-23 | 4.57e-21 | 216 |
| GO:001050617 | Esophagus | ESCC | regulation of autophagy | 220/8552 | 317/18723 | 6.72e-18 | 6.36e-16 | 220 |
| GO:001619715 | Esophagus | ESCC | endosomal transport | 168/8552 | 230/18723 | 2.28e-17 | 1.93e-15 | 168 |
| GO:001648210 | Esophagus | ESCC | cytosolic transport | 124/8552 | 168/18723 | 9.69e-14 | 4.69e-12 | 124 |
| GO:001624114 | Esophagus | ESCC | regulation of macroautophagy | 102/8552 | 141/18723 | 1.09e-10 | 3.27e-09 | 102 |
| GO:009887615 | Esophagus | ESCC | vesicle-mediated transport to the plasma membrane | 99/8552 | 136/18723 | 1.13e-10 | 3.39e-09 | 99 |
| GO:00421477 | Esophagus | ESCC | retrograde transport, endosome to Golgi | 63/8552 | 91/18723 | 4.58e-06 | 4.87e-05 | 63 |
| GO:00324565 | Esophagus | ESCC | endocytic recycling | 51/8552 | 73/18723 | 2.47e-05 | 2.10e-04 | 51 |
| GO:001623611 | Liver | Cirrhotic | macroautophagy | 129/4634 | 291/18723 | 1.75e-13 | 1.41e-11 | 129 |
| GO:001050611 | Liver | Cirrhotic | regulation of autophagy | 132/4634 | 317/18723 | 2.17e-11 | 1.33e-09 | 132 |
| GO:001648211 | Liver | Cirrhotic | cytosolic transport | 74/4634 | 168/18723 | 3.34e-08 | 1.12e-06 | 74 |
| GO:001619711 | Liver | Cirrhotic | endosomal transport | 93/4634 | 230/18723 | 1.01e-07 | 2.93e-06 | 93 |
| GO:009887611 | Liver | Cirrhotic | vesicle-mediated transport to the plasma membrane | 59/4634 | 136/18723 | 1.46e-06 | 2.88e-05 | 59 |
| GO:00162414 | Liver | Cirrhotic | regulation of macroautophagy | 60/4634 | 141/18723 | 2.57e-06 | 4.63e-05 | 60 |
| GO:004214711 | Liver | Cirrhotic | retrograde transport, endosome to Golgi | 34/4634 | 91/18723 | 5.01e-03 | 2.60e-02 | 34 |
| GO:001623621 | Liver | HCC | macroautophagy | 204/7958 | 291/18723 | 8.66e-22 | 1.41e-19 | 204 |
| GO:001050621 | Liver | HCC | regulation of autophagy | 210/7958 | 317/18723 | 7.59e-18 | 8.45e-16 | 210 |
| GO:001619721 | Liver | HCC | endosomal transport | 154/7958 | 230/18723 | 4.74e-14 | 2.95e-12 | 154 |
| GO:001648221 | Liver | HCC | cytosolic transport | 117/7958 | 168/18723 | 8.83e-13 | 4.48e-11 | 117 |
| GO:001624111 | Liver | HCC | regulation of macroautophagy | 96/7958 | 141/18723 | 6.82e-10 | 2.14e-08 | 96 |
| Page: 1 2 3 4 |
| Pathway ID | Tissue | Disease Stage | Description | Gene Ratio | Bg Ratio | pvalue | p.adjust | qvalue | Count |
| hsa04144210 | Esophagus | ESCC | Endocytosis | 186/4205 | 251/8465 | 9.74e-16 | 4.66e-14 | 2.39e-14 | 186 |
| hsa0414437 | Esophagus | ESCC | Endocytosis | 186/4205 | 251/8465 | 9.74e-16 | 4.66e-14 | 2.39e-14 | 186 |
| hsa0414412 | Liver | Cirrhotic | Endocytosis | 119/2530 | 251/8465 | 2.33e-09 | 4.56e-08 | 2.81e-08 | 119 |
| hsa0414413 | Liver | Cirrhotic | Endocytosis | 119/2530 | 251/8465 | 2.33e-09 | 4.56e-08 | 2.81e-08 | 119 |
| hsa0414422 | Liver | HCC | Endocytosis | 178/4020 | 251/8465 | 2.03e-14 | 5.22e-13 | 2.91e-13 | 178 |
| hsa0414432 | Liver | HCC | Endocytosis | 178/4020 | 251/8465 | 2.03e-14 | 5.22e-13 | 2.91e-13 | 178 |
| hsa0414427 | Oral cavity | OSCC | Endocytosis | 174/3704 | 251/8465 | 9.42e-17 | 4.51e-15 | 2.29e-15 | 174 |
| hsa04144112 | Oral cavity | OSCC | Endocytosis | 174/3704 | 251/8465 | 9.42e-17 | 4.51e-15 | 2.29e-15 | 174 |
| hsa0414428 | Oral cavity | LP | Endocytosis | 121/2418 | 251/8465 | 1.89e-11 | 3.70e-10 | 2.38e-10 | 121 |
| hsa0414436 | Oral cavity | LP | Endocytosis | 121/2418 | 251/8465 | 1.89e-11 | 3.70e-10 | 2.38e-10 | 121 |
| hsa0414461 | Oral cavity | NEOLP | Endocytosis | 62/1112 | 251/8465 | 3.56e-07 | 4.92e-06 | 3.09e-06 | 62 |
| hsa0414471 | Oral cavity | NEOLP | Endocytosis | 62/1112 | 251/8465 | 3.56e-07 | 4.92e-06 | 3.09e-06 | 62 |
| Page: 1 |
Top |
Cell-cell communication analysis |
| Identification of potential cell-cell interactions between two cell types and their ligand-receptor pairs for different disease states |
| Ligand | Receptor | LRpair | Pathway | Tissue | Disease Stage |
| Page: 1 |
Top |
Single-cell gene regulatory network inference analysis |
| Find out the significant the regulons (TFs) and the target genes of each regulon across cell types for different disease states |
| TF | Cell Type | Tissue | Disease Stage | Target Gene | RSS | Regulon Activity |
| ∗The dot plots of a searched regulon are shown for all cell subpopulations in each disease state of each tissue based on the regulon specific score inferred using pySCENIC and by calculating the average expression. |
| Page: 1 |
Top |
Somatic mutation of malignant transformation related genes |
| Annotation of somatic variants for genes involved in malignant transformation |
| Hugo Symbol | Variant Class | Variant Classification | dbSNP RS | HGVSc | HGVSp | HGVSp Short | SWISSPROT | BIOTYPE | SIFT | PolyPhen | Tumor Sample Barcode | Tissue | Histology | Sex | Age | Stage | Therapy Types | Drugs | Outcome |
| VPS26A | SNV | Missense_Mutation | c.206G>A | p.Arg69Lys | p.R69K | O75436 | protein_coding | tolerated(1) | benign(0.003) | TCGA-A8-A0A7-01 | Breast | breast invasive carcinoma | Female | <65 | I/II | Unknown | Unknown | SD | |
| VPS26A | SNV | Missense_Mutation | rs766824852 | c.407T>C | p.Ile136Thr | p.I136T | O75436 | protein_coding | tolerated(0.06) | benign(0.125) | TCGA-BH-A1EU-01 | Breast | breast invasive carcinoma | Female | >=65 | I/II | Unknown | Unknown | SD |
| VPS26A | SNV | Missense_Mutation | c.133N>A | p.Gly45Arg | p.G45R | O75436 | protein_coding | deleterious(0.02) | probably_damaging(0.983) | TCGA-D8-A140-01 | Breast | breast invasive carcinoma | Female | <65 | I/II | Chemotherapy | doxorubicin+cyclophosphamid | SD | |
| VPS26A | SNV | Missense_Mutation | c.328N>C | p.Glu110Gln | p.E110Q | O75436 | protein_coding | deleterious(0.02) | possibly_damaging(0.649) | TCGA-D8-A1JA-01 | Breast | breast invasive carcinoma | Female | <65 | III/IV | Chemotherapy | adriamycin | PD | |
| VPS26A | SNV | Missense_Mutation | c.416N>A | p.Arg139Lys | p.R139K | O75436 | protein_coding | tolerated(0.29) | benign(0.095) | TCGA-E9-A228-01 | Breast | breast invasive carcinoma | Female | <65 | I/II | Chemotherapy | doxorubicin | SD | |
| VPS26A | insertion | Frame_Shift_Ins | novel | c.598_599insATTATAGGCATGAGCCACCGCGCCCAACATATTTTTT | p.Val200AspfsTer47 | p.V200Dfs*47 | O75436 | protein_coding | TCGA-AN-A0FX-01 | Breast | breast invasive carcinoma | Female | <65 | I/II | Unknown | Unknown | SD | ||
| VPS26A | SNV | Missense_Mutation | rs140007940 | c.981N>A | p.Met327Ile | p.M327I | O75436 | protein_coding | tolerated_low_confidence(0.08) | benign(0) | TCGA-DM-A1HA-01 | Colorectum | colon adenocarcinoma | Male | >=65 | III/IV | Unknown | Unknown | SD |
| VPS26A | SNV | Missense_Mutation | c.860T>C | p.Phe287Ser | p.F287S | O75436 | protein_coding | deleterious(0) | probably_damaging(0.995) | TCGA-DM-A28M-01 | Colorectum | colon adenocarcinoma | Male | <65 | I/II | Unknown | Unknown | SD | |
| VPS26A | SNV | Missense_Mutation | novel | c.227N>G | p.Ile76Ser | p.I76S | O75436 | protein_coding | deleterious(0) | probably_damaging(1) | TCGA-AG-A002-01 | Colorectum | rectum adenocarcinoma | Male | <65 | I/II | Unknown | Unknown | SD |
| VPS26A | SNV | Missense_Mutation | rs761116648 | c.472N>A | p.Pro158Thr | p.P158T | O75436 | protein_coding | deleterious(0.02) | possibly_damaging(0.78) | TCGA-A5-A0G2-01 | Endometrium | uterine corpus endometrioid carcinoma | Female | <65 | III/IV | Unknown | Unknown | SD |
| Page: 1 2 3 |
Top |
Related drugs of malignant transformation related genes |
| Identification of chemicals and drugs interact with genes involved in malignant transfromation |
| (DGIdb 4.0) |
| Entrez ID | Symbol | Category | Interaction Types | Drug Claim Name | Drug Name | PMIDs |
| Page: 1 |

Copyright 2023-Present -The University of Texas Health Science Center at Houston |