
|
|||||
|
 | |
| |
| |
| |
| |
| |
|
Gene: USP53 |
Gene summary for USP53 |
| Gene information | Species | Human | Gene symbol | USP53 | Gene ID | 54532 |
| Gene name | ubiquitin specific peptidase 53 | |
| Gene Alias | USP53 | |
| Cytomap | 4q26 | |
| Gene Type | protein-coding | GO ID | GO:0001508 | UniProtAcc | Q70EK8 |
Top |
Malignant transformation analysis |
| Identification of the aberrant gene expression in precancerous and cancerous lesions by comparing the gene expression of stem-like cells in diseased tissues with normal stem cells |
| Entrez ID | Symbol | Replicates | Species | Organ | Tissue | Adj P-value | Log2FC | Malignancy |
| 54532 | USP53 | A015-C-005 | Human | Colorectum | FAP | 8.89e-06 | -3.54e-01 | -0.0336 |
| 54532 | USP53 | A015-C-006 | Human | Colorectum | FAP | 3.93e-30 | -8.85e-01 | -0.0994 |
| 54532 | USP53 | A015-C-106 | Human | Colorectum | FAP | 3.02e-17 | -4.73e-01 | -0.0511 |
| 54532 | USP53 | A002-C-114 | Human | Colorectum | FAP | 3.08e-24 | -5.12e-01 | -0.1561 |
| 54532 | USP53 | A015-C-104 | Human | Colorectum | FAP | 9.01e-39 | -6.32e-01 | -0.1899 |
| 54532 | USP53 | A001-C-014 | Human | Colorectum | FAP | 1.13e-20 | -3.78e-01 | 0.0135 |
| 54532 | USP53 | A002-C-016 | Human | Colorectum | FAP | 6.27e-36 | -6.11e-01 | 0.0521 |
| 54532 | USP53 | A015-C-002 | Human | Colorectum | FAP | 2.30e-20 | -6.71e-01 | -0.0763 |
| 54532 | USP53 | A001-C-007 | Human | Colorectum | CRC | 2.93e-03 | -4.74e-01 | 0.1899 |
| 54532 | USP53 | A001-C-203 | Human | Colorectum | FAP | 7.49e-11 | -2.51e-01 | -0.0481 |
| 54532 | USP53 | A002-C-116 | Human | Colorectum | FAP | 2.67e-43 | -5.71e-01 | -0.0452 |
| 54532 | USP53 | A014-C-008 | Human | Colorectum | FAP | 3.76e-20 | -6.00e-01 | -0.191 |
| 54532 | USP53 | A018-E-020 | Human | Colorectum | FAP | 2.67e-27 | -4.99e-01 | -0.2034 |
| 54532 | USP53 | F034 | Human | Colorectum | FAP | 2.11e-28 | -4.62e-01 | -0.0665 |
| 54532 | USP53 | F072B | Human | Colorectum | FAP | 3.22e-05 | -9.47e-02 | 0.257 |
| 54532 | USP53 | CRC-1-8810 | Human | Colorectum | CRC | 5.54e-33 | -7.02e-01 | 0.6257 |
| 54532 | USP53 | CRC-3-11773 | Human | Colorectum | CRC | 5.41e-12 | -4.15e-01 | 0.2564 |
| 54532 | USP53 | AEH-subject1 | Human | Endometrium | AEH | 1.27e-05 | 4.66e-01 | -0.3059 |
| 54532 | USP53 | AEH-subject4 | Human | Endometrium | AEH | 3.52e-05 | 4.50e-01 | -0.2657 |
| 54532 | USP53 | AEH-subject5 | Human | Endometrium | AEH | 6.81e-17 | 7.59e-01 | -0.2953 |
| Page: 1 2 3 4 5 6 7 8 9 10 |
| Tissue | Expression Dynamics | Abbreviation |
| Breast | 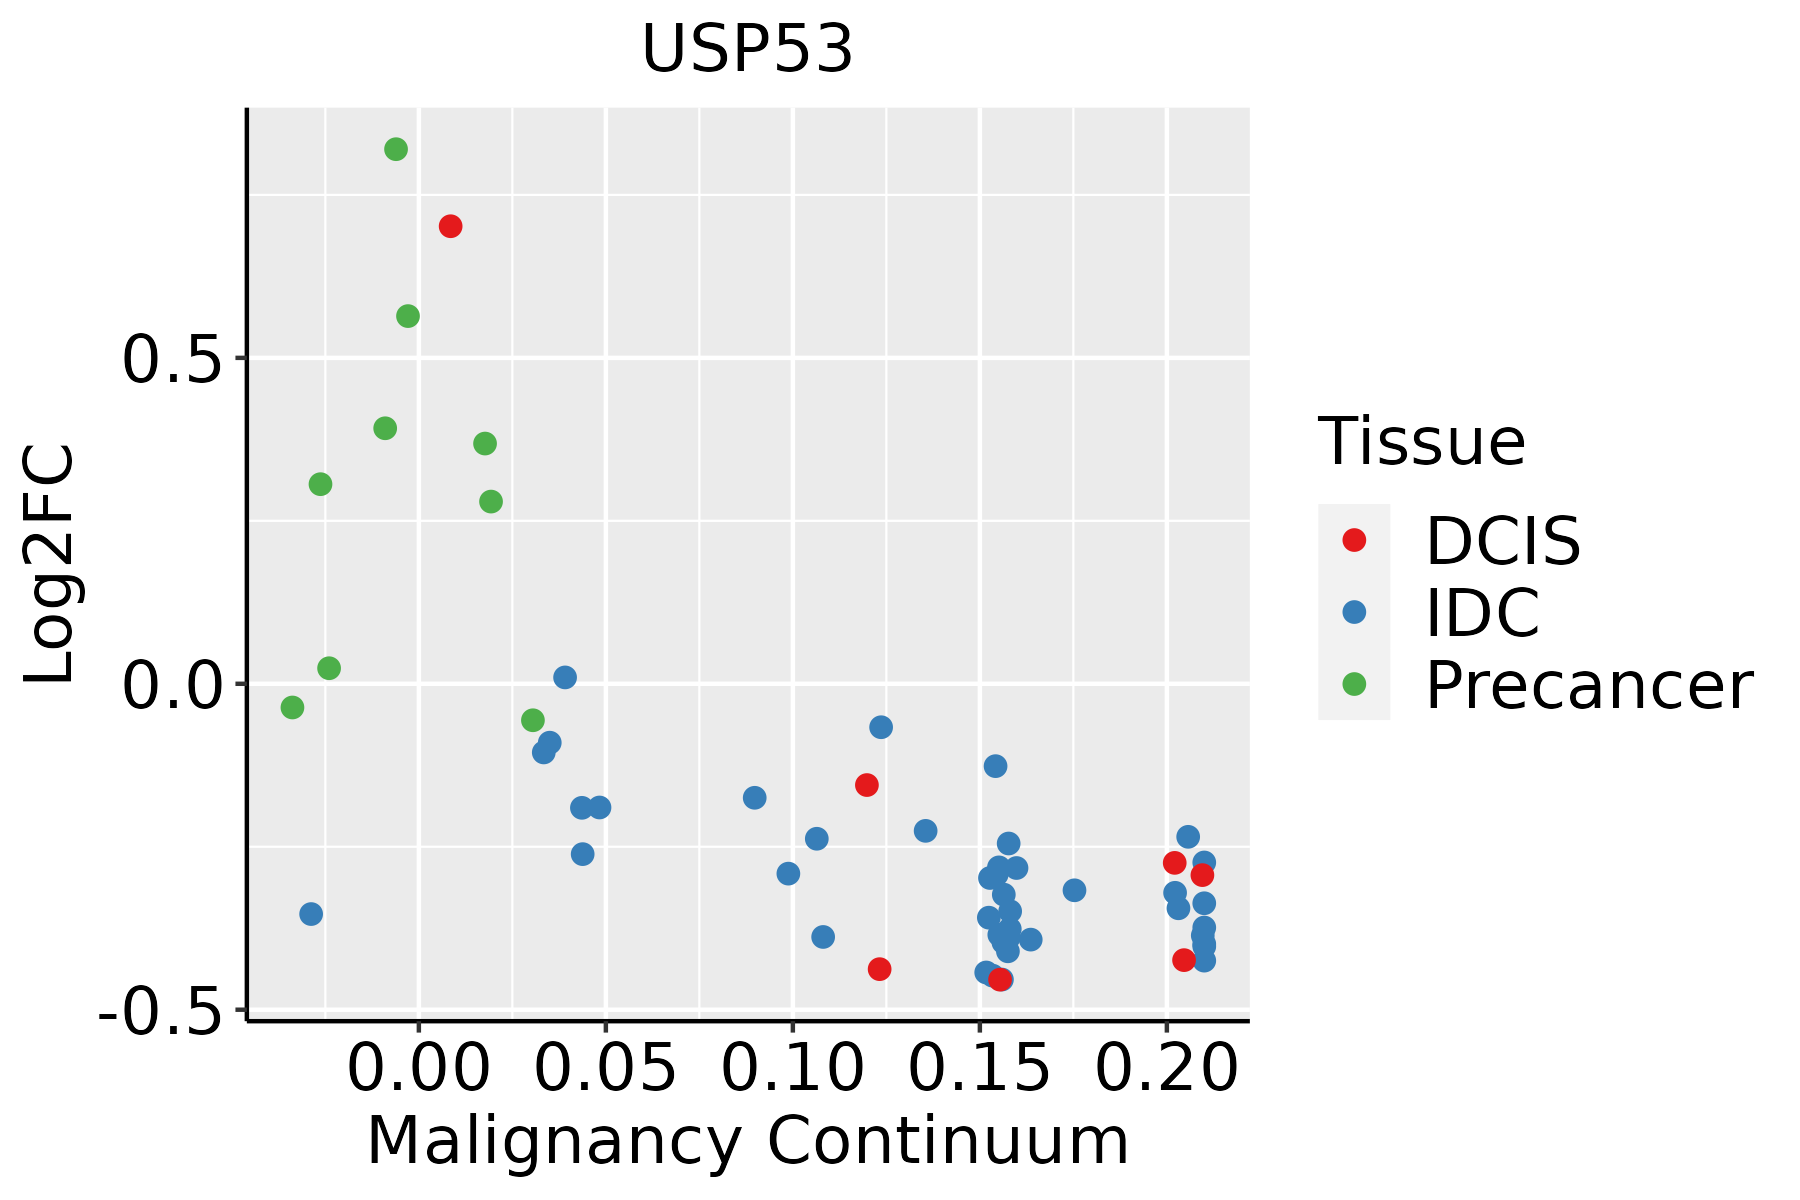 | IDC: Invasive ductal carcinoma |
| DCIS: Ductal carcinoma in situ | ||
| Precancer(BRCA1-mut): Precancerous lesion from BRCA1 mutation carriers | ||
| Cervix | 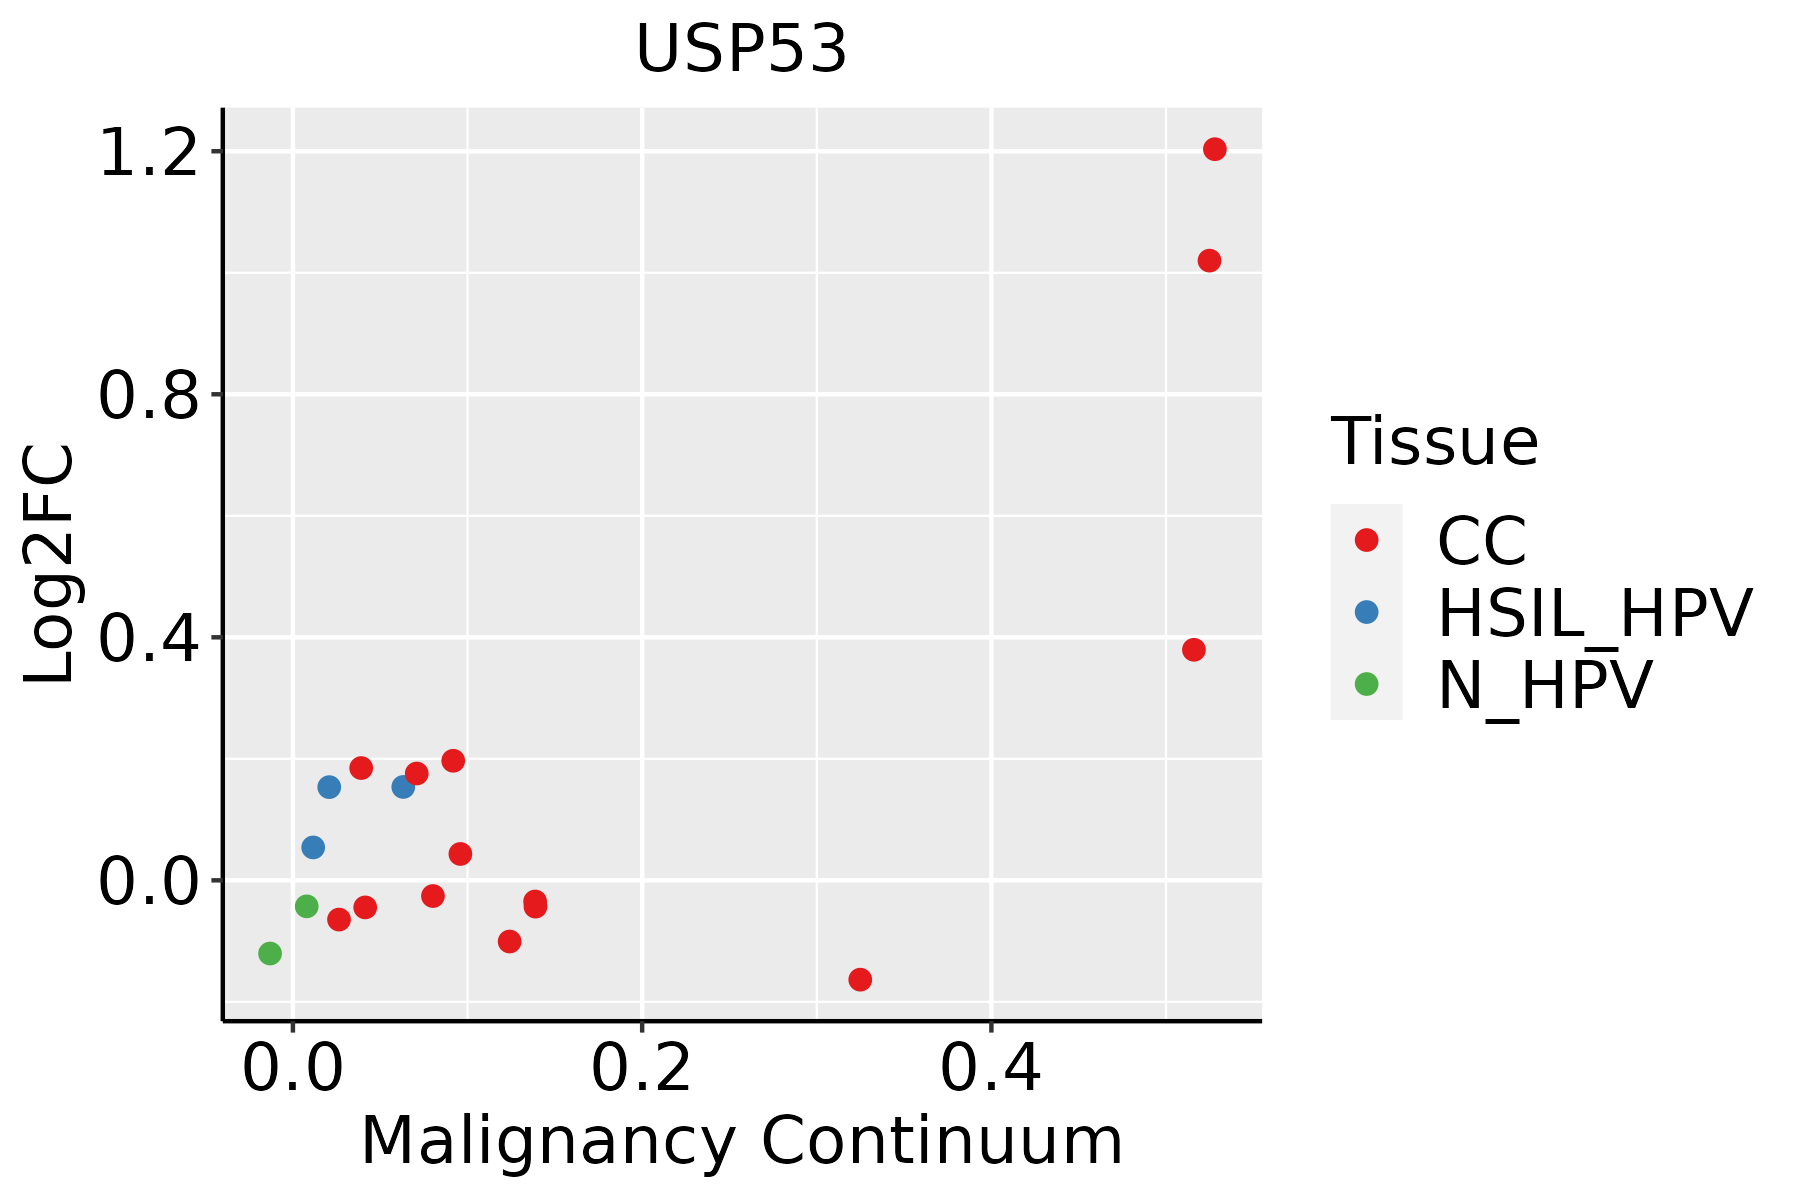 | CC: Cervix cancer |
| HSIL_HPV: HPV-infected high-grade squamous intraepithelial lesions | ||
| N_HPV: HPV-infected normal cervix | ||
| Colorectum (GSE201348) |  | FAP: Familial adenomatous polyposis |
| CRC: Colorectal cancer | ||
| Colorectum (HTA11) |  | AD: Adenomas |
| SER: Sessile serrated lesions | ||
| MSI-H: Microsatellite-high colorectal cancer | ||
| MSS: Microsatellite stable colorectal cancer | ||
| Endometrium | 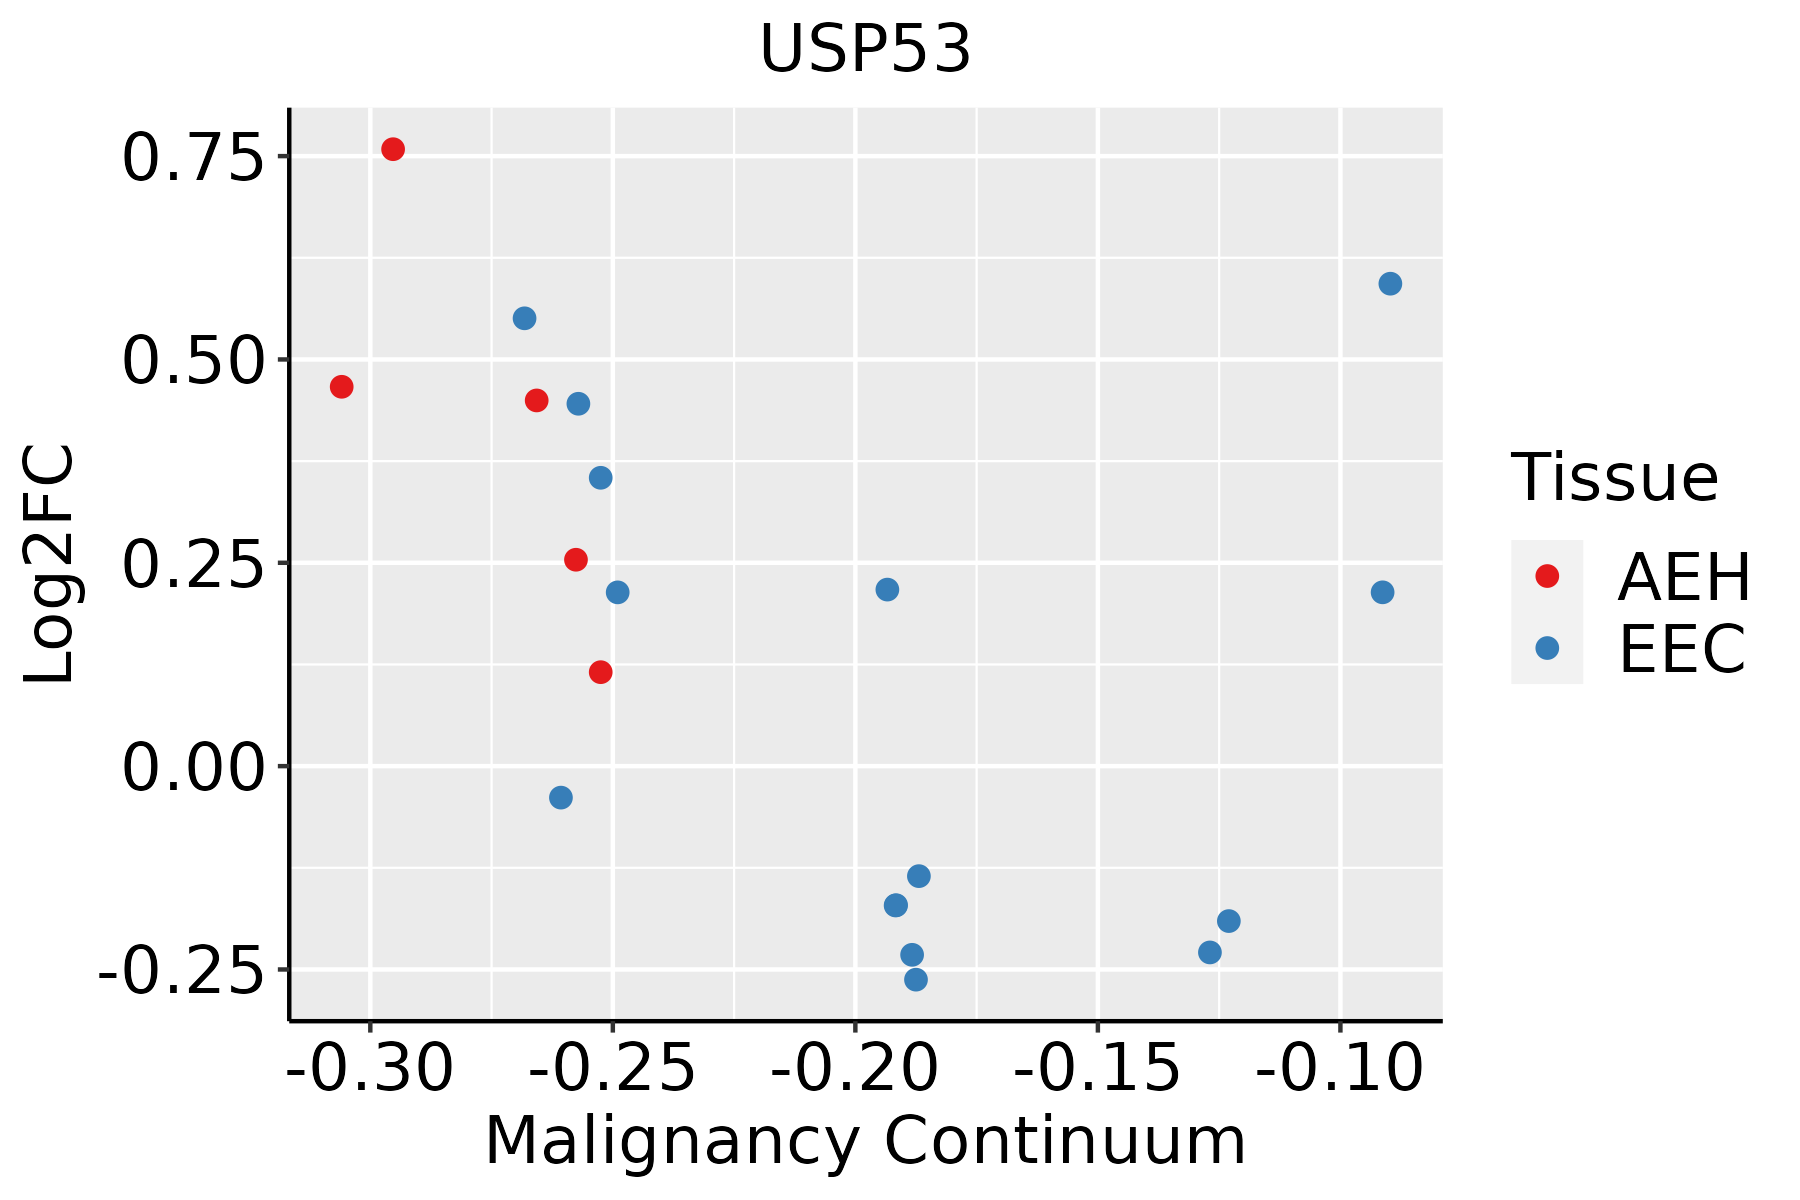 | AEH: Atypical endometrial hyperplasia |
| EEC: Endometrioid Cancer | ||
| Esophagus | 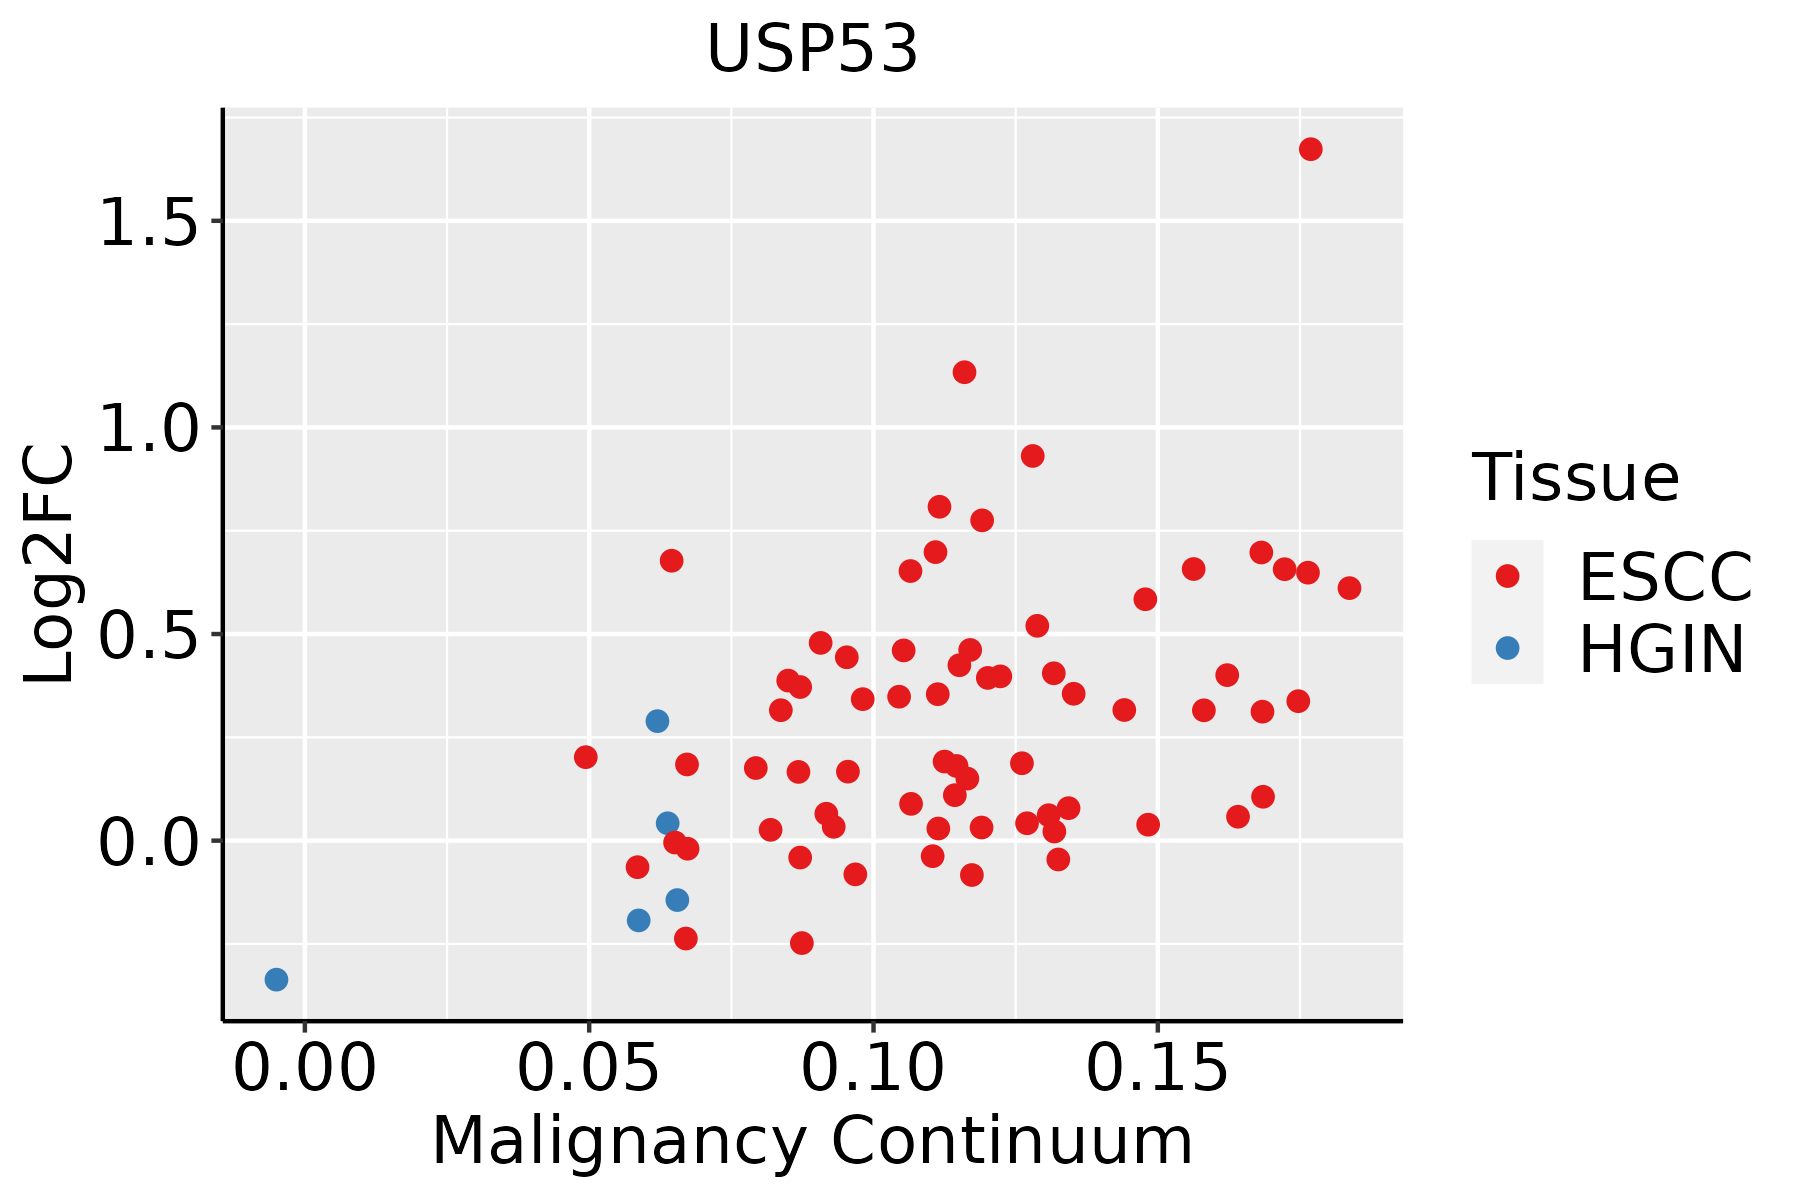 | ESCC: Esophageal squamous cell carcinoma |
| HGIN: High-grade intraepithelial neoplasias | ||
| LGIN: Low-grade intraepithelial neoplasias | ||
| Lung | 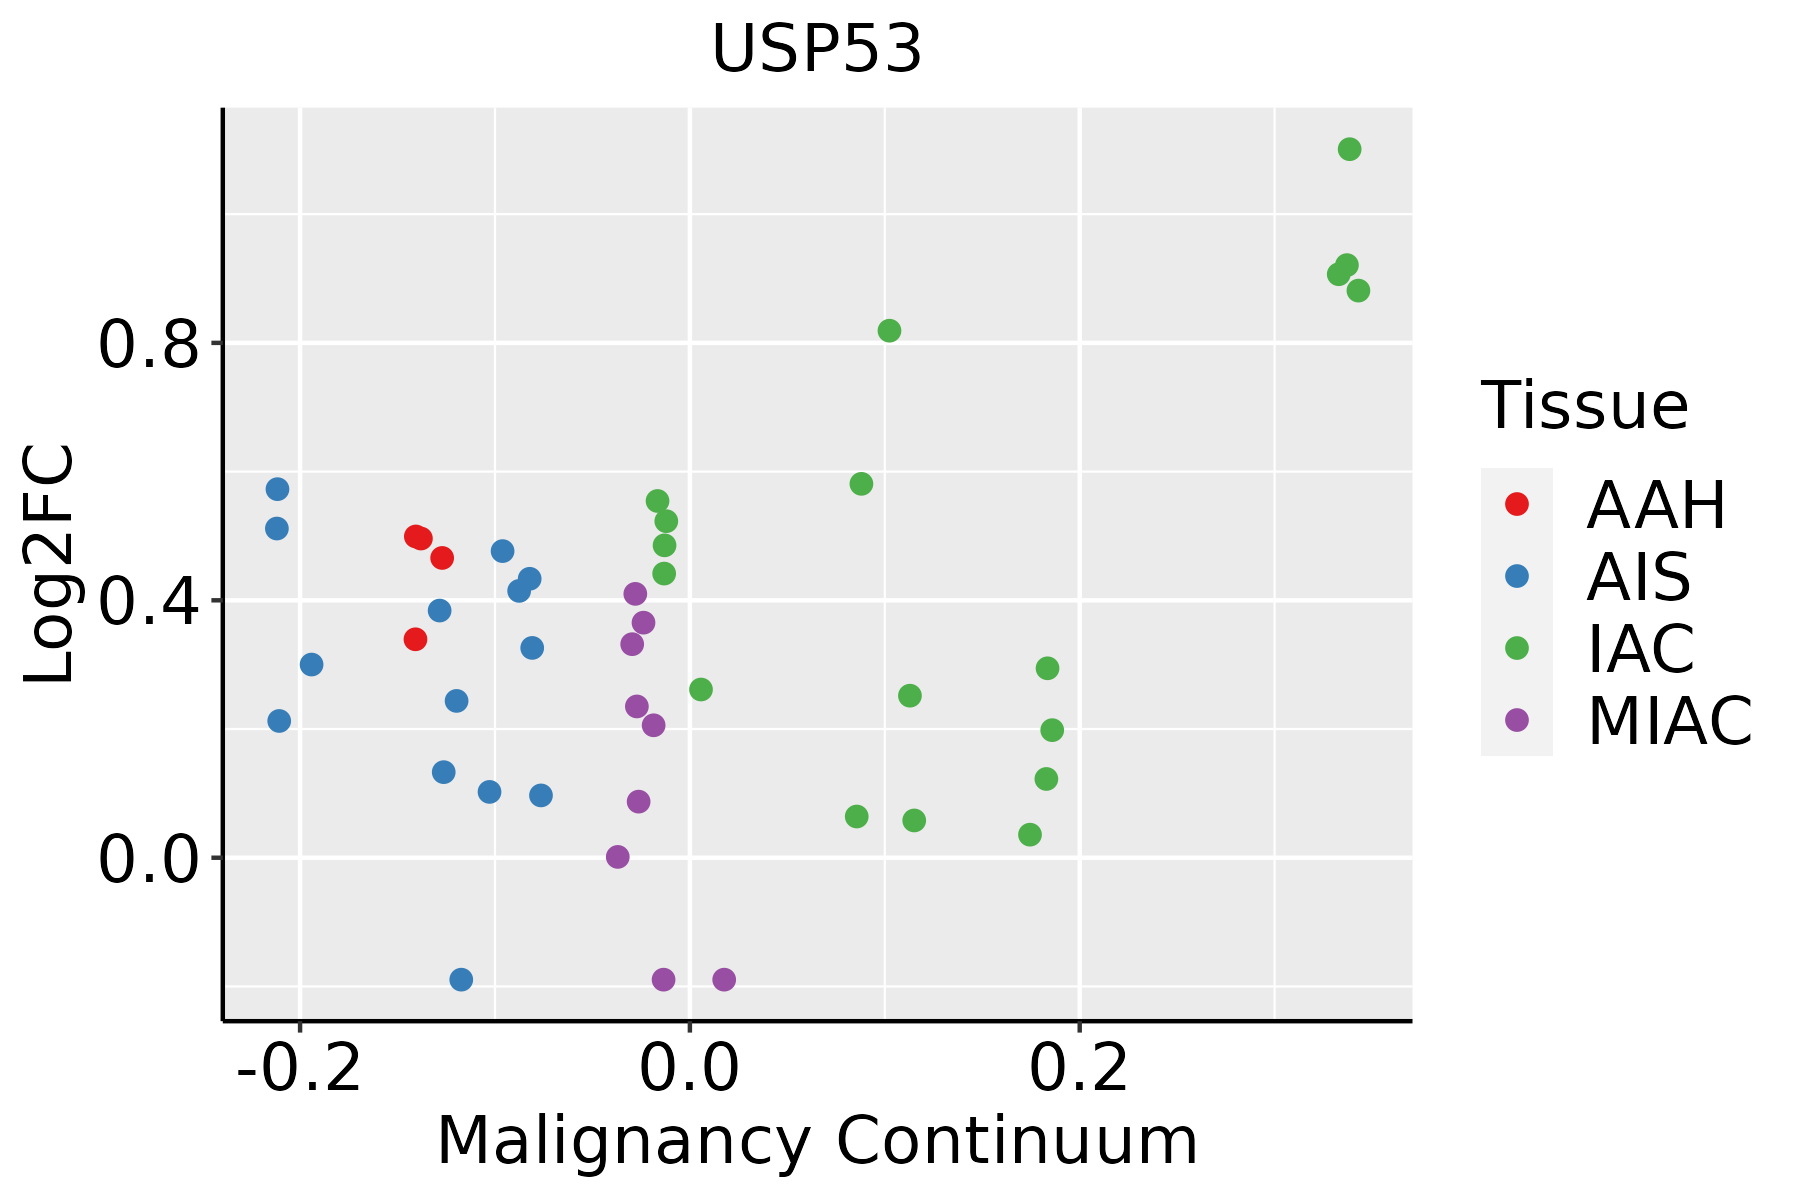 | AAH: Atypical adenomatous hyperplasia |
| AIS: Adenocarcinoma in situ | ||
| IAC: Invasive lung adenocarcinoma | ||
| MIA: Minimally invasive adenocarcinoma | ||
| Oral Cavity | 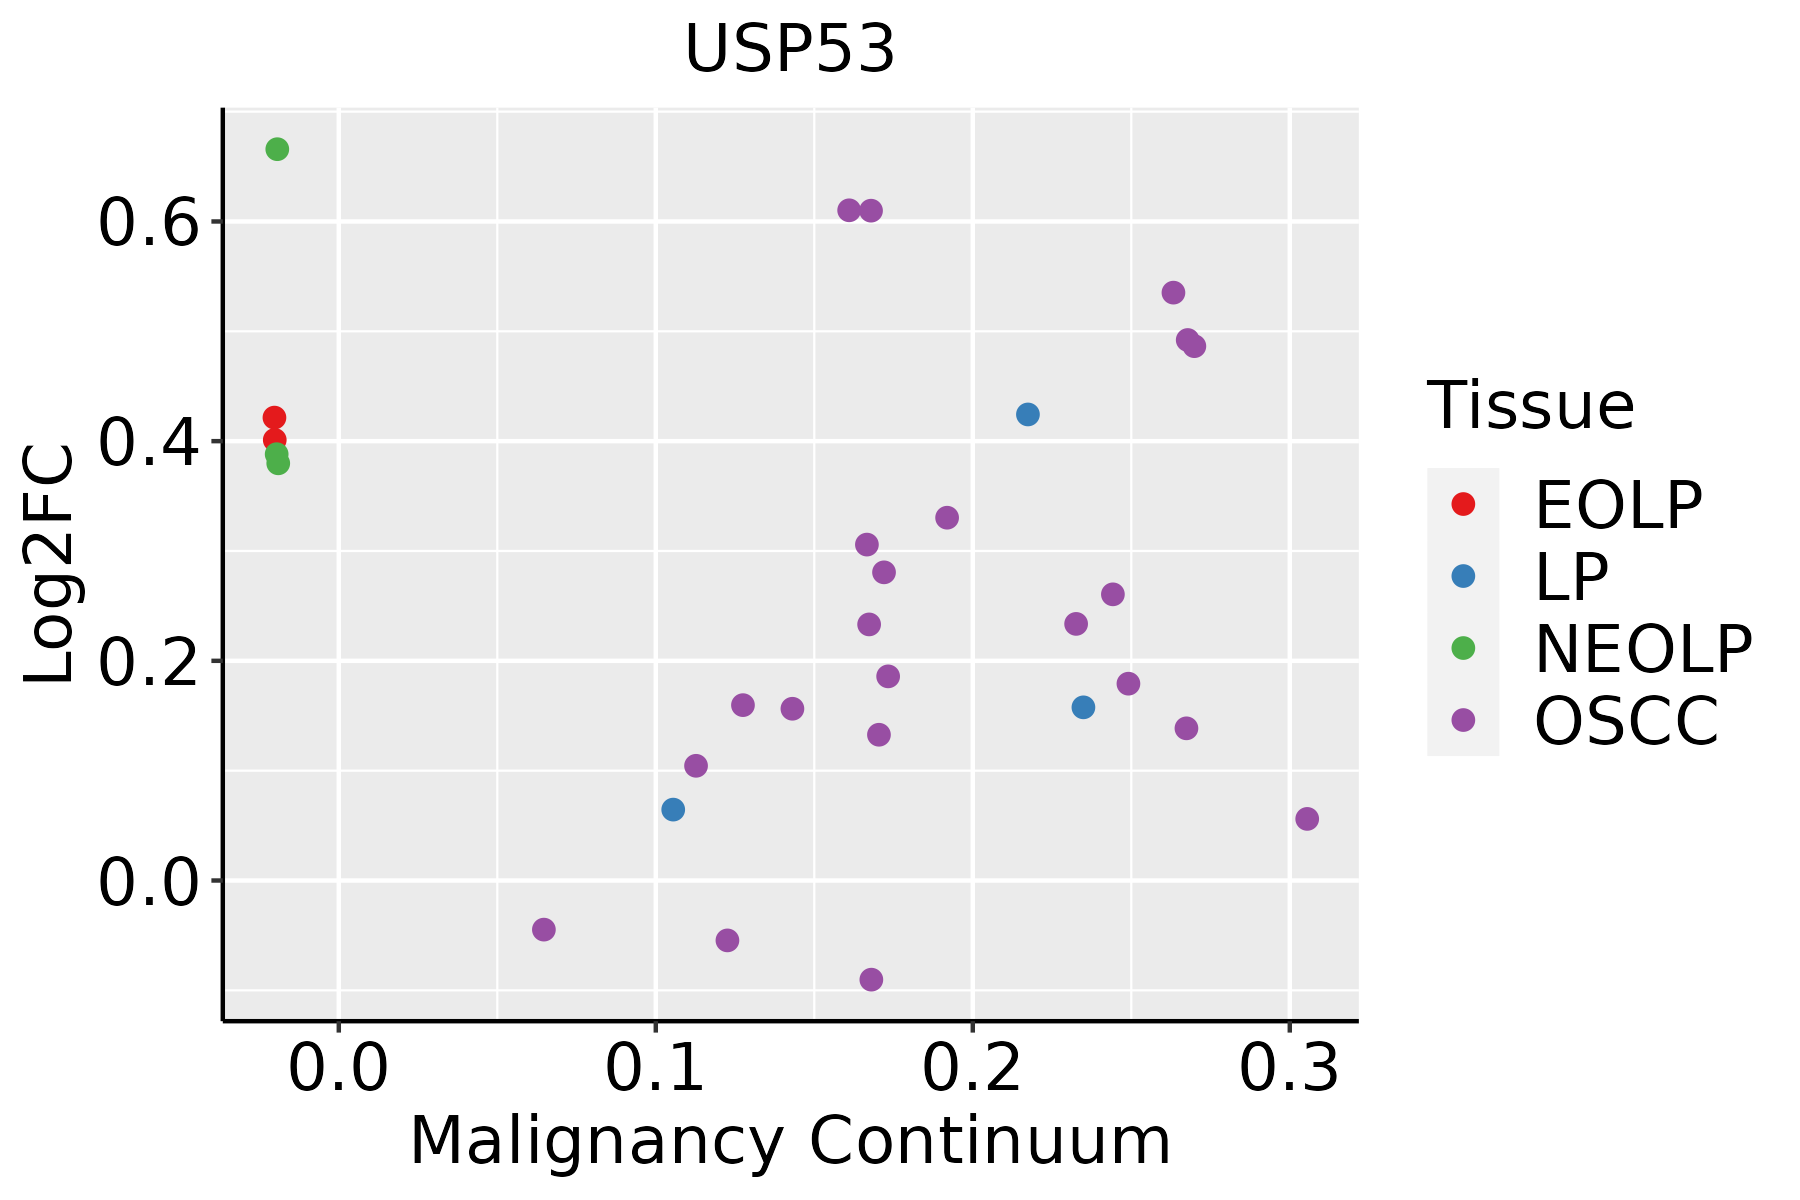 | EOLP: Erosive Oral lichen planus |
| LP: leukoplakia | ||
| NEOLP: Non-erosive oral lichen planus | ||
| OSCC: Oral squamous cell carcinoma | ||
| Thyroid | 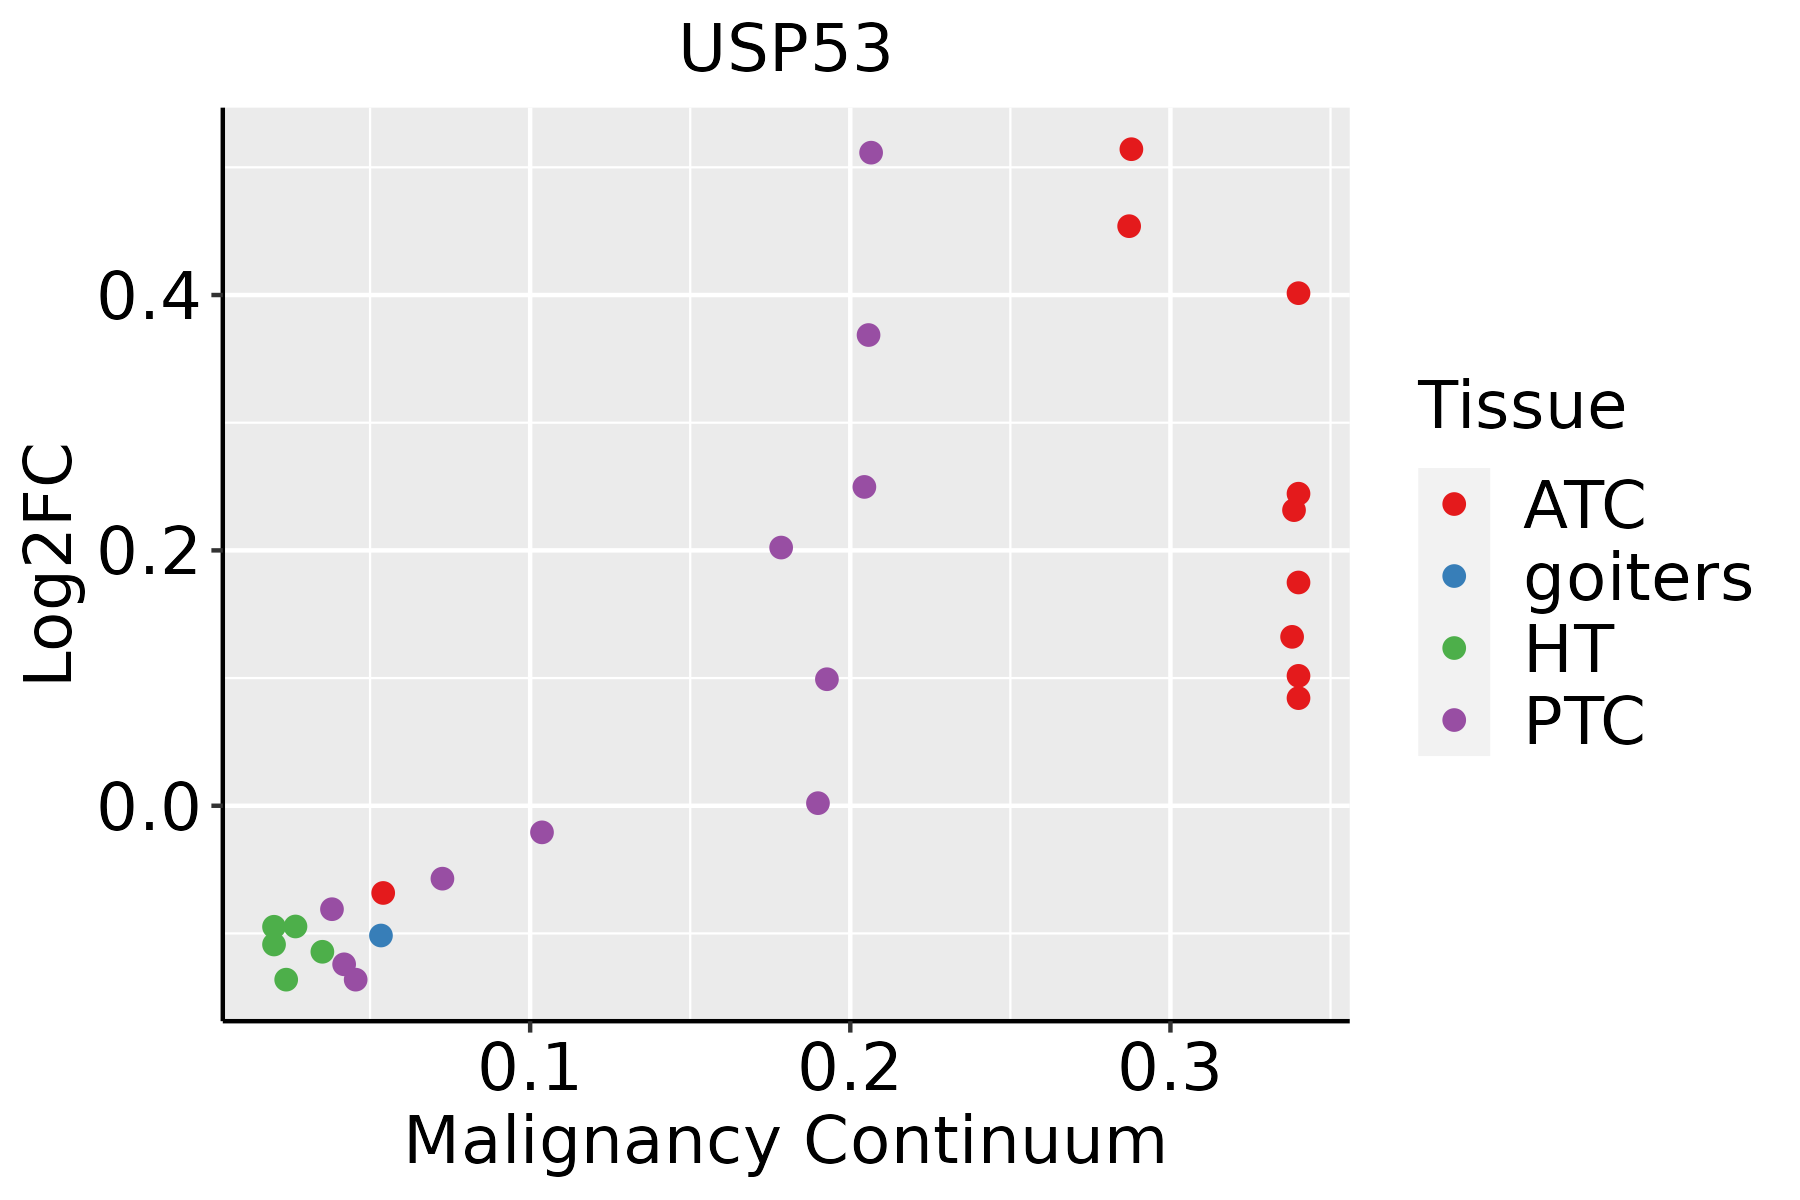 | ATC: Anaplastic thyroid cancer |
| HT: Hashimoto's thyroiditis | ||
| PTC: Papillary thyroid cancer |
| ∗log2FC in expression of this searched gene in stem-like cells from each diseased tissue sample relative to stem-like cells in normal samples in each tissue plotted against the malignancy continuum. Samples are colored based on if they are from different disease stage. |
Top |
Malignant transformation related pathway analysis |
| Find out the enriched GO biological processes and KEGG pathways involved in transition from healthy to precancer to cancer |
| Tissue | Disease Stage | Enriched GO biological Processes |
| Colorectum | AD |  |
| Colorectum | SER |  |
| Colorectum | MSS |  |
| Colorectum | MSI-H |  |
| Colorectum | FAP |  |
| ∗Top 15 enriched GO BP terms are showed in the bar plot of each disease state in each tissue. Each row represents a significant GO biological process which is colored according to the -log10(p.adjust). |
| Page: 1 2 3 4 5 6 7 8 9 |
| GO ID | Tissue | Disease Stage | Description | Gene Ratio | Bg Ratio | pvalue | p.adjust | Count |
| GO:00709979 | Breast | Precancer | neuron death | 50/1080 | 361/18723 | 7.75e-09 | 5.70e-07 | 50 |
| GO:00514029 | Breast | Precancer | neuron apoptotic process | 38/1080 | 246/18723 | 2.68e-08 | 1.75e-06 | 38 |
| GO:00096126 | Breast | Precancer | response to mechanical stimulus | 23/1080 | 216/18723 | 3.41e-03 | 2.85e-02 | 23 |
| GO:007099714 | Breast | IDC | neuron death | 57/1434 | 361/18723 | 1.31e-07 | 7.38e-06 | 57 |
| GO:005140213 | Breast | IDC | neuron apoptotic process | 42/1434 | 246/18723 | 7.21e-07 | 3.35e-05 | 42 |
| GO:000961211 | Breast | IDC | response to mechanical stimulus | 34/1434 | 216/18723 | 4.59e-05 | 1.03e-03 | 34 |
| GO:00423912 | Breast | IDC | regulation of membrane potential | 49/1434 | 434/18723 | 4.04e-03 | 3.25e-02 | 49 |
| GO:00015082 | Breast | IDC | action potential | 19/1434 | 134/18723 | 6.62e-03 | 4.62e-02 | 19 |
| GO:007099724 | Breast | DCIS | neuron death | 57/1390 | 361/18723 | 4.56e-08 | 2.84e-06 | 57 |
| GO:005140222 | Breast | DCIS | neuron apoptotic process | 43/1390 | 246/18723 | 1.16e-07 | 6.13e-06 | 43 |
| GO:000961221 | Breast | DCIS | response to mechanical stimulus | 32/1390 | 216/18723 | 1.36e-04 | 2.33e-03 | 32 |
| GO:00423911 | Breast | DCIS | regulation of membrane potential | 47/1390 | 434/18723 | 5.87e-03 | 4.20e-02 | 47 |
| GO:00096127 | Cervix | CC | response to mechanical stimulus | 48/2311 | 216/18723 | 3.23e-05 | 5.29e-04 | 48 |
| GO:007099710 | Cervix | CC | neuron death | 70/2311 | 361/18723 | 7.50e-05 | 1.03e-03 | 70 |
| GO:005140210 | Cervix | CC | neuron apoptotic process | 49/2311 | 246/18723 | 4.48e-04 | 4.48e-03 | 49 |
| GO:0070997 | Colorectum | AD | neuron death | 114/3918 | 361/18723 | 1.13e-06 | 3.72e-05 | 114 |
| GO:0051402 | Colorectum | AD | neuron apoptotic process | 77/3918 | 246/18723 | 8.07e-05 | 1.28e-03 | 77 |
| GO:00709971 | Colorectum | SER | neuron death | 84/2897 | 361/18723 | 5.76e-05 | 1.35e-03 | 84 |
| GO:00514021 | Colorectum | SER | neuron apoptotic process | 60/2897 | 246/18723 | 1.65e-04 | 3.13e-03 | 60 |
| GO:00709972 | Colorectum | MSS | neuron death | 97/3467 | 361/18723 | 5.21e-05 | 9.31e-04 | 97 |
| Page: 1 2 3 4 |
| Pathway ID | Tissue | Disease Stage | Description | Gene Ratio | Bg Ratio | pvalue | p.adjust | qvalue | Count |
| Page: 1 |
Top |
Cell-cell communication analysis |
| Identification of potential cell-cell interactions between two cell types and their ligand-receptor pairs for different disease states |
| Ligand | Receptor | LRpair | Pathway | Tissue | Disease Stage |
| Page: 1 |
Top |
Single-cell gene regulatory network inference analysis |
| Find out the significant the regulons (TFs) and the target genes of each regulon across cell types for different disease states |
| TF | Cell Type | Tissue | Disease Stage | Target Gene | RSS | Regulon Activity |
| ∗The dot plots of a searched regulon are shown for all cell subpopulations in each disease state of each tissue based on the regulon specific score inferred using pySCENIC and by calculating the average expression. |
| Page: 1 |
Top |
Somatic mutation of malignant transformation related genes |
| Annotation of somatic variants for genes involved in malignant transformation |
| Hugo Symbol | Variant Class | Variant Classification | dbSNP RS | HGVSc | HGVSp | HGVSp Short | SWISSPROT | BIOTYPE | SIFT | PolyPhen | Tumor Sample Barcode | Tissue | Histology | Sex | Age | Stage | Therapy Types | Drugs | Outcome |
| USP53 | SNV | Missense_Mutation | novel | c.268N>A | p.Glu90Lys | p.E90K | Q70EK8 | protein_coding | deleterious(0.01) | probably_damaging(0.991) | TCGA-5T-A9QA-01 | Breast | breast invasive carcinoma | Female | <65 | I/II | Chemotherapy | taxol | SD |
| USP53 | SNV | Missense_Mutation | novel | c.671N>T | p.Cys224Phe | p.C224F | Q70EK8 | protein_coding | deleterious(0) | probably_damaging(1) | TCGA-AC-A8OQ-01 | Breast | breast invasive carcinoma | Female | >=65 | I/II | Unknown | Unknown | SD |
| USP53 | SNV | Missense_Mutation | c.383N>C | p.Leu128Ser | p.L128S | Q70EK8 | protein_coding | deleterious(0) | probably_damaging(0.983) | TCGA-AN-A0AK-01 | Breast | breast invasive carcinoma | Female | >=65 | I/II | Unknown | Unknown | SD | |
| USP53 | SNV | Missense_Mutation | c.1505N>G | p.His502Arg | p.H502R | Q70EK8 | protein_coding | tolerated(0.19) | benign(0.024) | TCGA-AO-A0JD-01 | Breast | breast invasive carcinoma | Female | <65 | III/IV | Chemotherapy | cyclophosphamide | SD | |
| USP53 | SNV | Missense_Mutation | c.884N>A | p.Ile295Asn | p.I295N | Q70EK8 | protein_coding | deleterious(0) | probably_damaging(0.999) | TCGA-AR-A0TR-01 | Breast | breast invasive carcinoma | Female | >=65 | I/II | Hormone Therapy | tamoxiphen | SD | |
| USP53 | SNV | Missense_Mutation | c.1348C>G | p.Leu450Val | p.L450V | Q70EK8 | protein_coding | tolerated(0.21) | benign(0.039) | TCGA-AR-A0TX-01 | Breast | breast invasive carcinoma | Female | <65 | I/II | Unknown | Unknown | SD | |
| USP53 | SNV | Missense_Mutation | rs749089898 | c.2362G>A | p.Glu788Lys | p.E788K | Q70EK8 | protein_coding | tolerated_low_confidence(0.06) | possibly_damaging(0.551) | TCGA-AR-A2LE-01 | Breast | breast invasive carcinoma | Female | >=65 | I/II | Hormone Therapy | tamoxiphen | PD |
| USP53 | SNV | Missense_Mutation | c.2780N>T | p.Lys927Met | p.K927M | Q70EK8 | protein_coding | deleterious_low_confidence(0) | probably_damaging(0.998) | TCGA-D8-A1Y0-01 | Breast | breast invasive carcinoma | Female | >=65 | III/IV | Chemotherapy | cyclophosphamide+methotrexatum+fluorouracillum | SD | |
| USP53 | SNV | Missense_Mutation | rs766783806 | c.2210G>A | p.Arg737His | p.R737H | Q70EK8 | protein_coding | tolerated_low_confidence(0.66) | benign(0) | TCGA-2W-A8YY-01 | Cervix | cervical & endocervical cancer | Female | <65 | I/II | Chemotherapy | cisplatin | CR |
| USP53 | SNV | Missense_Mutation | c.310N>A | p.Glu104Lys | p.E104K | Q70EK8 | protein_coding | tolerated(0.22) | possibly_damaging(0.759) | TCGA-C5-A1BK-01 | Cervix | cervical & endocervical cancer | Female | <65 | I/II | Unknown | Unknown | SD |
| Page: 1 2 3 4 5 6 7 8 9 10 |
Top |
Related drugs of malignant transformation related genes |
| Identification of chemicals and drugs interact with genes involved in malignant transfromation |
| (DGIdb 4.0) |
| Entrez ID | Symbol | Category | Interaction Types | Drug Claim Name | Drug Name | PMIDs |
| Page: 1 |

Copyright 2023-Present -The University of Texas Health Science Center at Houston |