
|
|||||
|
 | |
| |
| |
| |
| |
| |
|
Gene: USP42 |
Gene summary for USP42 |
| Gene information | Species | Human | Gene symbol | USP42 | Gene ID | 84132 |
| Gene name | ubiquitin specific peptidase 42 | |
| Gene Alias | USP42 | |
| Cytomap | 7p22.1 | |
| Gene Type | protein-coding | GO ID | GO:0000003 | UniProtAcc | Q9H9J4 |
Top |
Malignant transformation analysis |
| Identification of the aberrant gene expression in precancerous and cancerous lesions by comparing the gene expression of stem-like cells in diseased tissues with normal stem cells |
| Entrez ID | Symbol | Replicates | Species | Organ | Tissue | Adj P-value | Log2FC | Malignancy |
| 84132 | USP42 | HCC2_Meng | Human | Liver | HCC | 5.60e-04 | 2.21e-02 | 0.0107 |
| 84132 | USP42 | HCC2 | Human | Liver | HCC | 4.59e-08 | 3.11e+00 | 0.5341 |
| 84132 | USP42 | S014 | Human | Liver | HCC | 3.34e-13 | 5.26e-01 | 0.2254 |
| 84132 | USP42 | S015 | Human | Liver | HCC | 7.92e-08 | 4.44e-01 | 0.2375 |
| 84132 | USP42 | S016 | Human | Liver | HCC | 1.04e-11 | 4.68e-01 | 0.2243 |
| 84132 | USP42 | S027 | Human | Liver | HCC | 9.67e-07 | 5.47e-01 | 0.2446 |
| 84132 | USP42 | S028 | Human | Liver | HCC | 1.50e-15 | 6.21e-01 | 0.2503 |
| 84132 | USP42 | S029 | Human | Liver | HCC | 1.43e-06 | 4.65e-01 | 0.2581 |
| 84132 | USP42 | C04 | Human | Oral cavity | OSCC | 7.45e-05 | 2.28e-01 | 0.2633 |
| 84132 | USP42 | C21 | Human | Oral cavity | OSCC | 1.75e-12 | 4.57e-01 | 0.2678 |
| 84132 | USP42 | C30 | Human | Oral cavity | OSCC | 1.05e-18 | 7.05e-01 | 0.3055 |
| 84132 | USP42 | C38 | Human | Oral cavity | OSCC | 1.84e-06 | 5.00e-01 | 0.172 |
| 84132 | USP42 | C46 | Human | Oral cavity | OSCC | 5.94e-07 | 1.53e-01 | 0.1673 |
| 84132 | USP42 | C57 | Human | Oral cavity | OSCC | 7.63e-05 | 1.09e-01 | 0.1679 |
| 84132 | USP42 | C06 | Human | Oral cavity | OSCC | 4.63e-02 | 3.79e-01 | 0.2699 |
| 84132 | USP42 | C08 | Human | Oral cavity | OSCC | 3.59e-07 | 2.46e-01 | 0.1919 |
| 84132 | USP42 | LP15 | Human | Oral cavity | LP | 2.83e-06 | 5.40e-01 | 0.2174 |
| 84132 | USP42 | EOLP-1 | Human | Oral cavity | EOLP | 3.91e-04 | 2.22e-01 | -0.0202 |
| 84132 | USP42 | SYSMH1 | Human | Oral cavity | OSCC | 9.55e-05 | 1.17e-01 | 0.1127 |
| 84132 | USP42 | SYSMH2 | Human | Oral cavity | OSCC | 1.45e-05 | 2.00e-01 | 0.2326 |
| Page: 1 2 3 4 5 |
| Tissue | Expression Dynamics | Abbreviation |
| Esophagus | 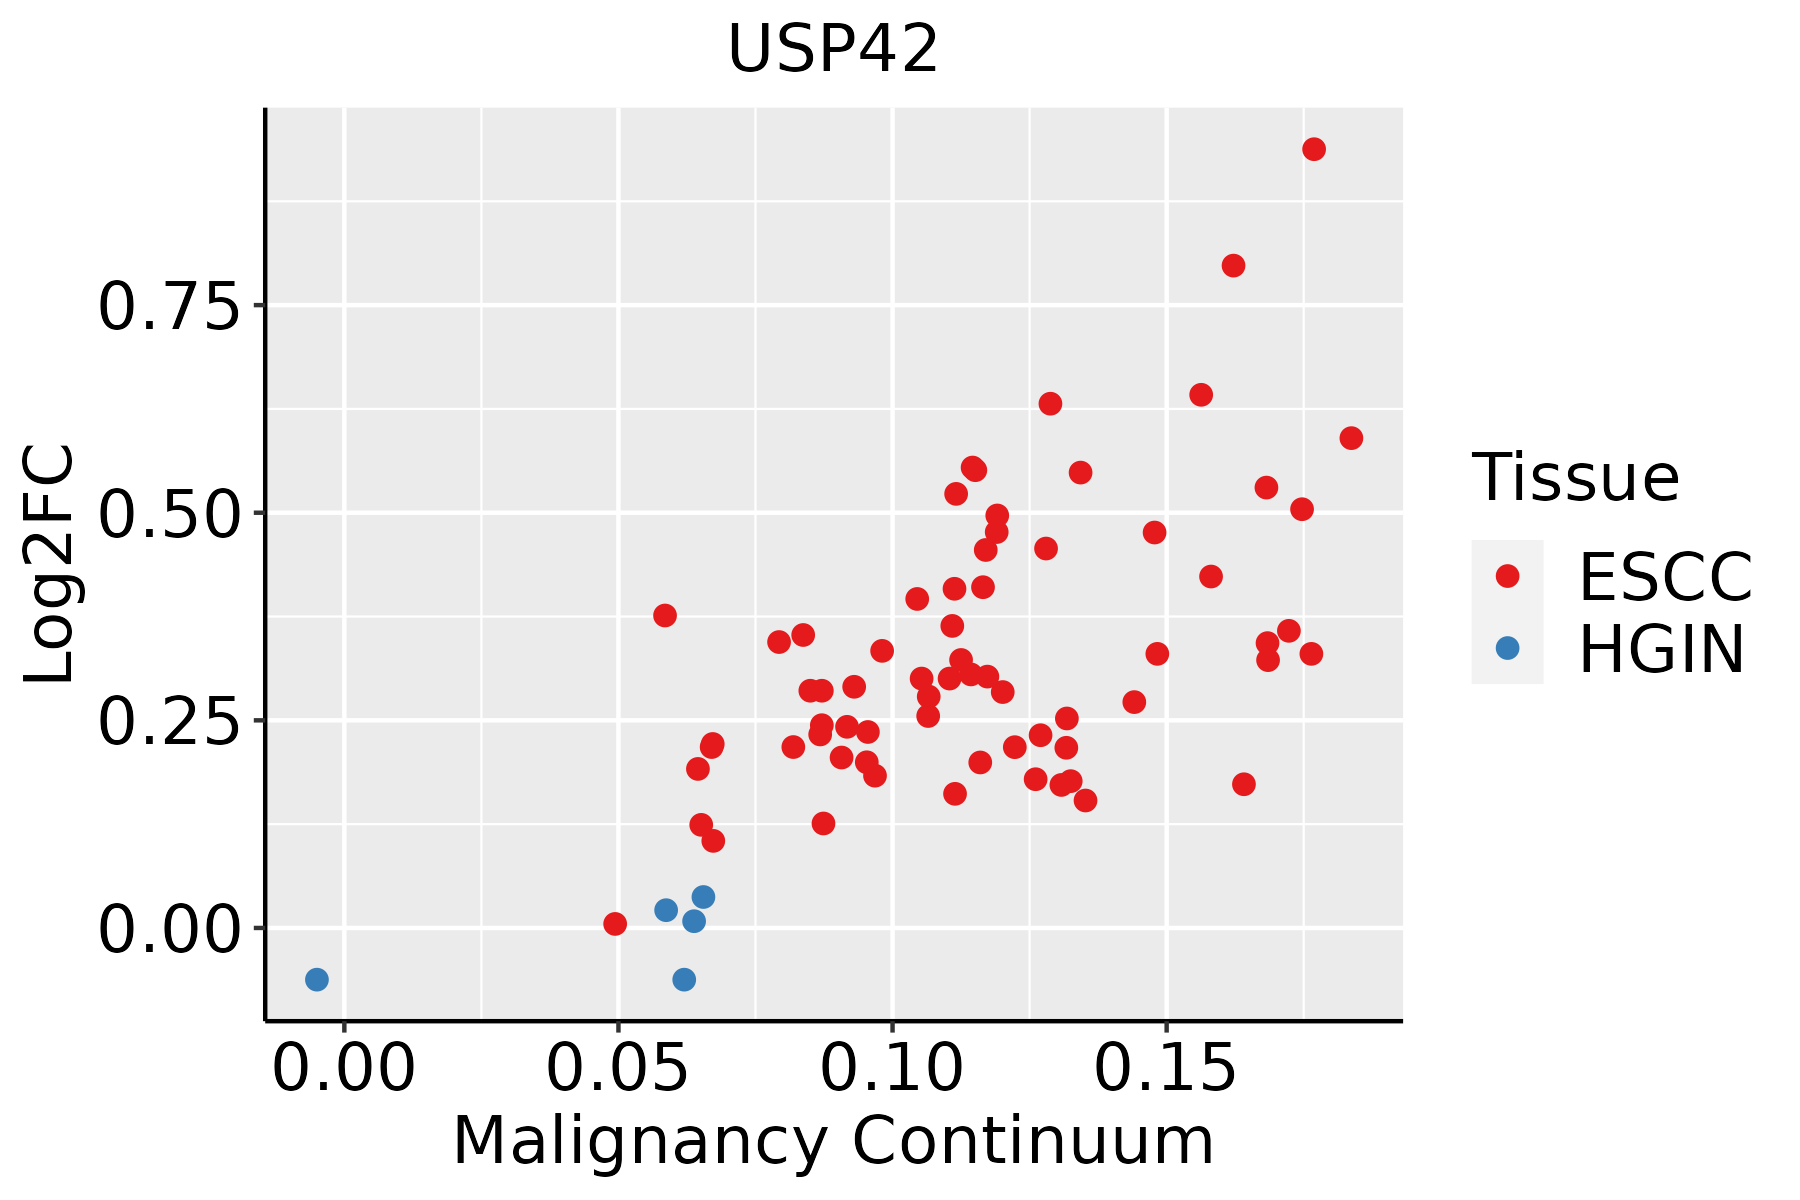 | ESCC: Esophageal squamous cell carcinoma |
| HGIN: High-grade intraepithelial neoplasias | ||
| LGIN: Low-grade intraepithelial neoplasias | ||
| Liver | 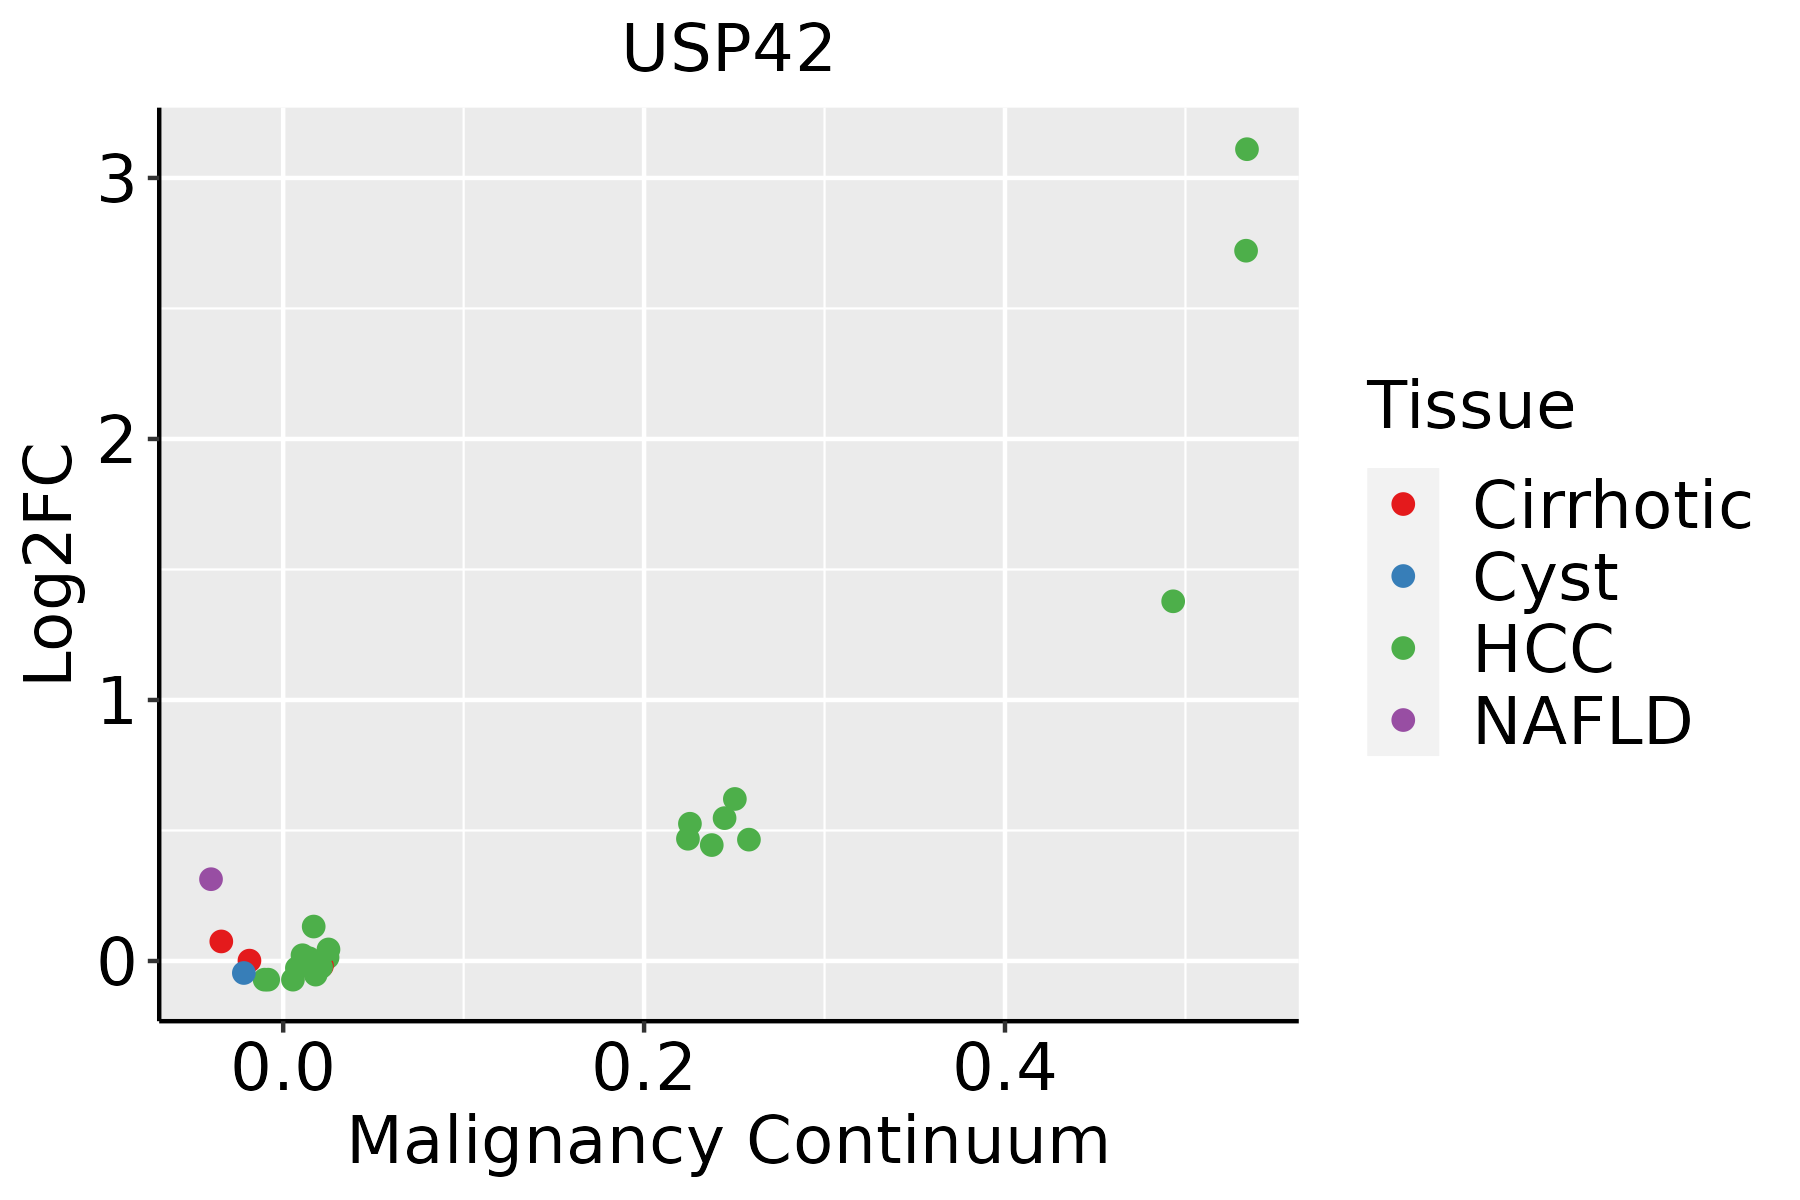 | HCC: Hepatocellular carcinoma |
| NAFLD: Non-alcoholic fatty liver disease | ||
| Oral Cavity | 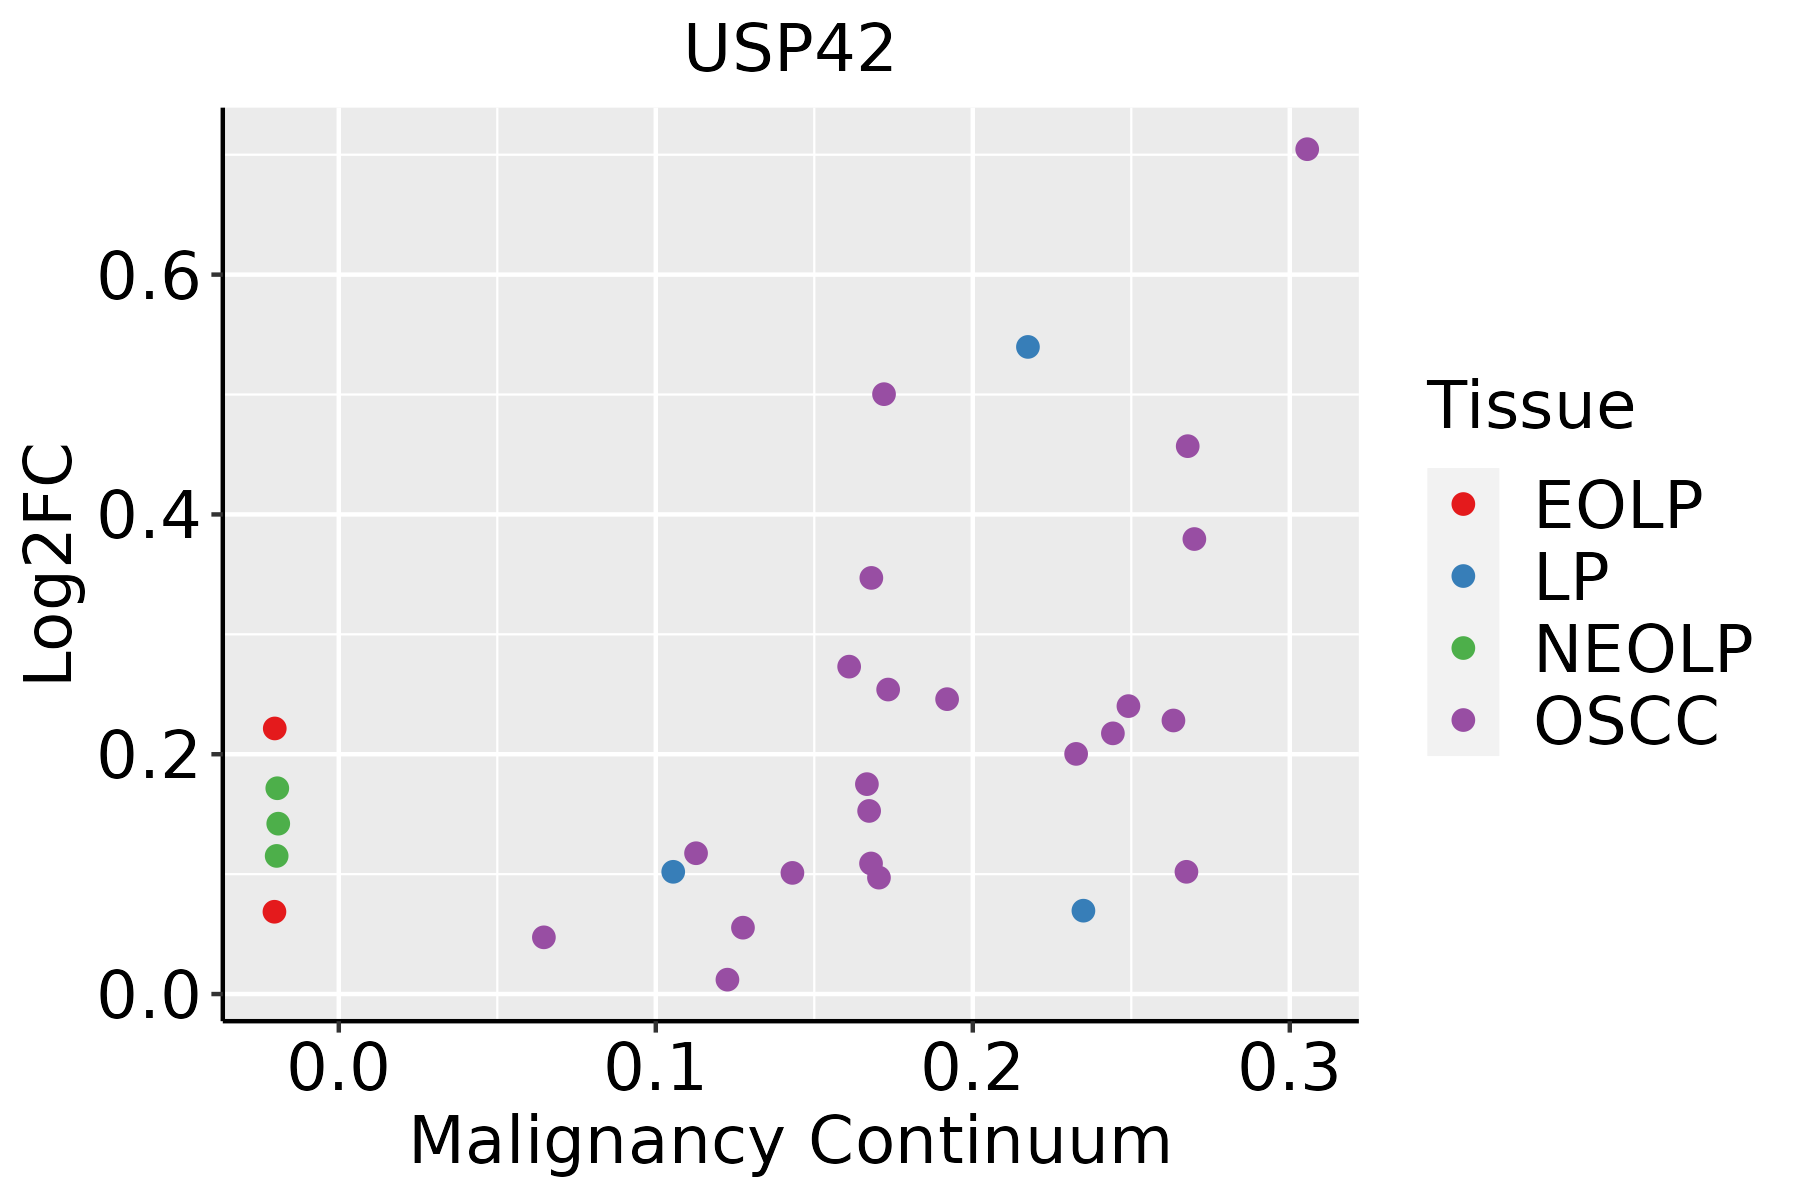 | EOLP: Erosive Oral lichen planus |
| LP: leukoplakia | ||
| NEOLP: Non-erosive oral lichen planus | ||
| OSCC: Oral squamous cell carcinoma | ||
| Thyroid | 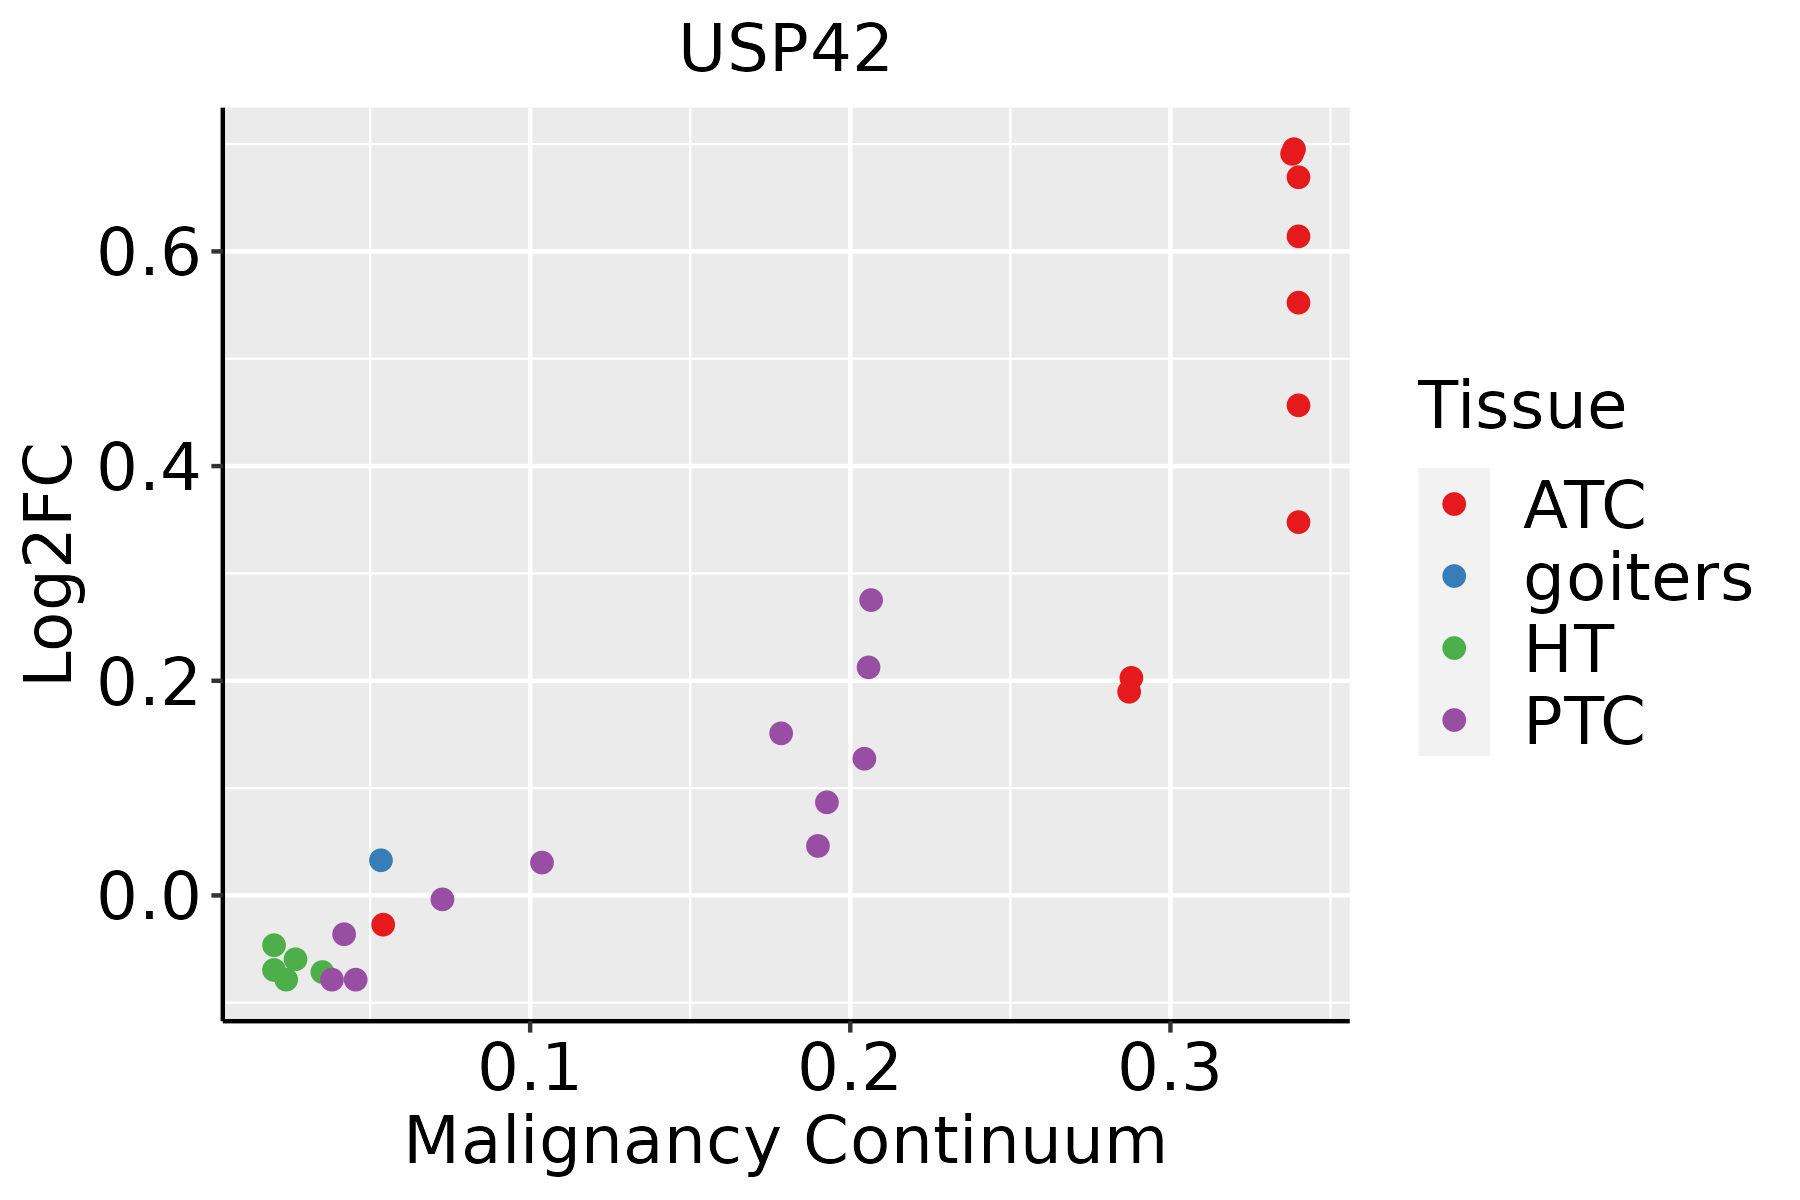 | ATC: Anaplastic thyroid cancer |
| HT: Hashimoto's thyroiditis | ||
| PTC: Papillary thyroid cancer |
| ∗log2FC in expression of this searched gene in stem-like cells from each diseased tissue sample relative to stem-like cells in normal samples in each tissue plotted against the malignancy continuum. Samples are colored based on if they are from different disease stage. |
Top |
Malignant transformation related pathway analysis |
| Find out the enriched GO biological processes and KEGG pathways involved in transition from healthy to precancer to cancer |
| Tissue | Disease Stage | Enriched GO biological Processes |
| Colorectum | AD |  |
| Colorectum | SER |  |
| Colorectum | MSS |  |
| Colorectum | MSI-H |  |
| Colorectum | FAP |  |
| ∗Top 15 enriched GO BP terms are showed in the bar plot of each disease state in each tissue. Each row represents a significant GO biological process which is colored according to the -log10(p.adjust). |
| Page: 1 2 3 4 5 6 7 8 9 |
| GO ID | Tissue | Disease Stage | Description | Gene Ratio | Bg Ratio | pvalue | p.adjust | Count |
| GO:007064612 | Esophagus | ESCC | protein modification by small protein removal | 95/8552 | 157/18723 | 1.25e-04 | 8.56e-04 | 95 |
| GO:00165793 | Esophagus | ESCC | protein deubiquitination | 79/8552 | 139/18723 | 5.23e-03 | 1.97e-02 | 79 |
| GO:00706461 | Liver | HCC | protein modification by small protein removal | 91/7958 | 157/18723 | 6.50e-05 | 5.92e-04 | 91 |
| GO:00165791 | Liver | HCC | protein deubiquitination | 78/7958 | 139/18723 | 8.13e-04 | 4.87e-03 | 78 |
| GO:00706462 | Oral cavity | OSCC | protein modification by small protein removal | 77/7305 | 157/18723 | 6.55e-03 | 2.43e-02 | 77 |
| GO:007064611 | Oral cavity | EOLP | protein modification by small protein removal | 33/2218 | 157/18723 | 7.04e-04 | 5.78e-03 | 33 |
| GO:00165792 | Oral cavity | EOLP | protein deubiquitination | 28/2218 | 139/18723 | 3.29e-03 | 1.90e-02 | 28 |
| GO:00706465 | Thyroid | PTC | protein modification by small protein removal | 71/5968 | 157/18723 | 3.03e-04 | 2.12e-03 | 71 |
| GO:00165794 | Thyroid | PTC | protein deubiquitination | 59/5968 | 139/18723 | 5.50e-03 | 2.50e-02 | 59 |
| GO:007064613 | Thyroid | ATC | protein modification by small protein removal | 71/6293 | 157/18723 | 1.59e-03 | 7.99e-03 | 71 |
| Page: 1 |
| Pathway ID | Tissue | Disease Stage | Description | Gene Ratio | Bg Ratio | pvalue | p.adjust | qvalue | Count |
| Page: 1 |
Top |
Cell-cell communication analysis |
| Identification of potential cell-cell interactions between two cell types and their ligand-receptor pairs for different disease states |
| Ligand | Receptor | LRpair | Pathway | Tissue | Disease Stage |
| Page: 1 |
Top |
Single-cell gene regulatory network inference analysis |
| Find out the significant the regulons (TFs) and the target genes of each regulon across cell types for different disease states |
| TF | Cell Type | Tissue | Disease Stage | Target Gene | RSS | Regulon Activity |
| ∗The dot plots of a searched regulon are shown for all cell subpopulations in each disease state of each tissue based on the regulon specific score inferred using pySCENIC and by calculating the average expression. |
| Page: 1 |
Top |
Somatic mutation of malignant transformation related genes |
| Annotation of somatic variants for genes involved in malignant transformation |
| Hugo Symbol | Variant Class | Variant Classification | dbSNP RS | HGVSc | HGVSp | HGVSp Short | SWISSPROT | BIOTYPE | SIFT | PolyPhen | Tumor Sample Barcode | Tissue | Histology | Sex | Age | Stage | Therapy Types | Drugs | Outcome |
| USP42 | SNV | Missense_Mutation | novel | c.496N>T | p.Ala166Ser | p.A166S | Q9H9J4 | protein_coding | deleterious(0.02) | possibly_damaging(0.776) | TCGA-A2-A25A-01 | Breast | breast invasive carcinoma | Female | <65 | I/II | Unspecific | Cytoxan | SD |
| USP42 | SNV | Missense_Mutation | rs752099114 | c.563G>A | p.Arg188Lys | p.R188K | Q9H9J4 | protein_coding | tolerated(1) | benign(0.01) | TCGA-A8-A095-01 | Breast | breast invasive carcinoma | Female | <65 | I/II | Chemotherapy | 5-fluorouracil | CR |
| USP42 | SNV | Missense_Mutation | novel | c.3943N>T | p.Gly1315Cys | p.G1315C | Q9H9J4 | protein_coding | deleterious_low_confidence(0) | probably_damaging(0.99) | TCGA-A8-A0A2-01 | Breast | breast invasive carcinoma | Female | >=65 | I/II | Hormone Therapy | tamoxiphen | SD |
| USP42 | SNV | Missense_Mutation | c.3790N>G | p.Leu1264Val | p.L1264V | Q9H9J4 | protein_coding | tolerated(0.47) | benign(0.037) | TCGA-AQ-A04J-01 | Breast | breast invasive carcinoma | Female | <65 | I/II | Chemotherapy | cytoxan | SD | |
| USP42 | SNV | Missense_Mutation | rs752099114 | c.563N>A | p.Arg188Lys | p.R188K | Q9H9J4 | protein_coding | tolerated(1) | benign(0.01) | TCGA-BH-A0HO-01 | Breast | breast invasive carcinoma | Female | <65 | I/II | Chemotherapy | cyclophosphamide | SD |
| USP42 | SNV | Missense_Mutation | rs752099114 | c.563G>A | p.Arg188Lys | p.R188K | Q9H9J4 | protein_coding | tolerated(1) | benign(0.01) | TCGA-BH-A0HU-01 | Breast | breast invasive carcinoma | Female | <65 | I/II | Chemotherapy | docetaxel | SD |
| USP42 | SNV | Missense_Mutation | novel | c.2495N>G | p.Ser832Cys | p.S832C | Q9H9J4 | protein_coding | deleterious(0.04) | possibly_damaging(0.639) | TCGA-D8-A73U-01 | Breast | breast invasive carcinoma | Female | >=65 | I/II | Hormone Therapy | tamoxiphen | SD |
| USP42 | SNV | Missense_Mutation | c.302T>G | p.Leu101Arg | p.L101R | Q9H9J4 | protein_coding | deleterious(0) | probably_damaging(0.996) | TCGA-E2-A14Q-01 | Breast | breast invasive carcinoma | Female | <65 | I/II | Hormone Therapy | tamoxiphen | SD | |
| USP42 | SNV | Missense_Mutation | rs866850561 | c.3479N>A | p.Arg1160Gln | p.R1160Q | Q9H9J4 | protein_coding | deleterious(0.02) | possibly_damaging(0.855) | TCGA-E2-A1LB-01 | Breast | breast invasive carcinoma | Female | <65 | I/II | Chemotherapy | cytoxan | SD |
| USP42 | insertion | Nonsense_Mutation | novel | c.1348_1349insCCTCAGGCCAAGTTGAGGGGTA | p.Gly450AlafsTer8 | p.G450Afs*8 | Q9H9J4 | protein_coding | TCGA-AN-A0FN-01 | Breast | breast invasive carcinoma | Female | <65 | I/II | Unknown | Unknown | SD |
| Page: 1 2 3 4 5 6 7 8 9 10 11 |
Top |
Related drugs of malignant transformation related genes |
| Identification of chemicals and drugs interact with genes involved in malignant transfromation |
| (DGIdb 4.0) |
| Entrez ID | Symbol | Category | Interaction Types | Drug Claim Name | Drug Name | PMIDs |
| Page: 1 |

Copyright 2023-Present -The University of Texas Health Science Center at Houston |