| Tissue | Expression Dynamics | Abbreviation |
| Colorectum (GSE201348) |  | FAP: Familial adenomatous polyposis |
| CRC: Colorectal cancer |
| Colorectum (HTA11) | 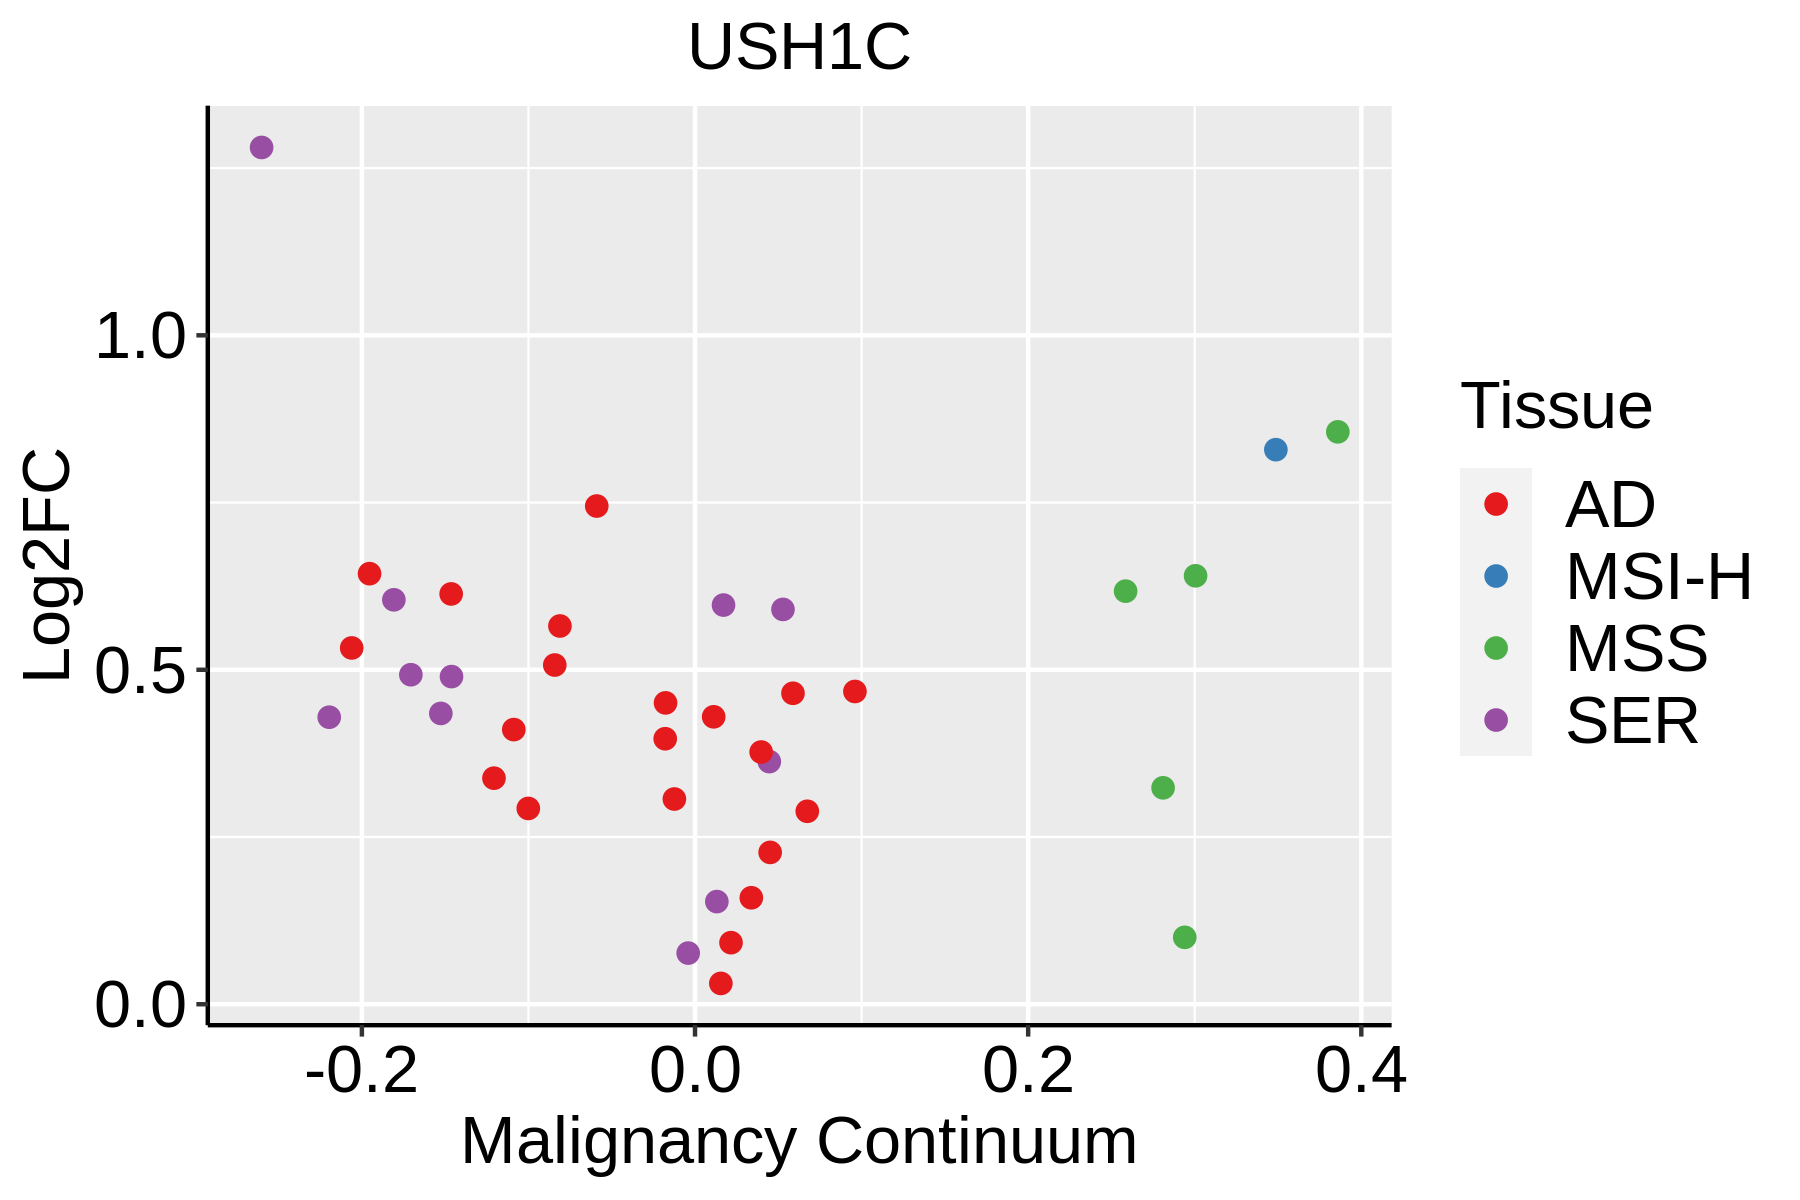 | AD: Adenomas |
| SER: Sessile serrated lesions |
| MSI-H: Microsatellite-high colorectal cancer |
| MSS: Microsatellite stable colorectal cancer |
| GC |  | CAG: Chronic atrophic gastritis |
| CAG with IM: Chronic atrophic gastritis with intestinal metaplasia |
| CSG: Chronic superficial gastritis |
| GC: Gastric cancer |
| SIM: Severe intestinal metaplasia |
| WIM: Wild intestinal metaplasia |
| Liver | 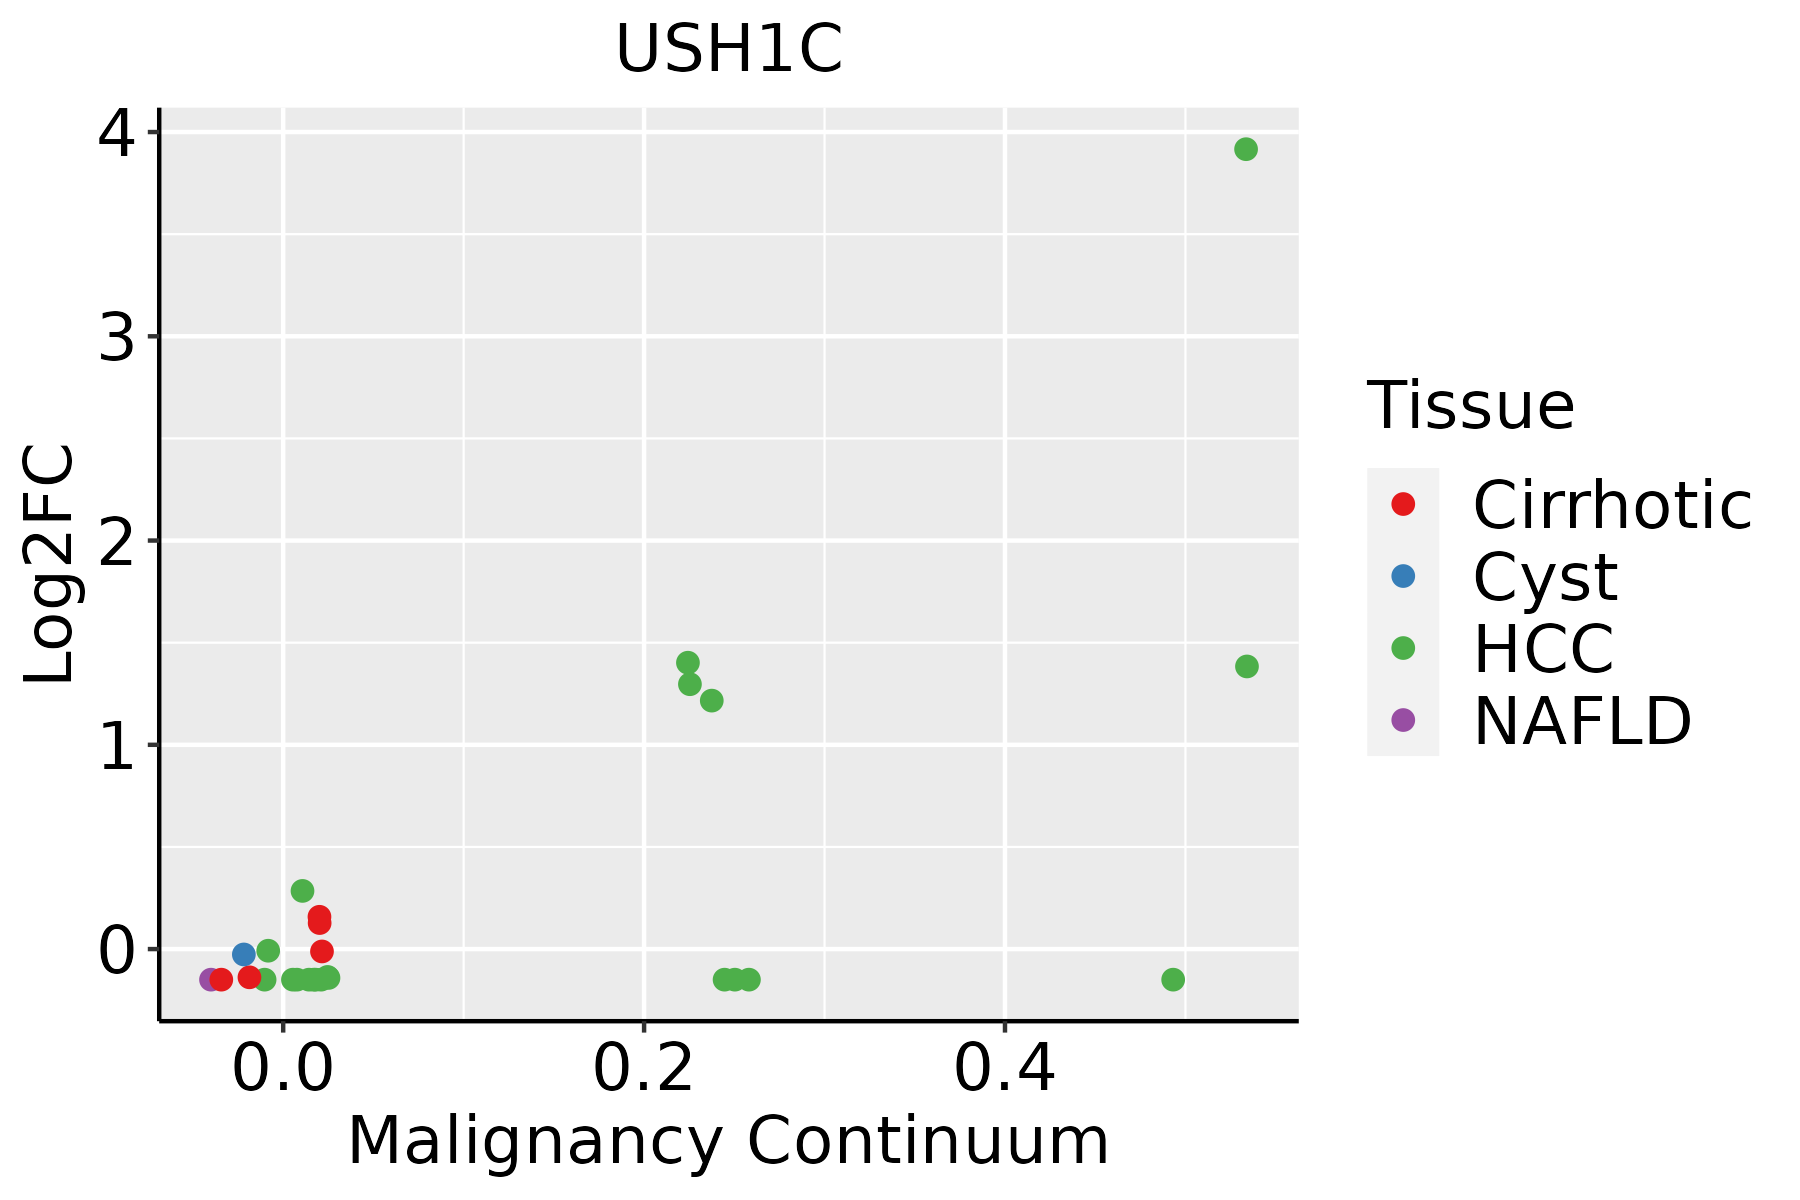 | HCC: Hepatocellular carcinoma |
| NAFLD: Non-alcoholic fatty liver disease |
| GO ID | Tissue | Disease Stage | Description | Gene Ratio | Bg Ratio | pvalue | p.adjust | Count |
| GO:0007015 | Colorectum | AD | actin filament organization | 167/3918 | 442/18723 | 1.65e-16 | 7.94e-14 | 167 |
| GO:0032535 | Colorectum | AD | regulation of cellular component size | 142/3918 | 383/18723 | 1.74e-13 | 3.41e-11 | 142 |
| GO:0061572 | Colorectum | AD | actin filament bundle organization | 60/3918 | 161/18723 | 1.33e-06 | 4.23e-05 | 60 |
| GO:0051017 | Colorectum | AD | actin filament bundle assembly | 58/3918 | 157/18723 | 2.74e-06 | 7.89e-05 | 58 |
| GO:0032530 | Colorectum | AD | regulation of microvillus organization | 10/3918 | 13/18723 | 2.43e-05 | 4.69e-04 | 10 |
| GO:0032528 | Colorectum | AD | microvillus organization | 14/3918 | 24/18723 | 6.90e-05 | 1.11e-03 | 14 |
| GO:0060249 | Colorectum | AD | anatomical structure homeostasis | 94/3918 | 314/18723 | 9.37e-05 | 1.42e-03 | 94 |
| GO:0001894 | Colorectum | AD | tissue homeostasis | 81/3918 | 268/18723 | 1.96e-04 | 2.62e-03 | 81 |
| GO:0035315 | Colorectum | AD | hair cell differentiation | 21/3918 | 47/18723 | 2.14e-04 | 2.82e-03 | 21 |
| GO:0042491 | Colorectum | AD | inner ear auditory receptor cell differentiation | 17/3918 | 38/18723 | 8.26e-04 | 8.13e-03 | 17 |
| GO:0042490 | Colorectum | AD | mechanoreceptor differentiation | 24/3918 | 67/18723 | 3.48e-03 | 2.52e-02 | 24 |
| GO:0048568 | Colorectum | AD | embryonic organ development | 112/3918 | 427/18723 | 4.60e-03 | 3.14e-02 | 112 |
| GO:0009913 | Colorectum | AD | epidermal cell differentiation | 58/3918 | 202/18723 | 5.16e-03 | 3.42e-02 | 58 |
| GO:0008544 | Colorectum | AD | epidermis development | 87/3918 | 324/18723 | 5.99e-03 | 3.76e-02 | 87 |
| GO:0060119 | Colorectum | AD | inner ear receptor cell development | 17/3918 | 45/18723 | 7.10e-03 | 4.33e-02 | 17 |
| GO:00070151 | Colorectum | SER | actin filament organization | 134/2897 | 442/18723 | 1.39e-15 | 5.70e-13 | 134 |
| GO:00325351 | Colorectum | SER | regulation of cellular component size | 115/2897 | 383/18723 | 3.04e-13 | 1.10e-10 | 115 |
| GO:00325301 | Colorectum | SER | regulation of microvillus organization | 10/2897 | 13/18723 | 1.41e-06 | 6.46e-05 | 10 |
| GO:00325281 | Colorectum | SER | microvillus organization | 14/2897 | 24/18723 | 1.83e-06 | 7.80e-05 | 14 |
| GO:00615721 | Colorectum | SER | actin filament bundle organization | 48/2897 | 161/18723 | 2.97e-06 | 1.19e-04 | 48 |
| Hugo Symbol | Variant Class | Variant Classification | dbSNP RS | HGVSc | HGVSp | HGVSp Short | SWISSPROT | BIOTYPE | SIFT | PolyPhen | Tumor Sample Barcode | Tissue | Histology | Sex | Age | Stage | Therapy Types | Drugs | Outcome |
| USH1C | SNV | Missense_Mutation | | c.502N>A | p.Gly168Ser | p.G168S | Q9Y6N9 | protein_coding | deleterious(0) | probably_damaging(0.971) | TCGA-A1-A0SH-01 | Breast | breast invasive carcinoma | Female | <65 | I/II | Chemotherapy | tc | SD |
| USH1C | SNV | Missense_Mutation | novel | c.1149N>C | p.Gln383His | p.Q383H | Q9Y6N9 | protein_coding | tolerated_low_confidence(0.13) | possibly_damaging(0.679) | TCGA-A8-A08H-01 | Breast | breast invasive carcinoma | Female | >=65 | I/II | Unknown | Unknown | SD |
| USH1C | SNV | Missense_Mutation | | c.370G>A | p.Asp124Asn | p.D124N | Q9Y6N9 | protein_coding | deleterious(0.02) | possibly_damaging(0.813) | TCGA-AC-A23H-01 | Breast | breast invasive carcinoma | Female | >=65 | I/II | Unknown | Unknown | PD |
| USH1C | SNV | Missense_Mutation | rs201644053 | c.2500N>A | p.Asp834Asn | p.D834N | Q9Y6N9 | protein_coding | deleterious_low_confidence(0) | possibly_damaging(0.514) | TCGA-AN-A046-01 | Breast | breast invasive carcinoma | Female | >=65 | I/II | Unknown | Unknown | SD |
| USH1C | SNV | Missense_Mutation | novel | c.1455N>T | p.Lys485Asn | p.K485N | Q9Y6N9 | protein_coding | deleterious_low_confidence(0) | probably_damaging(0.994) | TCGA-AN-A046-01 | Breast | breast invasive carcinoma | Female | >=65 | I/II | Unknown | Unknown | SD |
| USH1C | SNV | Missense_Mutation | rs774988386 | c.1754N>T | p.Ser585Phe | p.S585F | Q9Y6N9 | protein_coding | deleterious_low_confidence(0.01) | benign(0.084) | TCGA-AR-A0TX-01 | Breast | breast invasive carcinoma | Female | <65 | I/II | Unknown | Unknown | SD |
| USH1C | SNV | Missense_Mutation | | c.1954N>T | p.His652Tyr | p.H652Y | Q9Y6N9 | protein_coding | tolerated_low_confidence(0.38) | benign(0) | TCGA-BH-A0HF-01 | Breast | breast invasive carcinoma | Female | >=65 | I/II | Hormone Therapy | arimidex | SD |
| USH1C | SNV | Missense_Mutation | rs397517883 | c.587G>A | p.Arg196Gln | p.R196Q | Q9Y6N9 | protein_coding | tolerated(0.11) | benign(0.32) | TCGA-E2-A56Z-01 | Breast | breast invasive carcinoma | Female | >=65 | I/II | Hormone Therapy | arimidex | SD |
| USH1C | SNV | Missense_Mutation | | c.2281N>C | p.Glu761Gln | p.E761Q | Q9Y6N9 | protein_coding | deleterious_low_confidence(0.01) | probably_damaging(0.991) | TCGA-EW-A1J5-01 | Breast | breast invasive carcinoma | Female | <65 | I/II | Chemotherapy | adriamycin | SD |
| USH1C | SNV | Missense_Mutation | | c.2498N>G | p.Ile833Ser | p.I833S | Q9Y6N9 | protein_coding | deleterious_low_confidence(0) | probably_damaging(0.996) | TCGA-EW-A1P5-01 | Breast | breast invasive carcinoma | Female | >=65 | I/II | Hormone Therapy | anastrozole | SD |


