
|
|||||
|
 | |
| |
| |
| |
| |
| |
|
Gene: UNC50 |
Gene summary for UNC50 |
| Gene information | Species | Human | Gene symbol | UNC50 | Gene ID | 25972 |
| Gene name | unc-50 inner nuclear membrane RNA binding protein | |
| Gene Alias | GMH1 | |
| Cytomap | 2q11.2 | |
| Gene Type | protein-coding | GO ID | GO:0006810 | UniProtAcc | J3KQ47 |
Top |
Malignant transformation analysis |
| Identification of the aberrant gene expression in precancerous and cancerous lesions by comparing the gene expression of stem-like cells in diseased tissues with normal stem cells |
| Entrez ID | Symbol | Replicates | Species | Organ | Tissue | Adj P-value | Log2FC | Malignancy |
| 25972 | UNC50 | P127T-E | Human | Esophagus | ESCC | 7.27e-15 | 2.94e-01 | 0.0826 |
| 25972 | UNC50 | P128T-E | Human | Esophagus | ESCC | 4.19e-18 | 6.69e-01 | 0.1241 |
| 25972 | UNC50 | P130T-E | Human | Esophagus | ESCC | 4.26e-49 | 1.01e+00 | 0.1676 |
| 25972 | UNC50 | S43 | Human | Liver | Cirrhotic | 9.43e-05 | -2.29e-01 | -0.0187 |
| 25972 | UNC50 | HCC1_Meng | Human | Liver | HCC | 2.75e-97 | 3.24e-01 | 0.0246 |
| 25972 | UNC50 | HCC2_Meng | Human | Liver | HCC | 5.46e-35 | 8.63e-02 | 0.0107 |
| 25972 | UNC50 | cirrhotic1 | Human | Liver | Cirrhotic | 8.52e-12 | 1.20e-01 | 0.0202 |
| 25972 | UNC50 | cirrhotic2 | Human | Liver | Cirrhotic | 1.53e-13 | 1.24e-01 | 0.0201 |
| 25972 | UNC50 | cirrhotic3 | Human | Liver | Cirrhotic | 1.99e-04 | 3.05e-02 | 0.0215 |
| 25972 | UNC50 | HCC1 | Human | Liver | HCC | 6.81e-03 | 2.32e+00 | 0.5336 |
| 25972 | UNC50 | HCC2 | Human | Liver | HCC | 2.72e-03 | 2.31e+00 | 0.5341 |
| 25972 | UNC50 | Pt13.b | Human | Liver | HCC | 8.48e-11 | 8.42e-02 | 0.0251 |
| 25972 | UNC50 | S014 | Human | Liver | HCC | 2.18e-11 | 6.23e-01 | 0.2254 |
| 25972 | UNC50 | S015 | Human | Liver | HCC | 1.17e-13 | 7.59e-01 | 0.2375 |
| 25972 | UNC50 | S016 | Human | Liver | HCC | 1.26e-15 | 7.88e-01 | 0.2243 |
| 25972 | UNC50 | S027 | Human | Liver | HCC | 1.12e-02 | 5.70e-01 | 0.2446 |
| 25972 | UNC50 | S028 | Human | Liver | HCC | 3.92e-09 | 7.19e-01 | 0.2503 |
| 25972 | UNC50 | S029 | Human | Liver | HCC | 2.59e-15 | 1.02e+00 | 0.2581 |
| 25972 | UNC50 | C04 | Human | Oral cavity | OSCC | 6.94e-08 | 7.57e-01 | 0.2633 |
| 25972 | UNC50 | C21 | Human | Oral cavity | OSCC | 4.71e-54 | 1.52e+00 | 0.2678 |
| Page: 1 2 3 4 5 6 |
| Tissue | Expression Dynamics | Abbreviation |
| Esophagus | 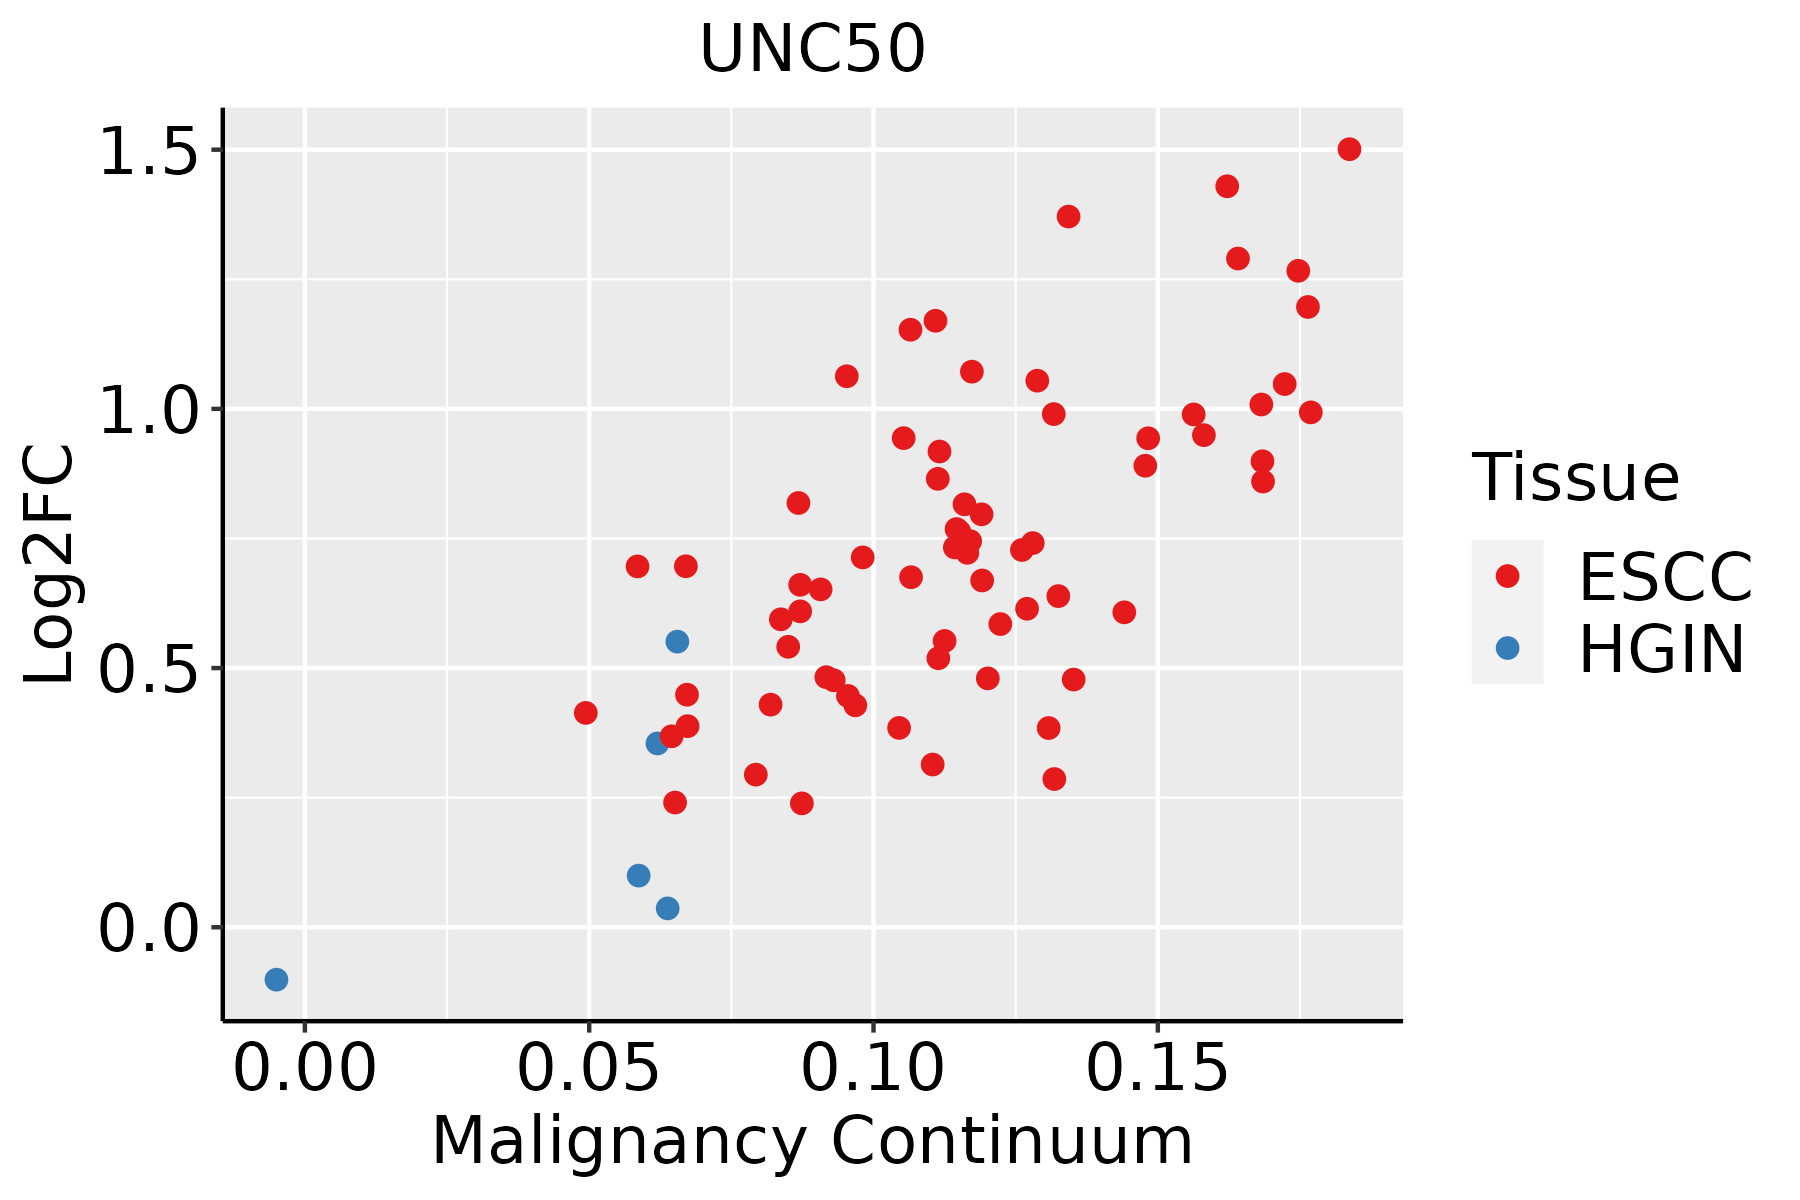 | ESCC: Esophageal squamous cell carcinoma |
| HGIN: High-grade intraepithelial neoplasias | ||
| LGIN: Low-grade intraepithelial neoplasias | ||
| Liver |  | HCC: Hepatocellular carcinoma |
| NAFLD: Non-alcoholic fatty liver disease | ||
| Oral Cavity | 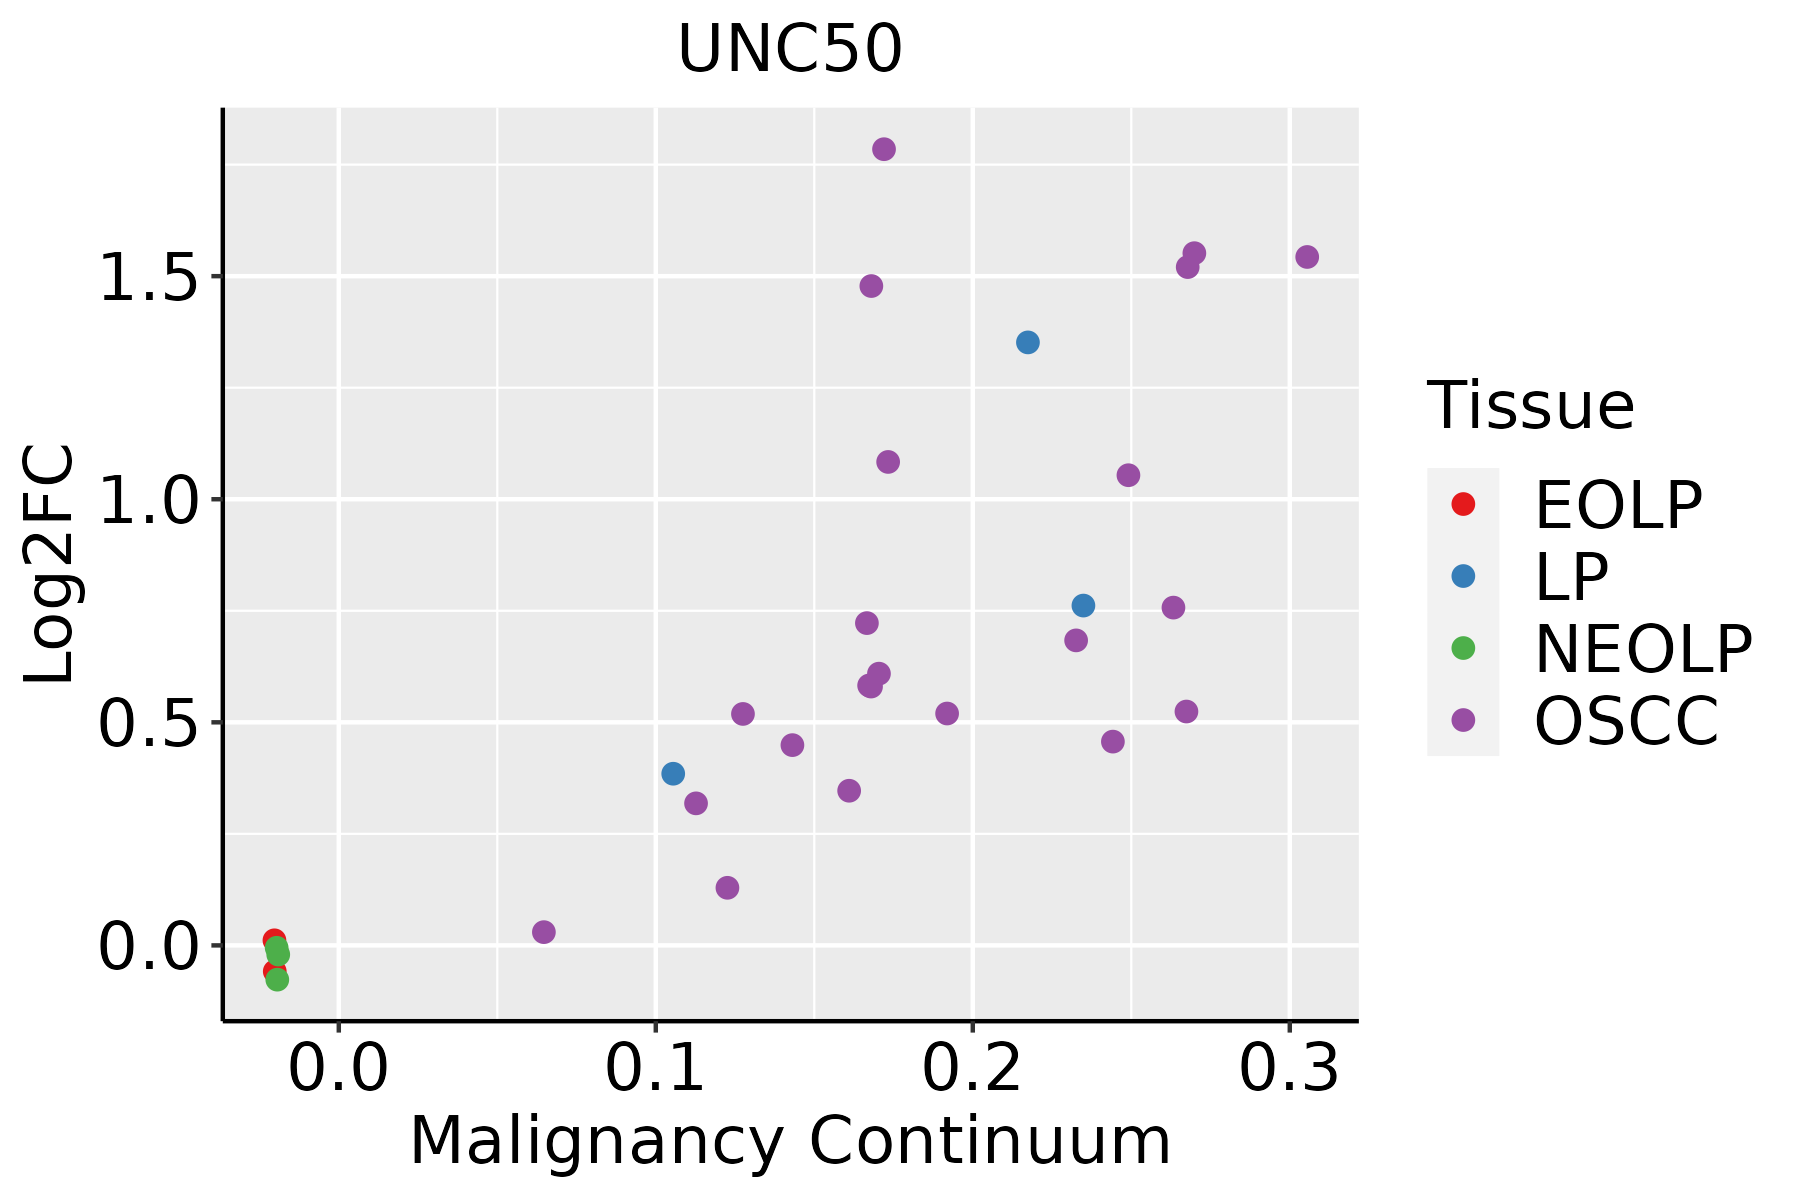 | EOLP: Erosive Oral lichen planus |
| LP: leukoplakia | ||
| NEOLP: Non-erosive oral lichen planus | ||
| OSCC: Oral squamous cell carcinoma | ||
| Skin |  | AK: Actinic keratosis |
| cSCC: Cutaneous squamous cell carcinoma | ||
| SCCIS:squamous cell carcinoma in situ | ||
| Thyroid | 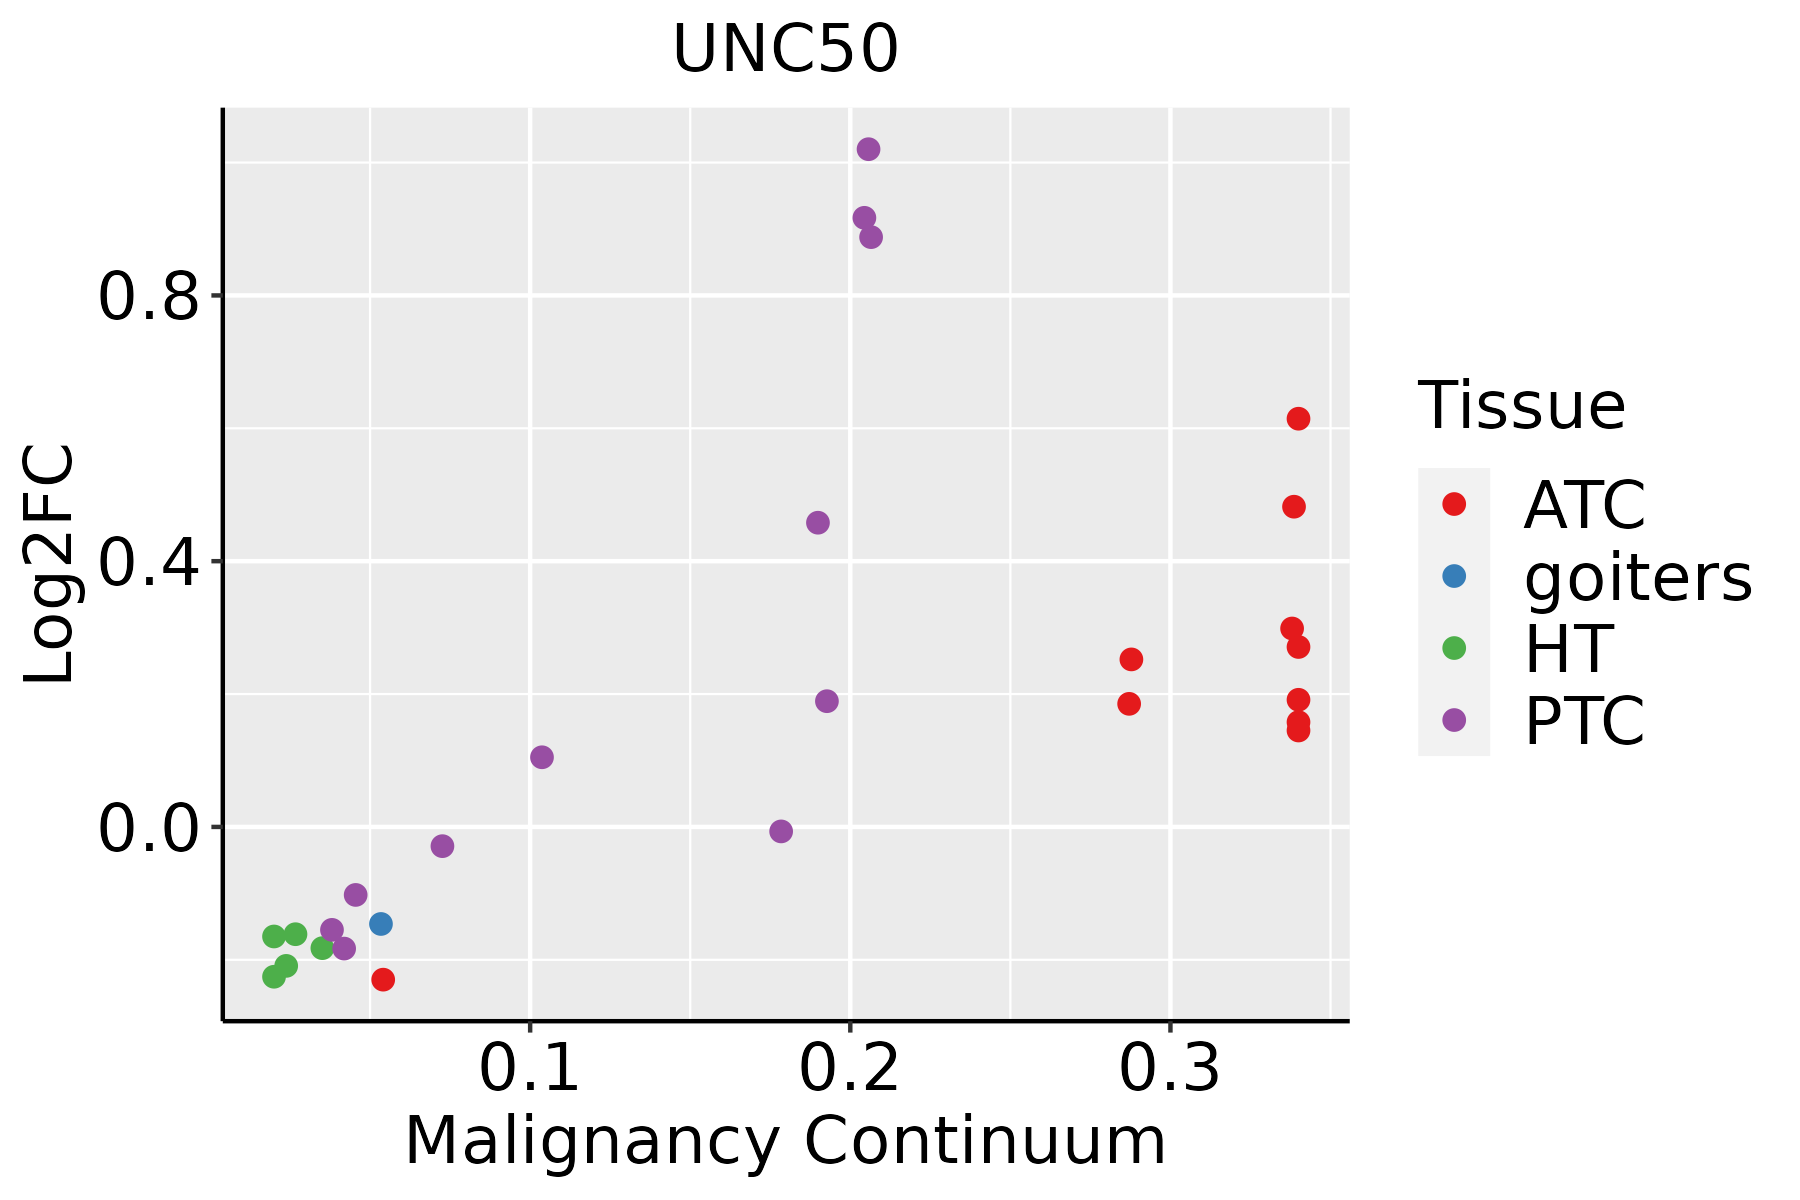 | ATC: Anaplastic thyroid cancer |
| HT: Hashimoto's thyroiditis | ||
| PTC: Papillary thyroid cancer |
| ∗log2FC in expression of this searched gene in stem-like cells from each diseased tissue sample relative to stem-like cells in normal samples in each tissue plotted against the malignancy continuum. Samples are colored based on if they are from different disease stage. |
Top |
Malignant transformation related pathway analysis |
| Find out the enriched GO biological processes and KEGG pathways involved in transition from healthy to precancer to cancer |
| Tissue | Disease Stage | Enriched GO biological Processes |
| Colorectum | AD |  |
| Colorectum | SER |  |
| Colorectum | MSS |  |
| Colorectum | MSI-H |  |
| Colorectum | FAP |  |
| ∗Top 15 enriched GO BP terms are showed in the bar plot of each disease state in each tissue. Each row represents a significant GO biological process which is colored according to the -log10(p.adjust). |
| Page: 1 2 3 4 5 6 7 8 9 |
| GO ID | Tissue | Disease Stage | Description | Gene Ratio | Bg Ratio | pvalue | p.adjust | Count |
| Page: 1 |
| Pathway ID | Tissue | Disease Stage | Description | Gene Ratio | Bg Ratio | pvalue | p.adjust | qvalue | Count |
| Page: 1 |
Top |
Cell-cell communication analysis |
| Identification of potential cell-cell interactions between two cell types and their ligand-receptor pairs for different disease states |
| Ligand | Receptor | LRpair | Pathway | Tissue | Disease Stage |
| Page: 1 |
Top |
Single-cell gene regulatory network inference analysis |
| Find out the significant the regulons (TFs) and the target genes of each regulon across cell types for different disease states |
| TF | Cell Type | Tissue | Disease Stage | Target Gene | RSS | Regulon Activity |
| ∗The dot plots of a searched regulon are shown for all cell subpopulations in each disease state of each tissue based on the regulon specific score inferred using pySCENIC and by calculating the average expression. |
| Page: 1 |
Top |
Somatic mutation of malignant transformation related genes |
| Annotation of somatic variants for genes involved in malignant transformation |
| Hugo Symbol | Variant Class | Variant Classification | dbSNP RS | HGVSc | HGVSp | HGVSp Short | SWISSPROT | BIOTYPE | SIFT | PolyPhen | Tumor Sample Barcode | Tissue | Histology | Sex | Age | Stage | Therapy Types | Drugs | Outcome |
| UNC50 | SNV | Missense_Mutation | novel | c.456N>A | p.Phe152Leu | p.F152L | protein_coding | tolerated(0.31) | benign(0.018) | TCGA-AN-A046-01 | Breast | breast invasive carcinoma | Female | >=65 | I/II | Unknown | Unknown | SD | |
| UNC50 | SNV | Missense_Mutation | c.403N>T | p.Val135Leu | p.V135L | protein_coding | tolerated(0.12) | benign(0.175) | TCGA-D8-A1XK-01 | Breast | breast invasive carcinoma | Female | <65 | I/II | Chemotherapy | doxorubicine+cyclophosphamide | SD | ||
| UNC50 | deletion | Frame_Shift_Del | rs752307344 | c.578delN | p.Phe195SerfsTer7 | p.F195Sfs*7 | protein_coding | TCGA-A8-A09Z-01 | Breast | breast invasive carcinoma | Female | >=65 | I/II | Unknown | Unknown | SD | |||
| UNC50 | insertion | In_Frame_Ins | novel | c.318_319insGTCGGTAGCCAAATGTTTCTTCAGAATACGTGTAAA | p.Ser106_Ile107insValGlySerGlnMetPheLeuGlnAsnThrCysLys | p.S106_I107insVGSQMFLQNTCK | protein_coding | TCGA-AO-A0JB-01 | Breast | breast invasive carcinoma | Female | <65 | III/IV | Chemotherapy | cyclophosphamide | SD | |||
| UNC50 | SNV | Missense_Mutation | novel | c.25A>G | p.Arg9Gly | p.R9G | protein_coding | tolerated_low_confidence(0.12) | benign(0) | TCGA-AA-3710-01 | Colorectum | colon adenocarcinoma | Female | >=65 | I/II | Unknown | Unknown | SD | |
| UNC50 | SNV | Missense_Mutation | c.175N>T | p.Arg59Trp | p.R59W | protein_coding | deleterious(0) | possibly_damaging(0.888) | TCGA-A5-A0G2-01 | Endometrium | uterine corpus endometrioid carcinoma | Female | <65 | III/IV | Unknown | Unknown | SD | ||
| UNC50 | SNV | Missense_Mutation | c.599N>G | p.Ile200Ser | p.I200S | protein_coding | deleterious(0) | benign(0.086) | TCGA-A5-A0GP-01 | Endometrium | uterine corpus endometrioid carcinoma | Female | <65 | I/II | Unknown | Unknown | SD | ||
| UNC50 | SNV | Missense_Mutation | novel | c.443N>A | p.Thr148Asn | p.T148N | protein_coding | deleterious(0.02) | probably_damaging(0.92) | TCGA-AJ-A3EL-01 | Endometrium | uterine corpus endometrioid carcinoma | Female | <65 | I/II | Unknown | Unknown | SD | |
| UNC50 | SNV | Missense_Mutation | c.520N>G | p.Phe174Val | p.F174V | protein_coding | deleterious(0) | probably_damaging(0.969) | TCGA-AP-A056-01 | Endometrium | uterine corpus endometrioid carcinoma | Female | <65 | I/II | Unknown | Unknown | SD | ||
| UNC50 | SNV | Missense_Mutation | novel | c.87N>T | p.Gln29His | p.Q29H | protein_coding | tolerated(0.18) | benign(0.001) | TCGA-BG-A221-01 | Endometrium | uterine corpus endometrioid carcinoma | Female | >=65 | I/II | Unknown | Unknown | SD |
| Page: 1 2 3 |
Top |
Related drugs of malignant transformation related genes |
| Identification of chemicals and drugs interact with genes involved in malignant transfromation |
| (DGIdb 4.0) |
| Entrez ID | Symbol | Category | Interaction Types | Drug Claim Name | Drug Name | PMIDs |
| Page: 1 |

Copyright 2023-Present -The University of Texas Health Science Center at Houston |