
|
|||||
|
 | |
| |
| |
| |
| |
| |
|
Gene: UMAD1 |
Gene summary for UMAD1 |
| Gene information | Species | Human | Gene symbol | UMAD1 | Gene ID | 729852 |
| Gene name | UBAP1-MVB12-associated (UMA) domain containing 1 | |
| Gene Alias | RPA3-AS1 | |
| Cytomap | 7p21.3 | |
| Gene Type | protein-coding | GO ID | GO:0003674 | UniProtAcc | A4D104 |
Top |
Malignant transformation analysis |
| Identification of the aberrant gene expression in precancerous and cancerous lesions by comparing the gene expression of stem-like cells in diseased tissues with normal stem cells |
| Entrez ID | Symbol | Replicates | Species | Organ | Tissue | Adj P-value | Log2FC | Malignancy |
| 729852 | UMAD1 | LZE5T | Human | Esophagus | ESCC | 6.73e-03 | 1.95e-01 | 0.0514 |
| 729852 | UMAD1 | LZE7T | Human | Esophagus | ESCC | 1.62e-05 | 2.45e-01 | 0.0667 |
| 729852 | UMAD1 | LZE20T | Human | Esophagus | ESCC | 5.54e-04 | 1.30e-01 | 0.0662 |
| 729852 | UMAD1 | LZE22T | Human | Esophagus | ESCC | 4.16e-05 | 2.52e-01 | 0.068 |
| 729852 | UMAD1 | LZE24T | Human | Esophagus | ESCC | 4.77e-16 | 3.94e-01 | 0.0596 |
| 729852 | UMAD1 | LZE6T | Human | Esophagus | ESCC | 3.99e-05 | 2.55e-01 | 0.0845 |
| 729852 | UMAD1 | P1T-E | Human | Esophagus | ESCC | 2.69e-02 | 1.85e-01 | 0.0875 |
| 729852 | UMAD1 | P2T-E | Human | Esophagus | ESCC | 6.26e-14 | 2.04e-01 | 0.1177 |
| 729852 | UMAD1 | P4T-E | Human | Esophagus | ESCC | 2.21e-12 | 2.04e-01 | 0.1323 |
| 729852 | UMAD1 | P5T-E | Human | Esophagus | ESCC | 1.92e-13 | 1.41e-01 | 0.1327 |
| 729852 | UMAD1 | P8T-E | Human | Esophagus | ESCC | 3.14e-15 | 2.59e-01 | 0.0889 |
| 729852 | UMAD1 | P9T-E | Human | Esophagus | ESCC | 4.23e-09 | 1.13e-01 | 0.1131 |
| 729852 | UMAD1 | P10T-E | Human | Esophagus | ESCC | 4.53e-16 | 1.75e-01 | 0.116 |
| 729852 | UMAD1 | P11T-E | Human | Esophagus | ESCC | 1.81e-11 | 4.82e-01 | 0.1426 |
| 729852 | UMAD1 | P12T-E | Human | Esophagus | ESCC | 3.19e-17 | 2.17e-01 | 0.1122 |
| 729852 | UMAD1 | P15T-E | Human | Esophagus | ESCC | 1.63e-12 | 2.44e-01 | 0.1149 |
| 729852 | UMAD1 | P16T-E | Human | Esophagus | ESCC | 4.30e-19 | 2.46e-01 | 0.1153 |
| 729852 | UMAD1 | P17T-E | Human | Esophagus | ESCC | 4.19e-04 | 2.88e-01 | 0.1278 |
| 729852 | UMAD1 | P19T-E | Human | Esophagus | ESCC | 2.51e-06 | 3.49e-01 | 0.1662 |
| 729852 | UMAD1 | P20T-E | Human | Esophagus | ESCC | 1.48e-15 | 3.66e-01 | 0.1124 |
| Page: 1 2 3 4 5 6 7 8 |
| Tissue | Expression Dynamics | Abbreviation |
| Colorectum (GSE201348) |  | FAP: Familial adenomatous polyposis |
| CRC: Colorectal cancer | ||
| Colorectum (HTA11) |  | AD: Adenomas |
| SER: Sessile serrated lesions | ||
| MSI-H: Microsatellite-high colorectal cancer | ||
| MSS: Microsatellite stable colorectal cancer | ||
| Esophagus | 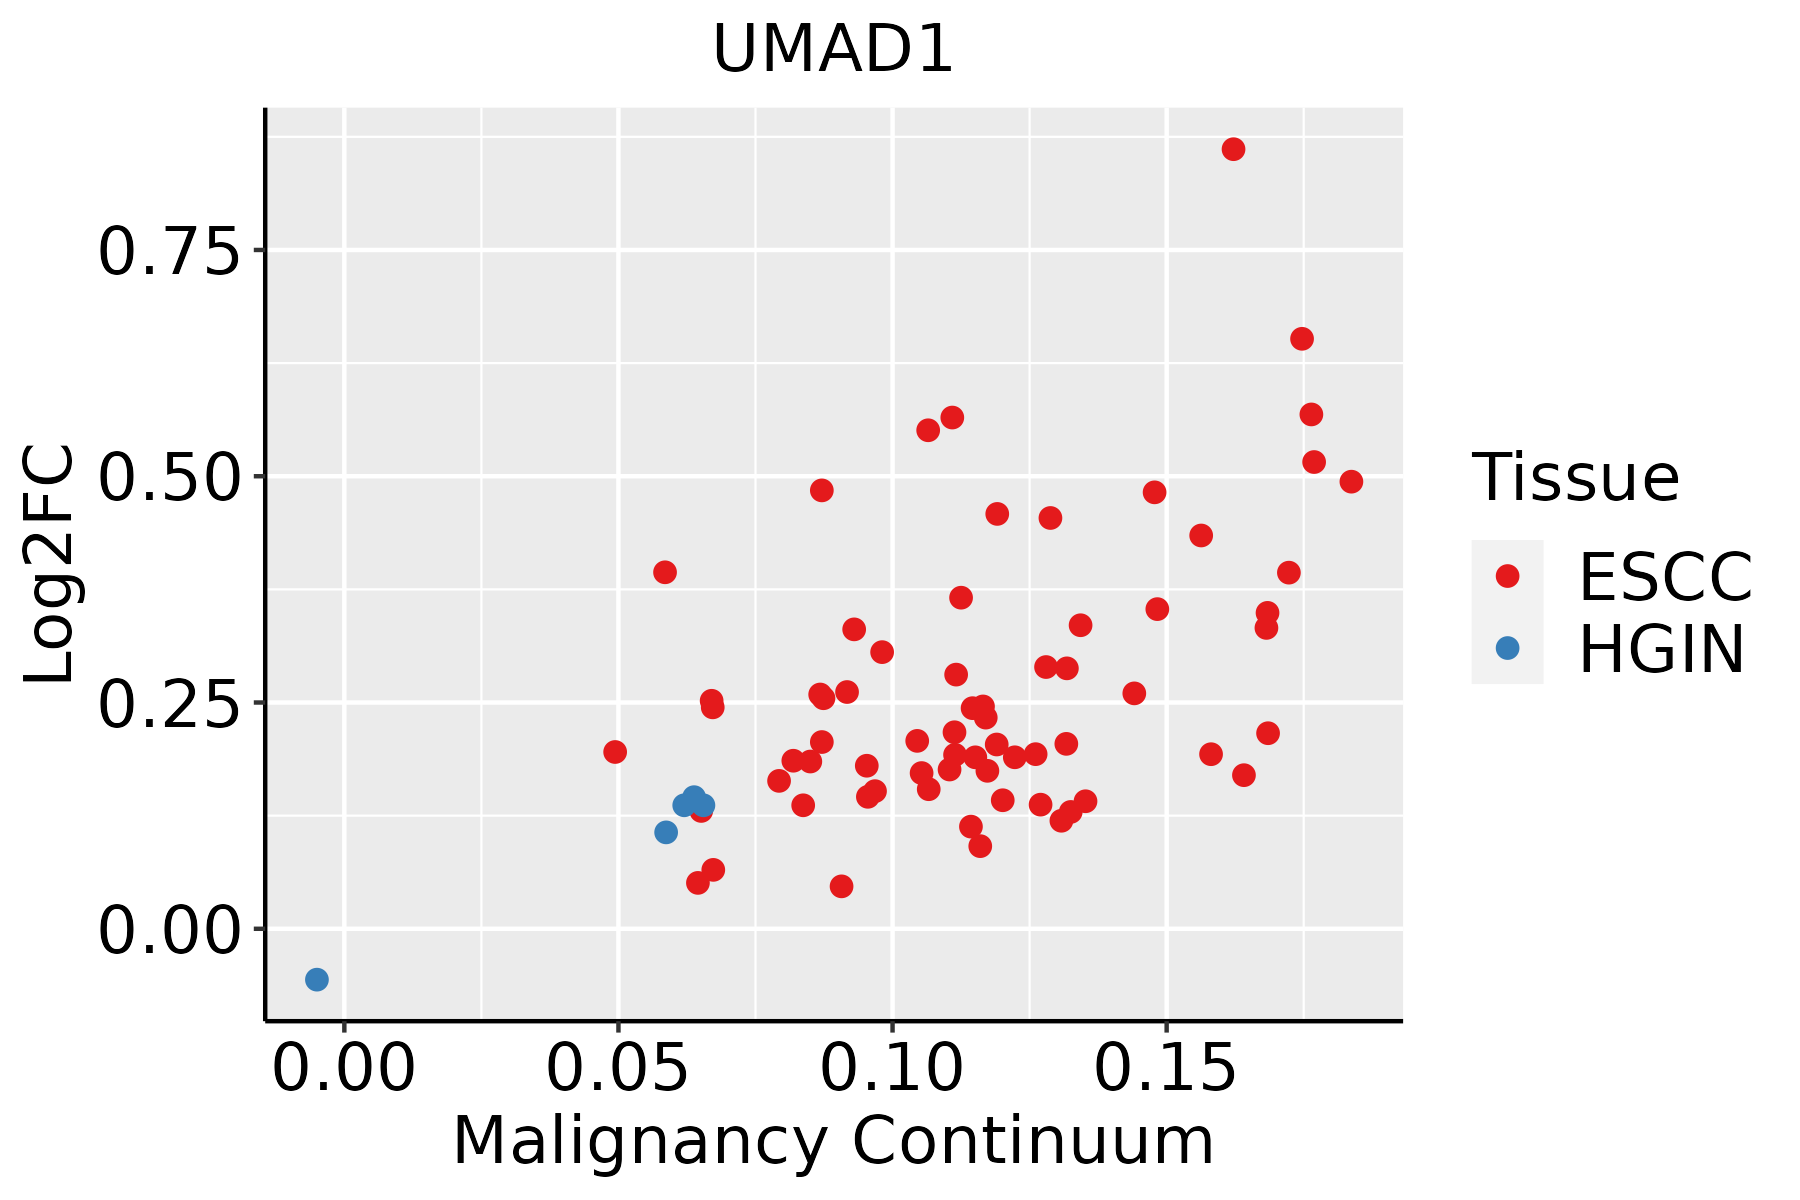 | ESCC: Esophageal squamous cell carcinoma |
| HGIN: High-grade intraepithelial neoplasias | ||
| LGIN: Low-grade intraepithelial neoplasias | ||
| Liver | 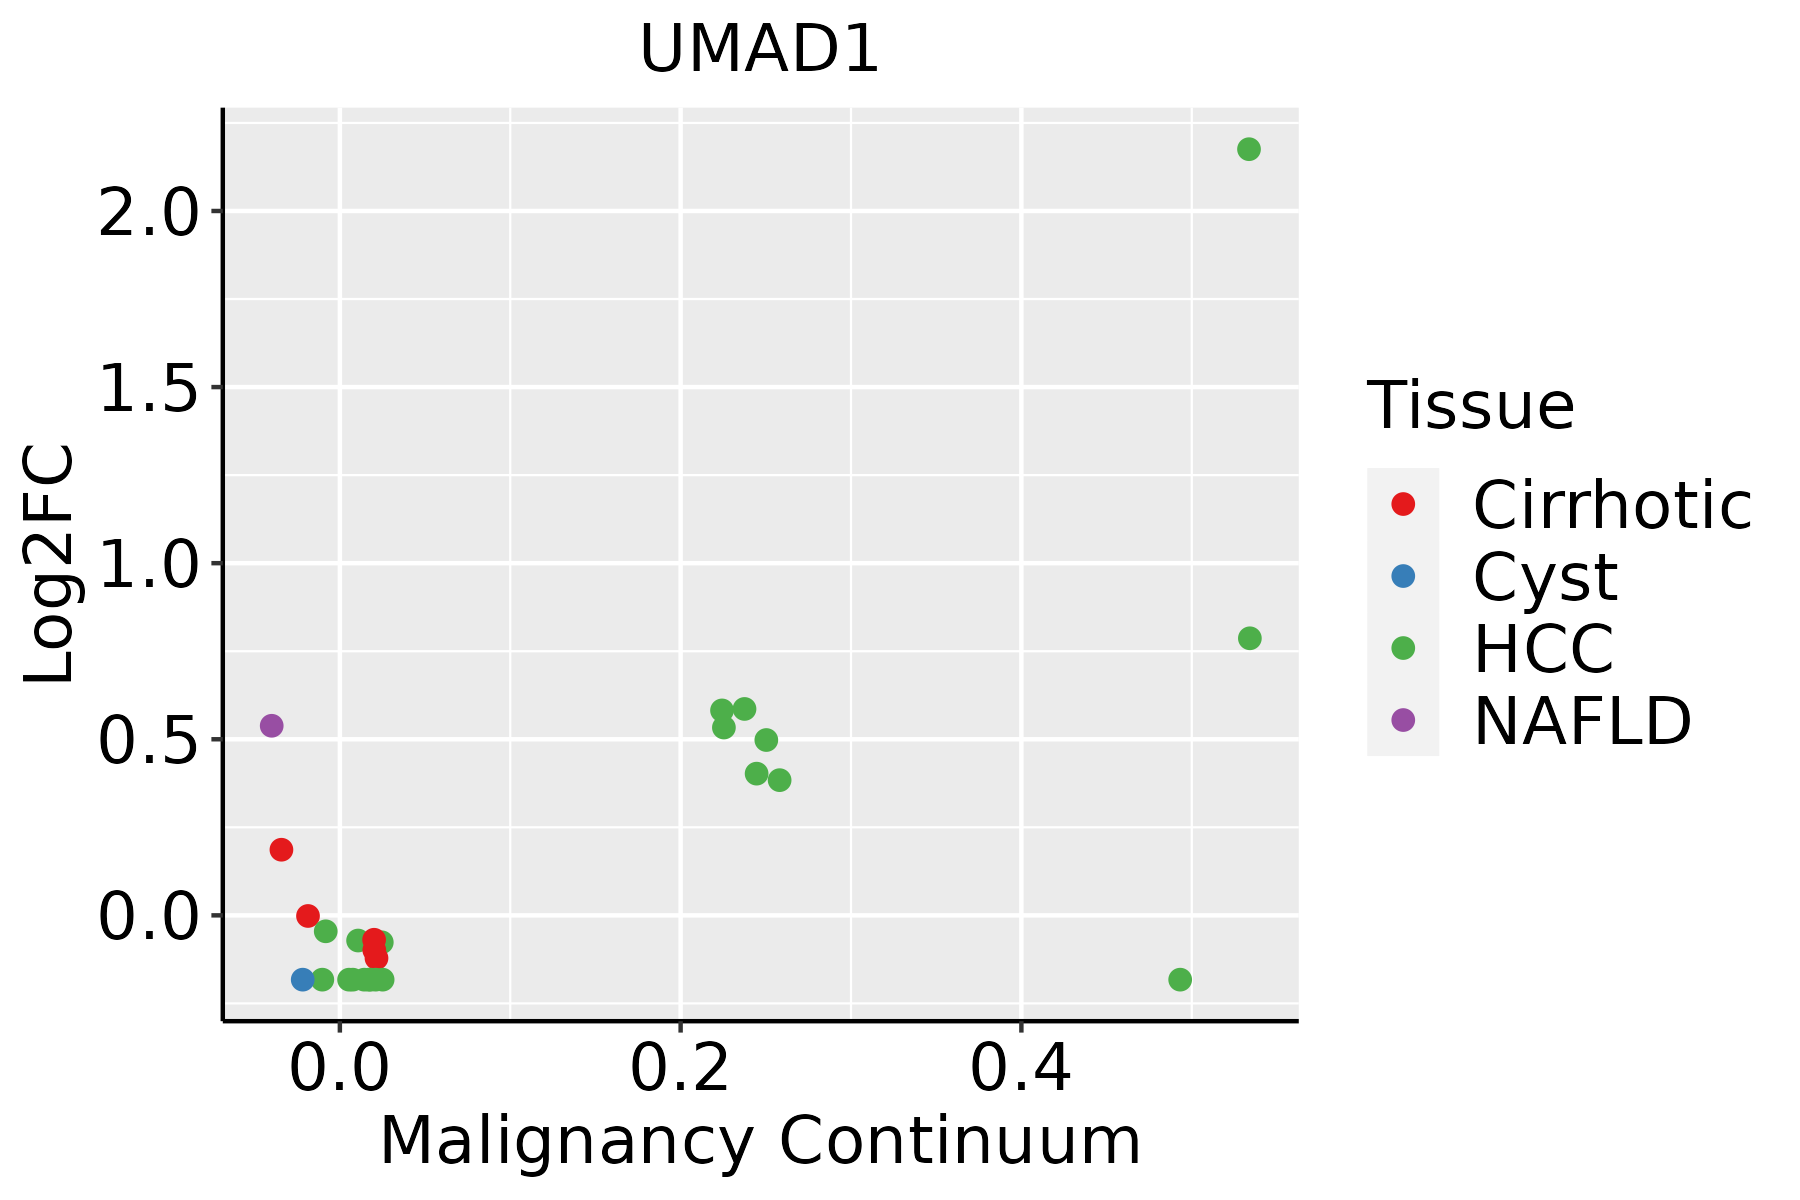 | HCC: Hepatocellular carcinoma |
| NAFLD: Non-alcoholic fatty liver disease | ||
| Lung | 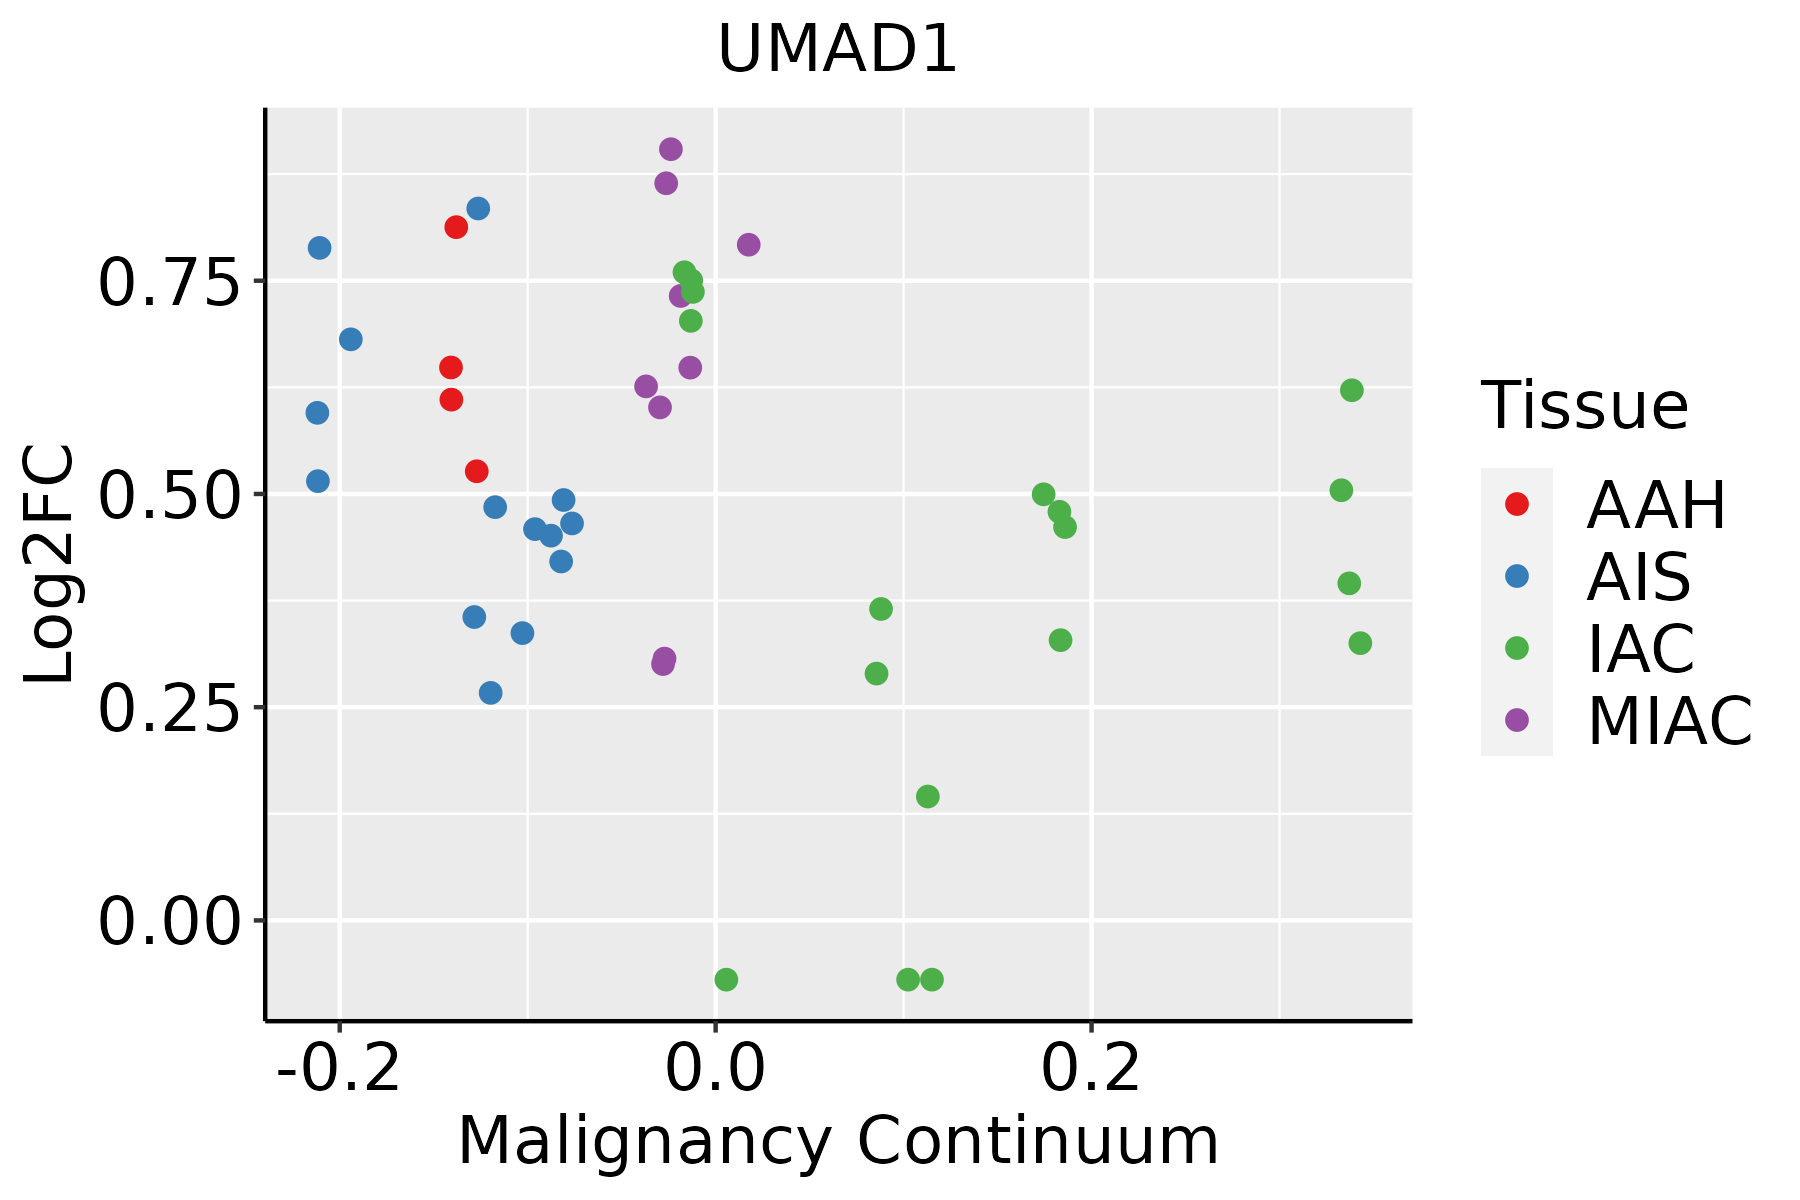 | AAH: Atypical adenomatous hyperplasia |
| AIS: Adenocarcinoma in situ | ||
| IAC: Invasive lung adenocarcinoma | ||
| MIA: Minimally invasive adenocarcinoma |
| ∗log2FC in expression of this searched gene in stem-like cells from each diseased tissue sample relative to stem-like cells in normal samples in each tissue plotted against the malignancy continuum. Samples are colored based on if they are from different disease stage. |
Top |
Malignant transformation related pathway analysis |
| Find out the enriched GO biological processes and KEGG pathways involved in transition from healthy to precancer to cancer |
| Tissue | Disease Stage | Enriched GO biological Processes |
| Colorectum | AD |  |
| Colorectum | SER |  |
| Colorectum | MSS |  |
| Colorectum | MSI-H |  |
| Colorectum | FAP |  |
| ∗Top 15 enriched GO BP terms are showed in the bar plot of each disease state in each tissue. Each row represents a significant GO biological process which is colored according to the -log10(p.adjust). |
| Page: 1 2 3 4 5 6 7 8 9 |
| GO ID | Tissue | Disease Stage | Description | Gene Ratio | Bg Ratio | pvalue | p.adjust | Count |
| Page: 1 |
| Pathway ID | Tissue | Disease Stage | Description | Gene Ratio | Bg Ratio | pvalue | p.adjust | qvalue | Count |
| Page: 1 |
Top |
Cell-cell communication analysis |
| Identification of potential cell-cell interactions between two cell types and their ligand-receptor pairs for different disease states |
| Ligand | Receptor | LRpair | Pathway | Tissue | Disease Stage |
| Page: 1 |
Top |
Single-cell gene regulatory network inference analysis |
| Find out the significant the regulons (TFs) and the target genes of each regulon across cell types for different disease states |
| TF | Cell Type | Tissue | Disease Stage | Target Gene | RSS | Regulon Activity |
| ∗The dot plots of a searched regulon are shown for all cell subpopulations in each disease state of each tissue based on the regulon specific score inferred using pySCENIC and by calculating the average expression. |
| Page: 1 |
Top |
Somatic mutation of malignant transformation related genes |
| Annotation of somatic variants for genes involved in malignant transformation |
| Hugo Symbol | Variant Class | Variant Classification | dbSNP RS | HGVSc | HGVSp | HGVSp Short | SWISSPROT | BIOTYPE | SIFT | PolyPhen | Tumor Sample Barcode | Tissue | Histology | Sex | Age | Stage | Therapy Types | Drugs | Outcome |
| UMAD1 | SNV | Missense_Mutation | novel | c.182T>C | p.Val61Ala | p.V61A | protein_coding | tolerated(0.16) | benign(0.085) | TCGA-2W-A8YY-01 | Cervix | cervical & endocervical cancer | Female | <65 | I/II | Chemotherapy | cisplatin | CR | |
| UMAD1 | SNV | Missense_Mutation | novel | c.171T>G | p.Asn57Lys | p.N57K | protein_coding | tolerated(0.73) | benign(0.003) | TCGA-AX-A2HC-01 | Endometrium | uterine corpus endometrioid carcinoma | Female | <65 | III/IV | Chemotherapy | paclitaxel | PD | |
| UMAD1 | SNV | Missense_Mutation | rs749662057 | c.179N>A | p.Ser60Asn | p.S60N | protein_coding | tolerated(0.18) | benign(0.003) | TCGA-B5-A3FA-01 | Endometrium | uterine corpus endometrioid carcinoma | Female | >=65 | I/II | Unknown | Unknown | SD | |
| UMAD1 | SNV | Missense_Mutation | rs757161472 | c.352G>A | p.Glu118Lys | p.E118K | protein_coding | tolerated(0.1) | benign(0.325) | TCGA-DF-A2KN-01 | Endometrium | uterine corpus endometrioid carcinoma | Female | Unknown | I/II | Unknown | Unknown | SD |
| Page: 1 |
Top |
Related drugs of malignant transformation related genes |
| Identification of chemicals and drugs interact with genes involved in malignant transfromation |
| (DGIdb 4.0) |
| Entrez ID | Symbol | Category | Interaction Types | Drug Claim Name | Drug Name | PMIDs |
| Page: 1 |

Copyright 2023-Present -The University of Texas Health Science Center at Houston |