
|
|||||
|
 | |
| |
| |
| |
| |
| |
|
Gene: UBE2V1 |
Gene summary for UBE2V1 |
| Gene information | Species | Human | Gene symbol | UBE2V1 | Gene ID | 7335 |
| Gene name | ubiquitin conjugating enzyme E2 V1 | |
| Gene Alias | CIR1 | |
| Cytomap | 20q13.13 | |
| Gene Type | protein-coding | GO ID | GO:0000209 | UniProtAcc | Q13404 |
Top |
Malignant transformation analysis |
| Identification of the aberrant gene expression in precancerous and cancerous lesions by comparing the gene expression of stem-like cells in diseased tissues with normal stem cells |
| Entrez ID | Symbol | Replicates | Species | Organ | Tissue | Adj P-value | Log2FC | Malignancy |
| 7335 | UBE2V1 | P4T-E | Human | Esophagus | ESCC | 1.47e-79 | 1.53e+00 | 0.1323 |
| 7335 | UBE2V1 | P5T-E | Human | Esophagus | ESCC | 1.72e-97 | 1.53e+00 | 0.1327 |
| 7335 | UBE2V1 | P8T-E | Human | Esophagus | ESCC | 6.47e-65 | 1.18e+00 | 0.0889 |
| 7335 | UBE2V1 | P9T-E | Human | Esophagus | ESCC | 4.89e-49 | 9.02e-01 | 0.1131 |
| 7335 | UBE2V1 | P10T-E | Human | Esophagus | ESCC | 1.87e-85 | 1.30e+00 | 0.116 |
| 7335 | UBE2V1 | P11T-E | Human | Esophagus | ESCC | 9.71e-57 | 1.78e+00 | 0.1426 |
| 7335 | UBE2V1 | P12T-E | Human | Esophagus | ESCC | 8.57e-87 | 1.46e+00 | 0.1122 |
| 7335 | UBE2V1 | P15T-E | Human | Esophagus | ESCC | 7.26e-110 | 1.96e+00 | 0.1149 |
| 7335 | UBE2V1 | P16T-E | Human | Esophagus | ESCC | 2.11e-69 | 1.36e+00 | 0.1153 |
| 7335 | UBE2V1 | P17T-E | Human | Esophagus | ESCC | 1.46e-40 | 1.56e+00 | 0.1278 |
| 7335 | UBE2V1 | P19T-E | Human | Esophagus | ESCC | 6.86e-29 | 1.86e+00 | 0.1662 |
| 7335 | UBE2V1 | P20T-E | Human | Esophagus | ESCC | 1.17e-76 | 1.43e+00 | 0.1124 |
| 7335 | UBE2V1 | P21T-E | Human | Esophagus | ESCC | 6.81e-120 | 2.70e+00 | 0.1617 |
| 7335 | UBE2V1 | P22T-E | Human | Esophagus | ESCC | 2.97e-80 | 1.24e+00 | 0.1236 |
| 7335 | UBE2V1 | P23T-E | Human | Esophagus | ESCC | 8.82e-81 | 1.81e+00 | 0.108 |
| 7335 | UBE2V1 | P24T-E | Human | Esophagus | ESCC | 1.10e-74 | 1.36e+00 | 0.1287 |
| 7335 | UBE2V1 | P26T-E | Human | Esophagus | ESCC | 1.82e-136 | 2.25e+00 | 0.1276 |
| 7335 | UBE2V1 | P27T-E | Human | Esophagus | ESCC | 2.35e-49 | 8.28e-01 | 0.1055 |
| 7335 | UBE2V1 | P28T-E | Human | Esophagus | ESCC | 9.71e-78 | 1.34e+00 | 0.1149 |
| 7335 | UBE2V1 | P30T-E | Human | Esophagus | ESCC | 1.30e-58 | 1.54e+00 | 0.137 |
| Page: 1 2 3 4 5 6 7 8 9 10 |
| Tissue | Expression Dynamics | Abbreviation |
| Cervix | 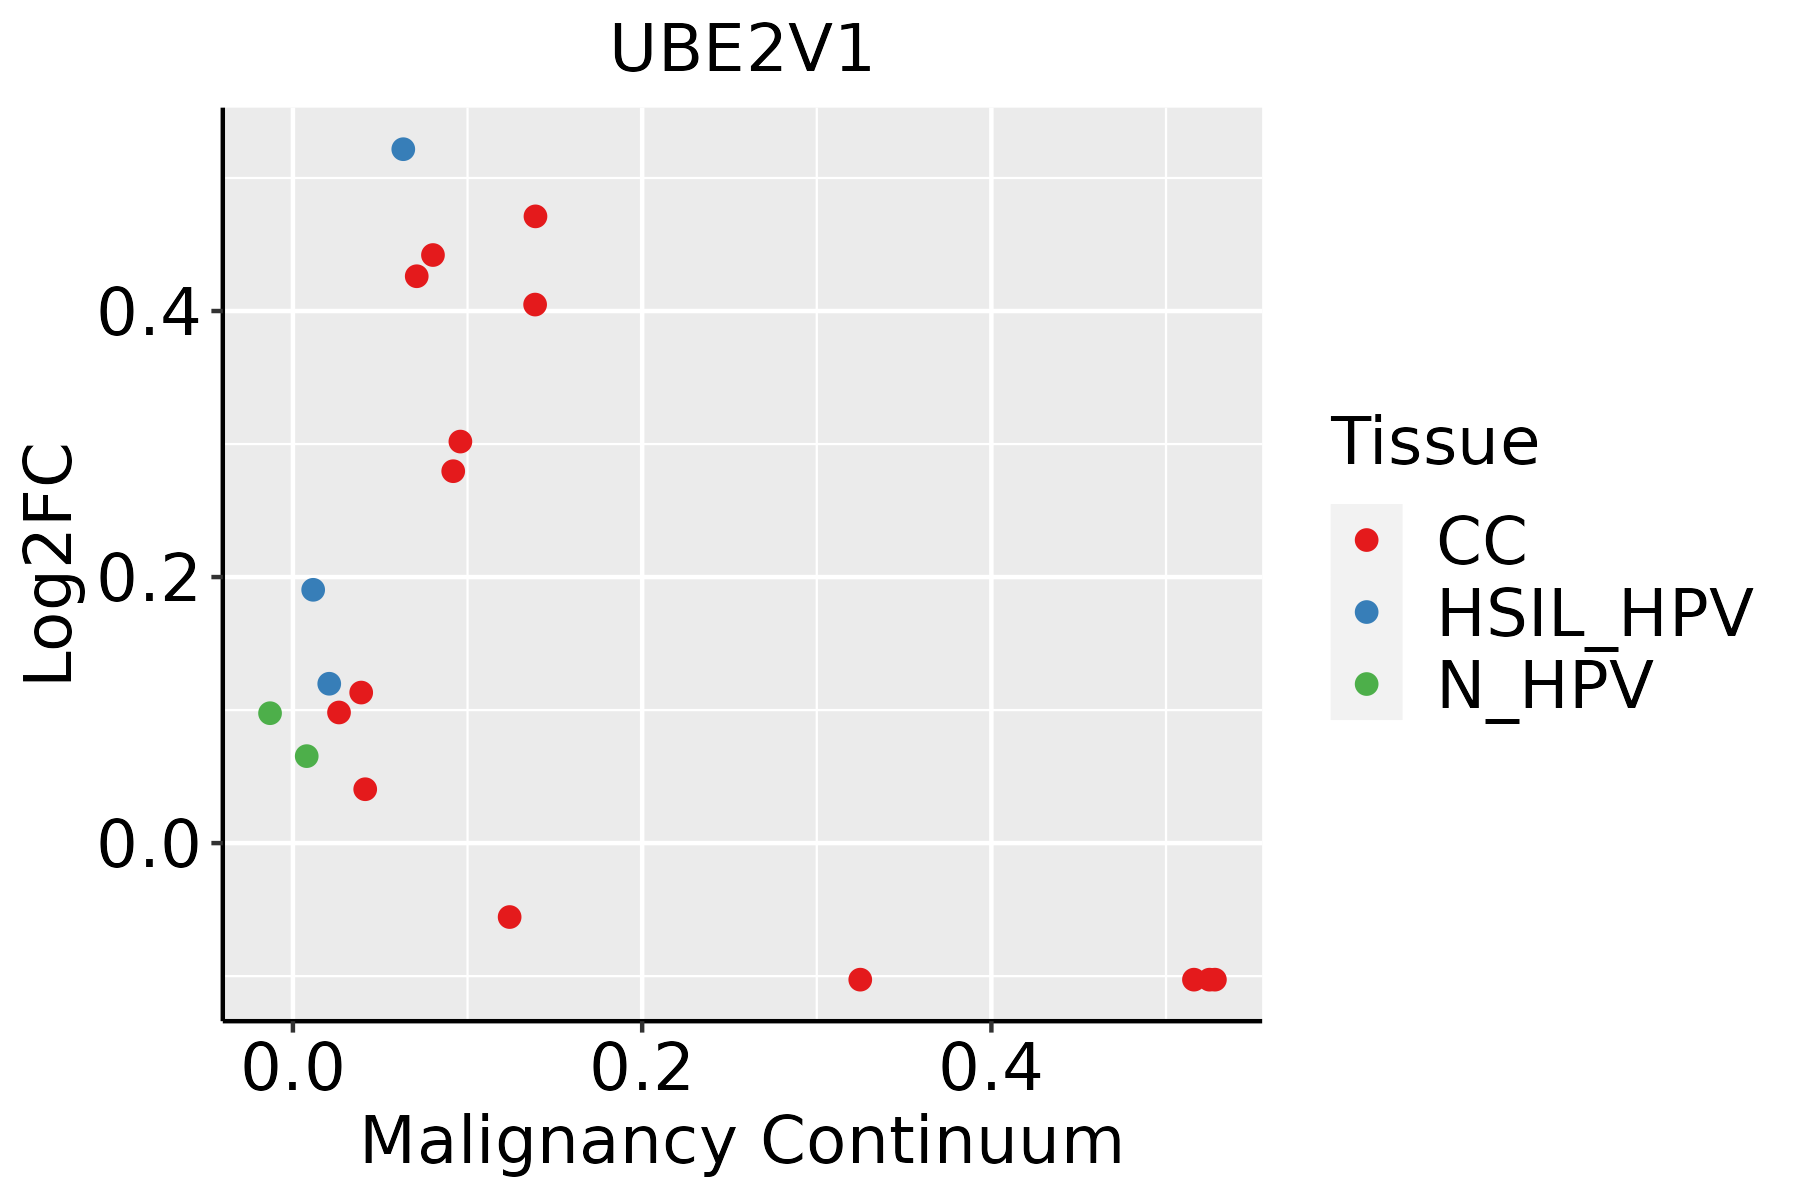 | CC: Cervix cancer |
| HSIL_HPV: HPV-infected high-grade squamous intraepithelial lesions | ||
| N_HPV: HPV-infected normal cervix | ||
| Colorectum (GSE201348) |  | FAP: Familial adenomatous polyposis |
| CRC: Colorectal cancer | ||
| Colorectum (HTA11) |  | AD: Adenomas |
| SER: Sessile serrated lesions | ||
| MSI-H: Microsatellite-high colorectal cancer | ||
| MSS: Microsatellite stable colorectal cancer | ||
| Esophagus |  | ESCC: Esophageal squamous cell carcinoma |
| HGIN: High-grade intraepithelial neoplasias | ||
| LGIN: Low-grade intraepithelial neoplasias | ||
| GC | 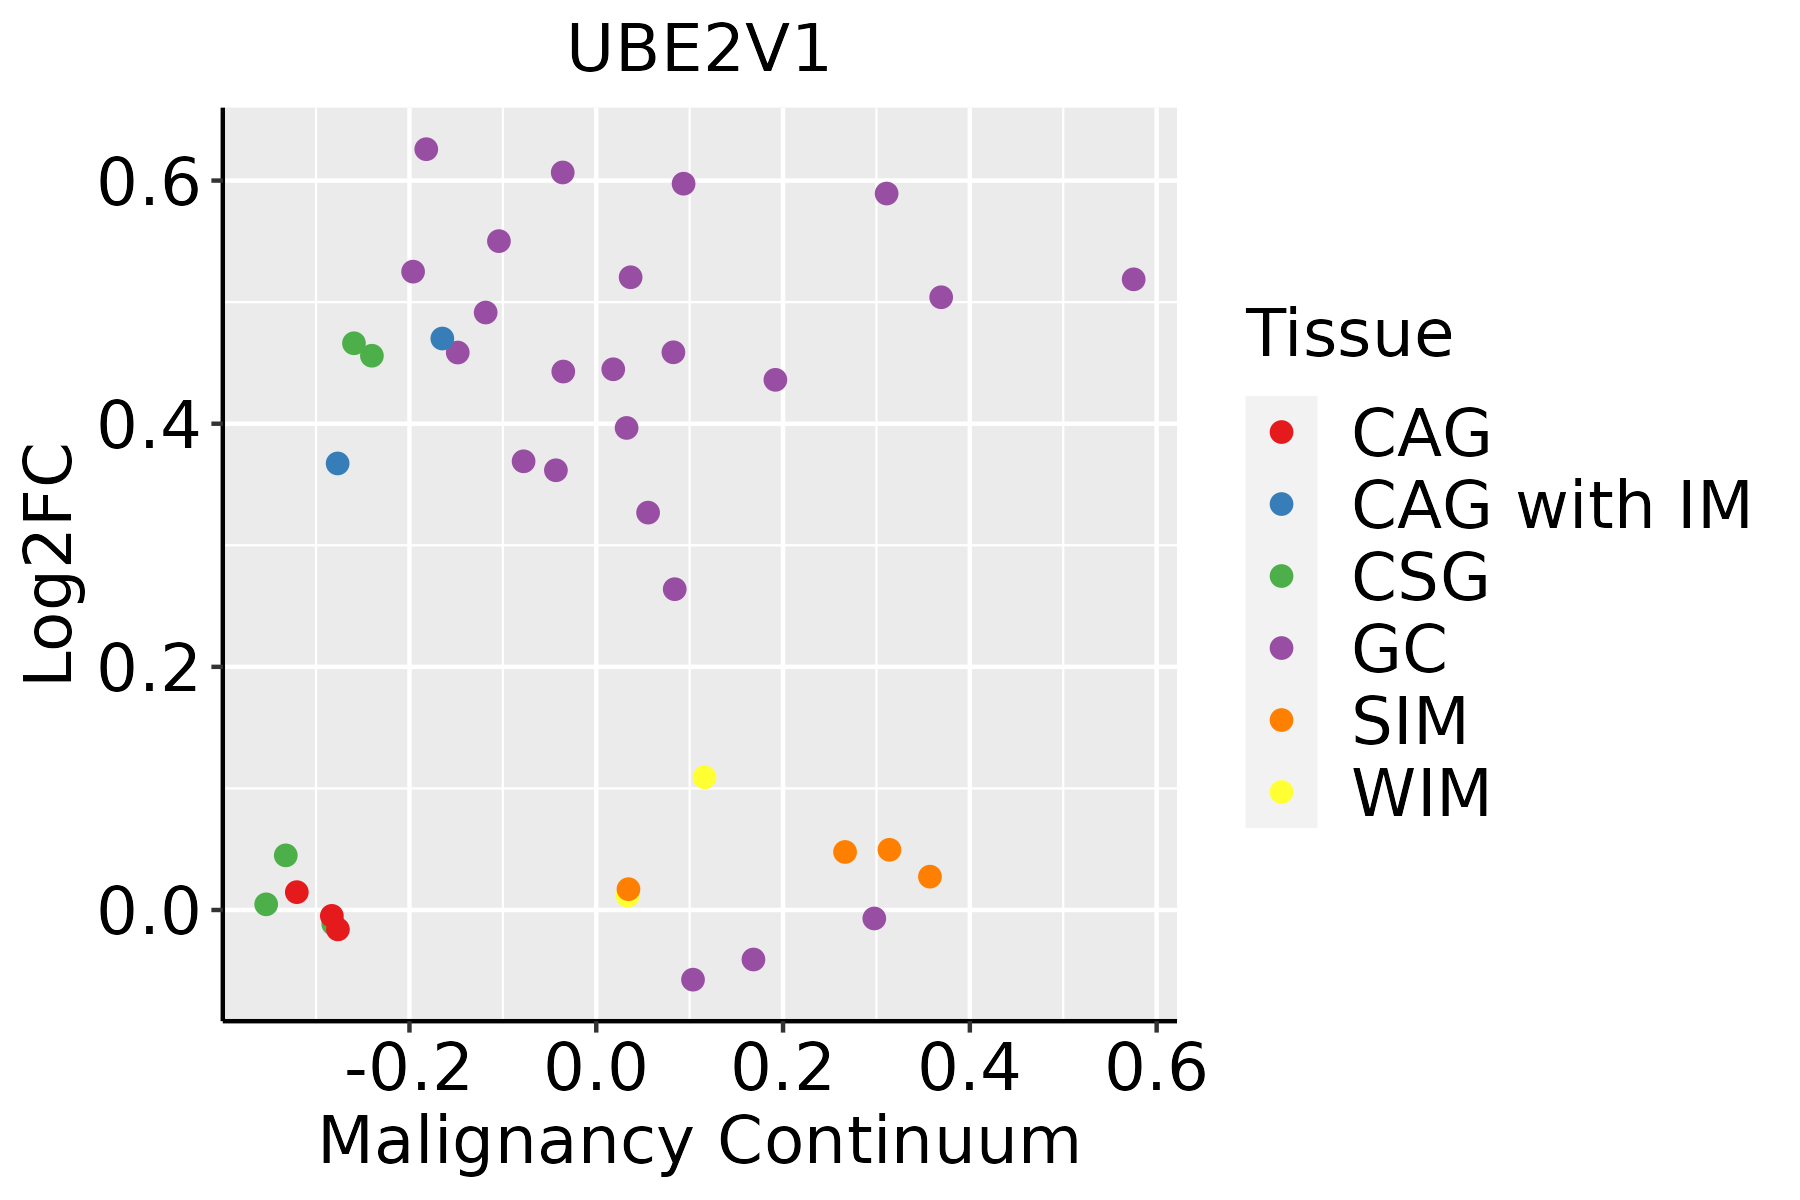 | CAG: Chronic atrophic gastritis |
| CAG with IM: Chronic atrophic gastritis with intestinal metaplasia | ||
| CSG: Chronic superficial gastritis | ||
| GC: Gastric cancer | ||
| SIM: Severe intestinal metaplasia | ||
| WIM: Wild intestinal metaplasia | ||
| Prostate | 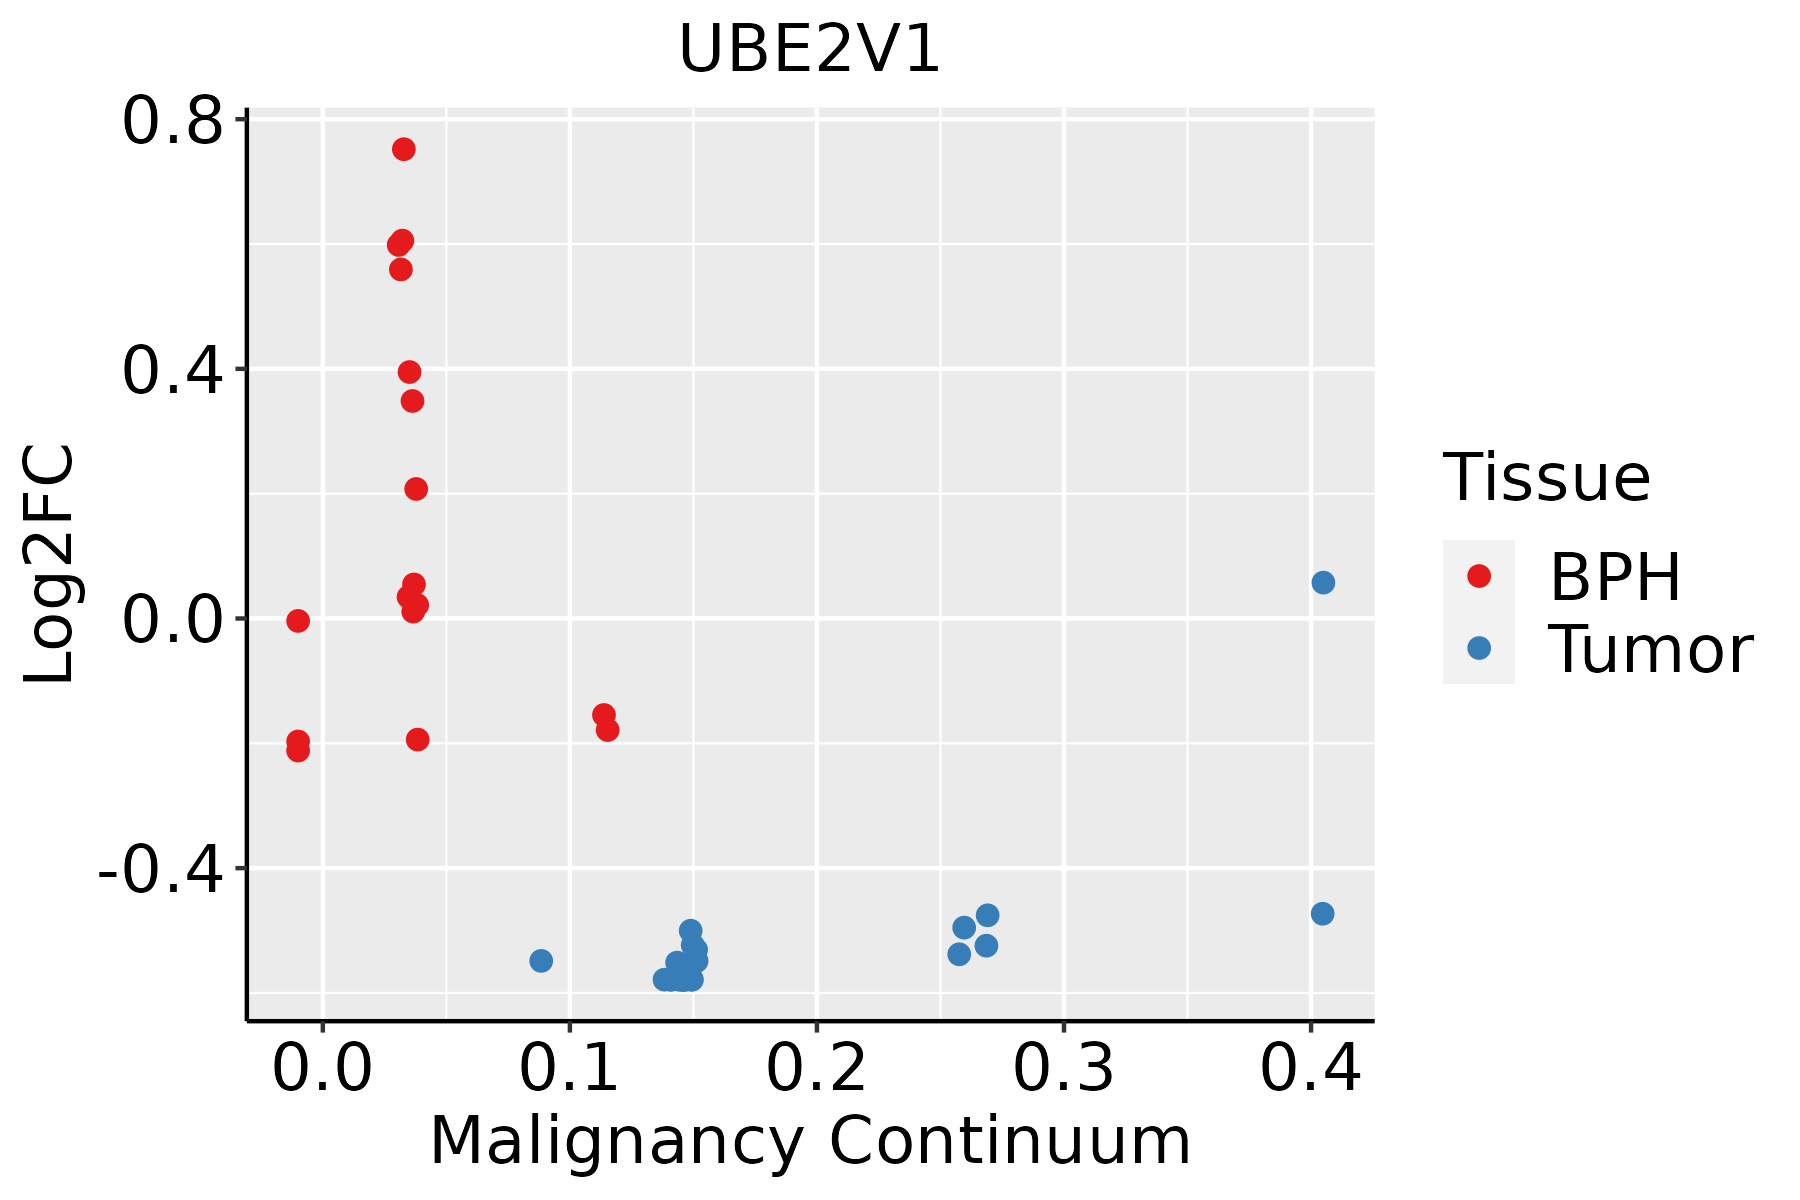 | BPH: Benign Prostatic Hyperplasia |
| Skin | 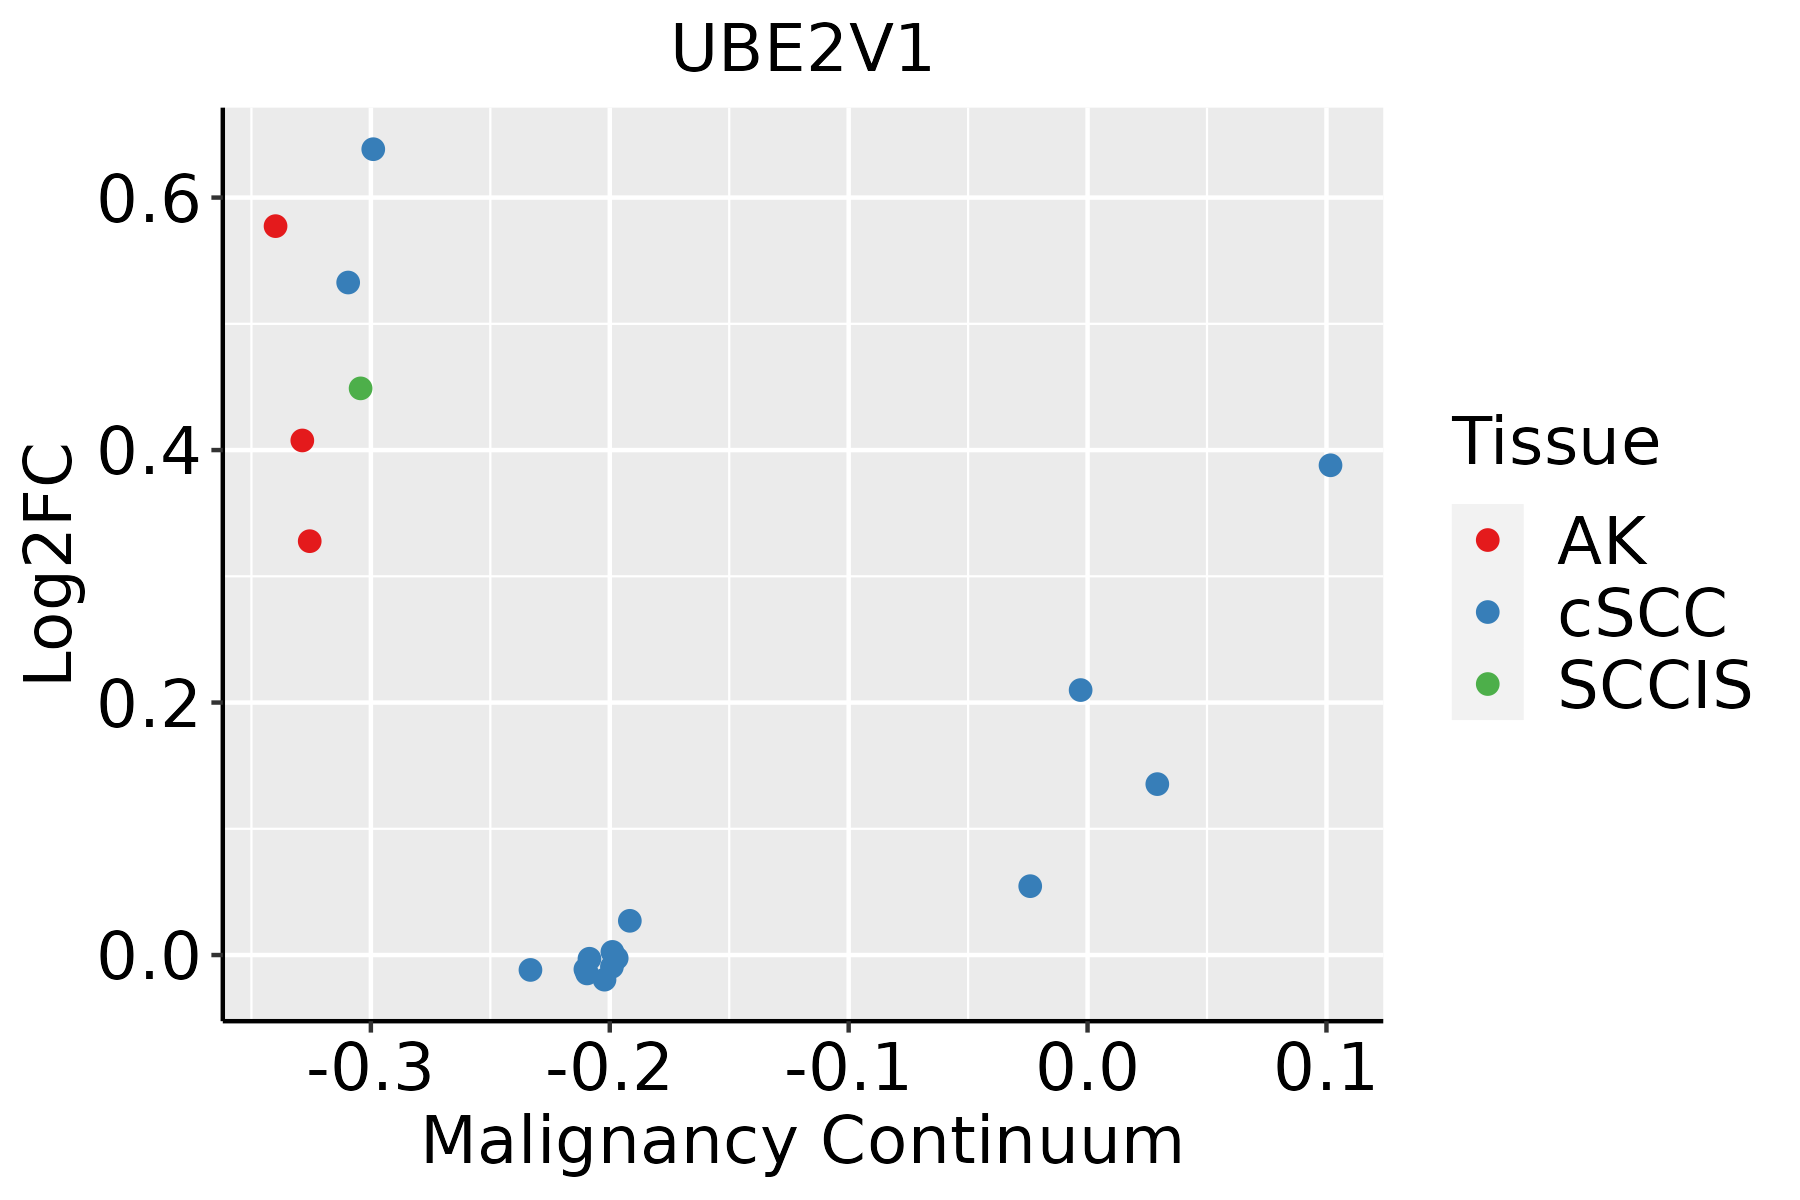 | AK: Actinic keratosis |
| cSCC: Cutaneous squamous cell carcinoma | ||
| SCCIS:squamous cell carcinoma in situ | ||
| Thyroid | 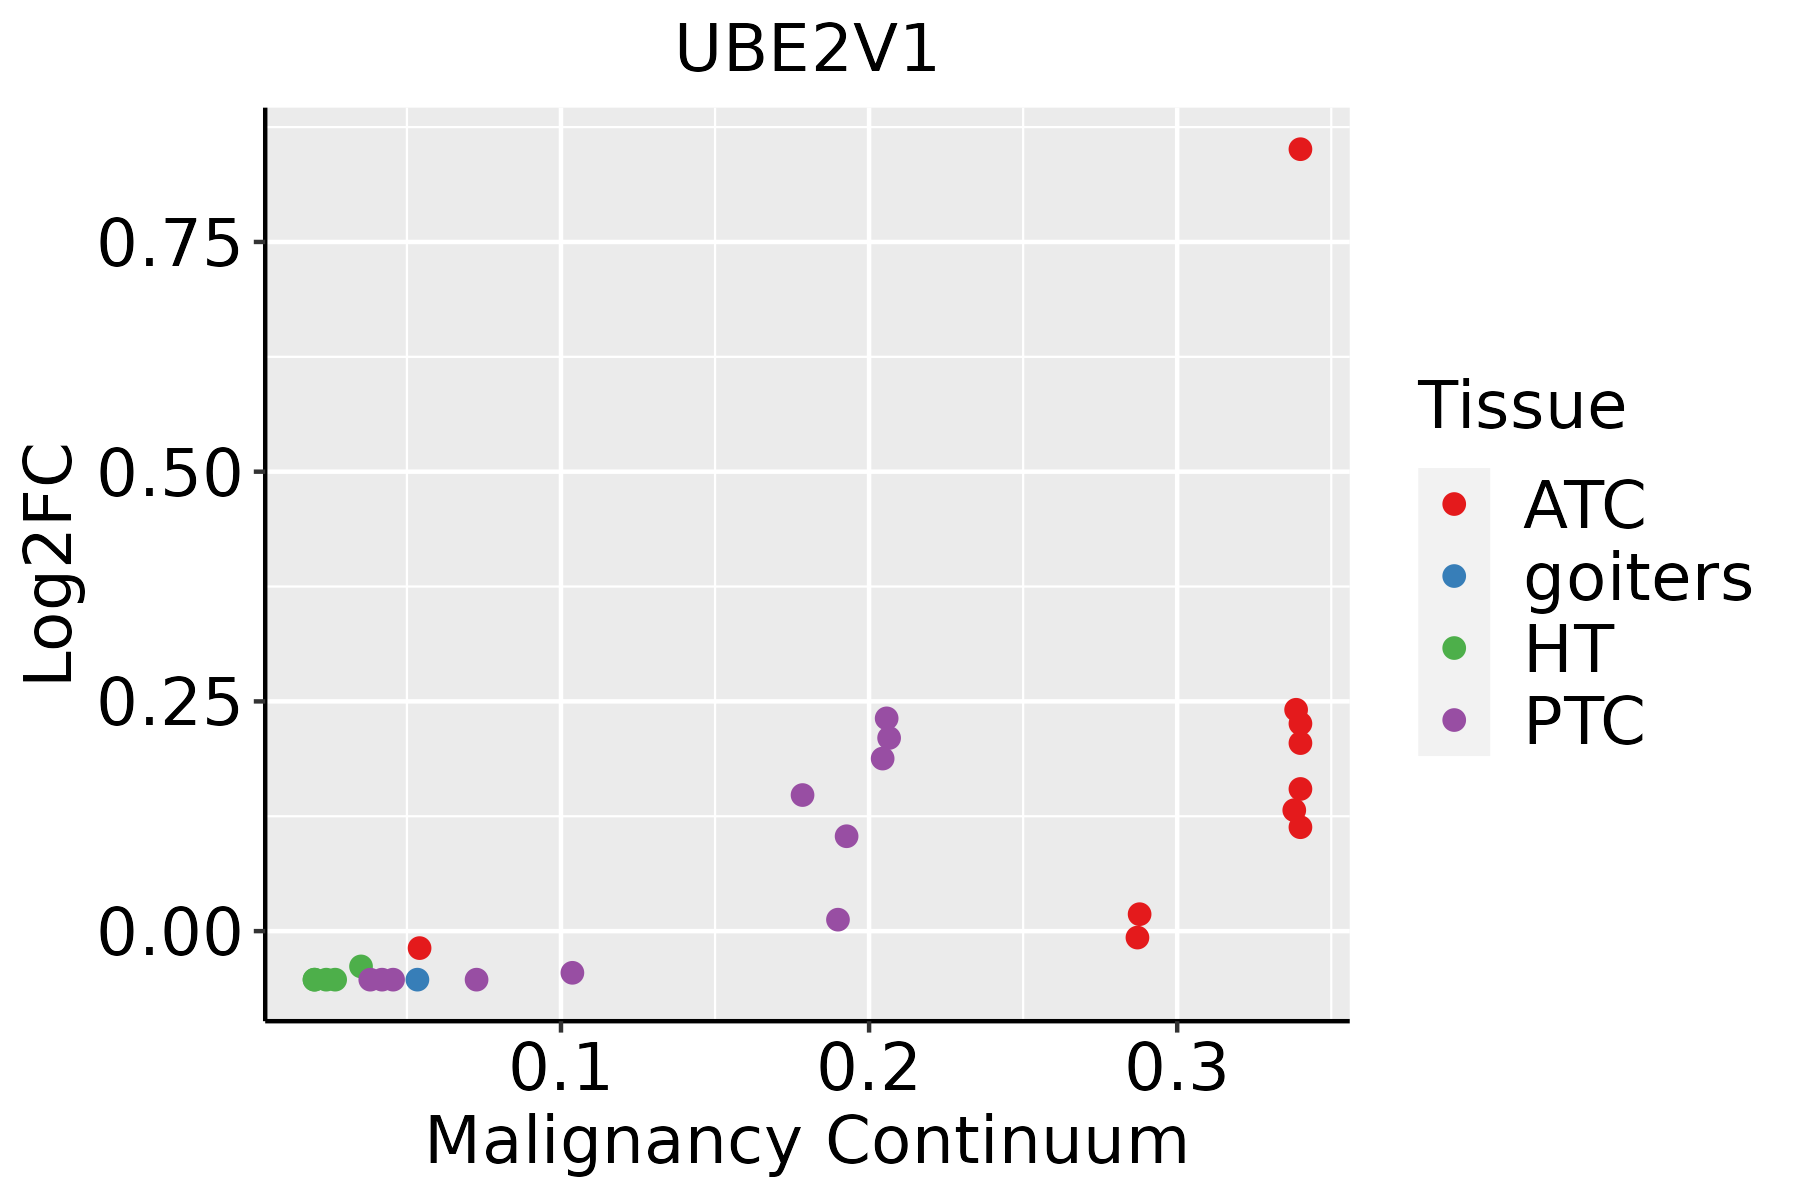 | ATC: Anaplastic thyroid cancer |
| HT: Hashimoto's thyroiditis | ||
| PTC: Papillary thyroid cancer |
| ∗log2FC in expression of this searched gene in stem-like cells from each diseased tissue sample relative to stem-like cells in normal samples in each tissue plotted against the malignancy continuum. Samples are colored based on if they are from different disease stage. |
Top |
Malignant transformation related pathway analysis |
| Find out the enriched GO biological processes and KEGG pathways involved in transition from healthy to precancer to cancer |
| Tissue | Disease Stage | Enriched GO biological Processes |
| Colorectum | AD |  |
| Colorectum | SER |  |
| Colorectum | MSS |  |
| Colorectum | MSI-H |  |
| Colorectum | FAP |  |
| ∗Top 15 enriched GO BP terms are showed in the bar plot of each disease state in each tissue. Each row represents a significant GO biological process which is colored according to the -log10(p.adjust). |
| Page: 1 2 3 4 5 6 7 8 9 |
| GO ID | Tissue | Disease Stage | Description | Gene Ratio | Bg Ratio | pvalue | p.adjust | Count |
| GO:00002097 | Cervix | CC | protein polyubiquitination | 58/2311 | 236/18723 | 1.57e-07 | 7.41e-06 | 58 |
| GO:00510904 | Cervix | CC | regulation of DNA-binding transcription factor activity | 87/2311 | 440/18723 | 4.85e-06 | 1.22e-04 | 87 |
| GO:00431228 | Cervix | CC | regulation of I-kappaB kinase/NF-kappaB signaling | 53/2311 | 249/18723 | 4.50e-05 | 6.87e-04 | 53 |
| GO:00072497 | Cervix | CC | I-kappaB kinase/NF-kappaB signaling | 56/2311 | 281/18723 | 1.81e-04 | 2.12e-03 | 56 |
| GO:20010209 | Cervix | CC | regulation of response to DNA damage stimulus | 46/2311 | 219/18723 | 1.92e-04 | 2.23e-03 | 46 |
| GO:00510915 | Cervix | CC | positive regulation of DNA-binding transcription factor activity | 51/2311 | 260/18723 | 5.05e-04 | 4.92e-03 | 51 |
| GO:00510528 | Cervix | CC | regulation of DNA metabolic process | 65/2311 | 359/18723 | 9.25e-04 | 7.84e-03 | 65 |
| GO:00510923 | Cervix | CC | positive regulation of NF-kappaB transcription factor activity | 32/2311 | 152/18723 | 1.62e-03 | 1.25e-02 | 32 |
| GO:00431237 | Cervix | CC | positive regulation of I-kappaB kinase/NF-kappaB signaling | 37/2311 | 186/18723 | 2.15e-03 | 1.55e-02 | 37 |
| GO:00705343 | Cervix | CC | protein K63-linked ubiquitination | 14/2311 | 56/18723 | 6.93e-03 | 3.74e-02 | 14 |
| GO:005109211 | Cervix | HSIL_HPV | positive regulation of NF-kappaB transcription factor activity | 20/737 | 152/18723 | 2.25e-06 | 9.41e-05 | 20 |
| GO:005109012 | Cervix | HSIL_HPV | regulation of DNA-binding transcription factor activity | 35/737 | 440/18723 | 6.77e-05 | 1.58e-03 | 35 |
| GO:005109112 | Cervix | HSIL_HPV | positive regulation of DNA-binding transcription factor activity | 24/737 | 260/18723 | 1.01e-04 | 2.16e-03 | 24 |
| GO:004312215 | Cervix | HSIL_HPV | regulation of I-kappaB kinase/NF-kappaB signaling | 19/737 | 249/18723 | 4.66e-03 | 3.88e-02 | 19 |
| GO:0051052 | Colorectum | AD | regulation of DNA metabolic process | 116/3918 | 359/18723 | 2.47e-07 | 1.00e-05 | 116 |
| GO:0000209 | Colorectum | AD | protein polyubiquitination | 78/3918 | 236/18723 | 8.71e-06 | 2.06e-04 | 78 |
| GO:2001020 | Colorectum | AD | regulation of response to DNA damage stimulus | 71/3918 | 219/18723 | 4.38e-05 | 7.65e-04 | 71 |
| GO:0043123 | Colorectum | AD | positive regulation of I-kappaB kinase/NF-kappaB signaling | 60/3918 | 186/18723 | 1.91e-04 | 2.56e-03 | 60 |
| GO:0043122 | Colorectum | AD | regulation of I-kappaB kinase/NF-kappaB signaling | 76/3918 | 249/18723 | 2.17e-04 | 2.85e-03 | 76 |
| GO:0007249 | Colorectum | AD | I-kappaB kinase/NF-kappaB signaling | 82/3918 | 281/18723 | 6.09e-04 | 6.40e-03 | 82 |
| Page: 1 2 3 4 5 6 7 |
| Pathway ID | Tissue | Disease Stage | Description | Gene Ratio | Bg Ratio | pvalue | p.adjust | qvalue | Count |
| hsa05131 | Colorectum | AD | Shigellosis | 109/2092 | 247/8465 | 1.09e-11 | 2.44e-10 | 1.55e-10 | 109 |
| hsa051311 | Colorectum | AD | Shigellosis | 109/2092 | 247/8465 | 1.09e-11 | 2.44e-10 | 1.55e-10 | 109 |
| hsa051312 | Colorectum | SER | Shigellosis | 87/1580 | 247/8465 | 3.07e-10 | 7.27e-09 | 5.28e-09 | 87 |
| hsa051313 | Colorectum | SER | Shigellosis | 87/1580 | 247/8465 | 3.07e-10 | 7.27e-09 | 5.28e-09 | 87 |
| hsa051314 | Colorectum | MSS | Shigellosis | 94/1875 | 247/8465 | 6.82e-09 | 1.34e-07 | 8.23e-08 | 94 |
| hsa051315 | Colorectum | MSS | Shigellosis | 94/1875 | 247/8465 | 6.82e-09 | 1.34e-07 | 8.23e-08 | 94 |
| hsa051316 | Colorectum | MSI-H | Shigellosis | 40/797 | 247/8465 | 4.28e-04 | 5.34e-03 | 4.47e-03 | 40 |
| hsa051317 | Colorectum | MSI-H | Shigellosis | 40/797 | 247/8465 | 4.28e-04 | 5.34e-03 | 4.47e-03 | 40 |
| hsa0513139 | Esophagus | HGIN | Shigellosis | 71/1383 | 247/8465 | 4.89e-07 | 7.98e-06 | 6.34e-06 | 71 |
| hsa05131114 | Esophagus | HGIN | Shigellosis | 71/1383 | 247/8465 | 4.89e-07 | 7.98e-06 | 6.34e-06 | 71 |
| hsa05131211 | Esophagus | ESCC | Shigellosis | 176/4205 | 247/8465 | 2.27e-12 | 4.01e-11 | 2.05e-11 | 176 |
| hsa05131310 | Esophagus | ESCC | Shigellosis | 176/4205 | 247/8465 | 2.27e-12 | 4.01e-11 | 2.05e-11 | 176 |
| hsa0513128 | Prostate | BPH | Shigellosis | 94/1718 | 247/8465 | 5.19e-11 | 9.51e-10 | 5.89e-10 | 94 |
| hsa05131112 | Prostate | BPH | Shigellosis | 94/1718 | 247/8465 | 5.19e-11 | 9.51e-10 | 5.89e-10 | 94 |
| hsa0513129 | Prostate | Tumor | Shigellosis | 94/1791 | 247/8465 | 5.56e-10 | 9.69e-09 | 6.01e-09 | 94 |
| hsa0513137 | Prostate | Tumor | Shigellosis | 94/1791 | 247/8465 | 5.56e-10 | 9.69e-09 | 6.01e-09 | 94 |
| hsa0513112 | Stomach | GC | Shigellosis | 36/708 | 247/8465 | 6.74e-04 | 5.42e-03 | 3.82e-03 | 36 |
| hsa0513113 | Stomach | GC | Shigellosis | 36/708 | 247/8465 | 6.74e-04 | 5.42e-03 | 3.82e-03 | 36 |
| hsa0513141 | Stomach | CSG | Shigellosis | 34/633 | 247/8465 | 3.60e-04 | 3.25e-03 | 2.34e-03 | 34 |
| hsa0513151 | Stomach | CSG | Shigellosis | 34/633 | 247/8465 | 3.60e-04 | 3.25e-03 | 2.34e-03 | 34 |
| Page: 1 |
Top |
Cell-cell communication analysis |
| Identification of potential cell-cell interactions between two cell types and their ligand-receptor pairs for different disease states |
| Ligand | Receptor | LRpair | Pathway | Tissue | Disease Stage |
| Page: 1 |
Top |
Single-cell gene regulatory network inference analysis |
| Find out the significant the regulons (TFs) and the target genes of each regulon across cell types for different disease states |
| TF | Cell Type | Tissue | Disease Stage | Target Gene | RSS | Regulon Activity |
| ∗The dot plots of a searched regulon are shown for all cell subpopulations in each disease state of each tissue based on the regulon specific score inferred using pySCENIC and by calculating the average expression. |
| Page: 1 |
Top |
Somatic mutation of malignant transformation related genes |
| Annotation of somatic variants for genes involved in malignant transformation |
| Hugo Symbol | Variant Class | Variant Classification | dbSNP RS | HGVSc | HGVSp | HGVSp Short | SWISSPROT | BIOTYPE | SIFT | PolyPhen | Tumor Sample Barcode | Tissue | Histology | Sex | Age | Stage | Therapy Types | Drugs | Outcome |
| UBE2V1 | SNV | Missense_Mutation | c.470N>C | p.Met157Thr | p.M157T | Q13404 | protein_coding | tolerated(0.12) | benign(0.04) | TCGA-AA-3492-01 | Colorectum | colon adenocarcinoma | Female | >=65 | I/II | Unknown | Unknown | SD | |
| UBE2V1 | SNV | Missense_Mutation | c.488N>T | p.Pro163Leu | p.P163L | Q13404 | protein_coding | deleterious(0.02) | possibly_damaging(0.469) | TCGA-AA-3821-01 | Colorectum | colon adenocarcinoma | Female | >=65 | I/II | Unknown | Unknown | SD | |
| UBE2V1 | SNV | Missense_Mutation | c.190G>A | p.Glu64Lys | p.E64K | Q13404 | protein_coding | deleterious(0.03) | benign(0.059) | TCGA-AA-A010-01 | Colorectum | colon adenocarcinoma | Female | <65 | I/II | Chemotherapy | folinic | CR | |
| UBE2V1 | SNV | Missense_Mutation | c.113N>C | p.Phe38Ser | p.F38S | Q13404 | protein_coding | deleterious(0) | probably_damaging(0.998) | TCGA-CA-6718-01 | Colorectum | colon adenocarcinoma | Male | <65 | I/II | Unknown | Unknown | PD | |
| UBE2V1 | SNV | Missense_Mutation | novel | c.356C>A | p.Ser119Tyr | p.S119Y | Q13404 | protein_coding | deleterious(0) | probably_damaging(0.918) | TCGA-AG-A002-01 | Colorectum | rectum adenocarcinoma | Male | <65 | I/II | Unknown | Unknown | SD |
| UBE2V1 | SNV | Missense_Mutation | novel | c.445N>T | p.Arg149Cys | p.R149C | Q13404 | protein_coding | tolerated(0.12) | benign(0.041) | TCGA-A5-A0G2-01 | Endometrium | uterine corpus endometrioid carcinoma | Female | <65 | III/IV | Unknown | Unknown | SD |
| UBE2V1 | SNV | Missense_Mutation | novel | c.76N>C | p.Lys26Gln | p.K26Q | Q13404 | protein_coding | deleterious_low_confidence(0.04) | benign(0.017) | TCGA-A5-A2K5-01 | Endometrium | uterine corpus endometrioid carcinoma | Female | >=65 | I/II | Unknown | Unknown | SD |
| UBE2V1 | SNV | Missense_Mutation | c.190G>A | p.Glu64Lys | p.E64K | Q13404 | protein_coding | deleterious(0.03) | benign(0.059) | TCGA-AJ-A5DW-01 | Endometrium | uterine corpus endometrioid carcinoma | Female | <65 | I/II | Unknown | Unknown | SD | |
| UBE2V1 | SNV | Missense_Mutation | c.104N>A | p.Pro35His | p.P35H | Q13404 | protein_coding | deleterious(0) | probably_damaging(1) | TCGA-AP-A053-01 | Endometrium | uterine corpus endometrioid carcinoma | Female | >=65 | I/II | Unknown | Unknown | SD | |
| UBE2V1 | SNV | Missense_Mutation | c.190N>A | p.Glu64Lys | p.E64K | Q13404 | protein_coding | deleterious(0.03) | benign(0.059) | TCGA-AX-A05Z-01 | Endometrium | uterine corpus endometrioid carcinoma | Female | <65 | III/IV | Chemotherapy | adriamycin | SD |
| Page: 1 2 |
Top |
Related drugs of malignant transformation related genes |
| Identification of chemicals and drugs interact with genes involved in malignant transfromation |
| (DGIdb 4.0) |
| Entrez ID | Symbol | Category | Interaction Types | Drug Claim Name | Drug Name | PMIDs |
| Page: 1 |

Copyright 2023-Present -The University of Texas Health Science Center at Houston |