
|
|||||
|
 | |
| |
| |
| |
| |
| |
|
Gene: UBALD1 |
Gene summary for UBALD1 |
| Gene information | Species | Human | Gene symbol | UBALD1 | Gene ID | 124402 |
| Gene name | UBA like domain containing 1 | |
| Gene Alias | FAM100A | |
| Cytomap | 16p13.3 | |
| Gene Type | protein-coding | GO ID | GO:0003674 | UniProtAcc | K7EM88 |
Top |
Malignant transformation analysis |
| Identification of the aberrant gene expression in precancerous and cancerous lesions by comparing the gene expression of stem-like cells in diseased tissues with normal stem cells |
| Entrez ID | Symbol | Replicates | Species | Organ | Tissue | Adj P-value | Log2FC | Malignancy |
| 124402 | UBALD1 | P127T-E | Human | Esophagus | ESCC | 2.89e-16 | 3.13e-01 | 0.0826 |
| 124402 | UBALD1 | P128T-E | Human | Esophagus | ESCC | 2.08e-30 | 1.04e+00 | 0.1241 |
| 124402 | UBALD1 | P130T-E | Human | Esophagus | ESCC | 9.18e-22 | 4.91e-01 | 0.1676 |
| 124402 | UBALD1 | NAFLD1 | Human | Liver | NAFLD | 1.53e-02 | 2.78e-01 | -0.04 |
| 124402 | UBALD1 | S43 | Human | Liver | Cirrhotic | 8.43e-03 | -8.76e-02 | -0.0187 |
| 124402 | UBALD1 | HCC1_Meng | Human | Liver | HCC | 3.36e-19 | -6.04e-02 | 0.0246 |
| 124402 | UBALD1 | HCC2_Meng | Human | Liver | HCC | 6.87e-07 | -1.90e-02 | 0.0107 |
| 124402 | UBALD1 | Pt13.b | Human | Liver | HCC | 4.03e-06 | 1.02e-01 | 0.0251 |
| 124402 | UBALD1 | S014 | Human | Liver | HCC | 2.09e-10 | 6.58e-01 | 0.2254 |
| 124402 | UBALD1 | S015 | Human | Liver | HCC | 1.82e-06 | 6.50e-01 | 0.2375 |
| 124402 | UBALD1 | S016 | Human | Liver | HCC | 3.13e-15 | 7.45e-01 | 0.2243 |
| 124402 | UBALD1 | S028 | Human | Liver | HCC | 6.61e-10 | 7.14e-01 | 0.2503 |
| 124402 | UBALD1 | S029 | Human | Liver | HCC | 6.05e-09 | 7.37e-01 | 0.2581 |
| 124402 | UBALD1 | C04 | Human | Oral cavity | OSCC | 7.38e-22 | 8.64e-01 | 0.2633 |
| 124402 | UBALD1 | C21 | Human | Oral cavity | OSCC | 5.88e-21 | 6.81e-01 | 0.2678 |
| 124402 | UBALD1 | C30 | Human | Oral cavity | OSCC | 3.87e-23 | 1.11e+00 | 0.3055 |
| 124402 | UBALD1 | C38 | Human | Oral cavity | OSCC | 1.26e-11 | 1.22e+00 | 0.172 |
| 124402 | UBALD1 | C43 | Human | Oral cavity | OSCC | 1.88e-08 | 2.67e-01 | 0.1704 |
| 124402 | UBALD1 | C46 | Human | Oral cavity | OSCC | 2.12e-25 | 5.84e-01 | 0.1673 |
| 124402 | UBALD1 | C51 | Human | Oral cavity | OSCC | 2.19e-02 | 2.54e-01 | 0.2674 |
| Page: 1 2 3 4 5 |
| Tissue | Expression Dynamics | Abbreviation |
| Esophagus | 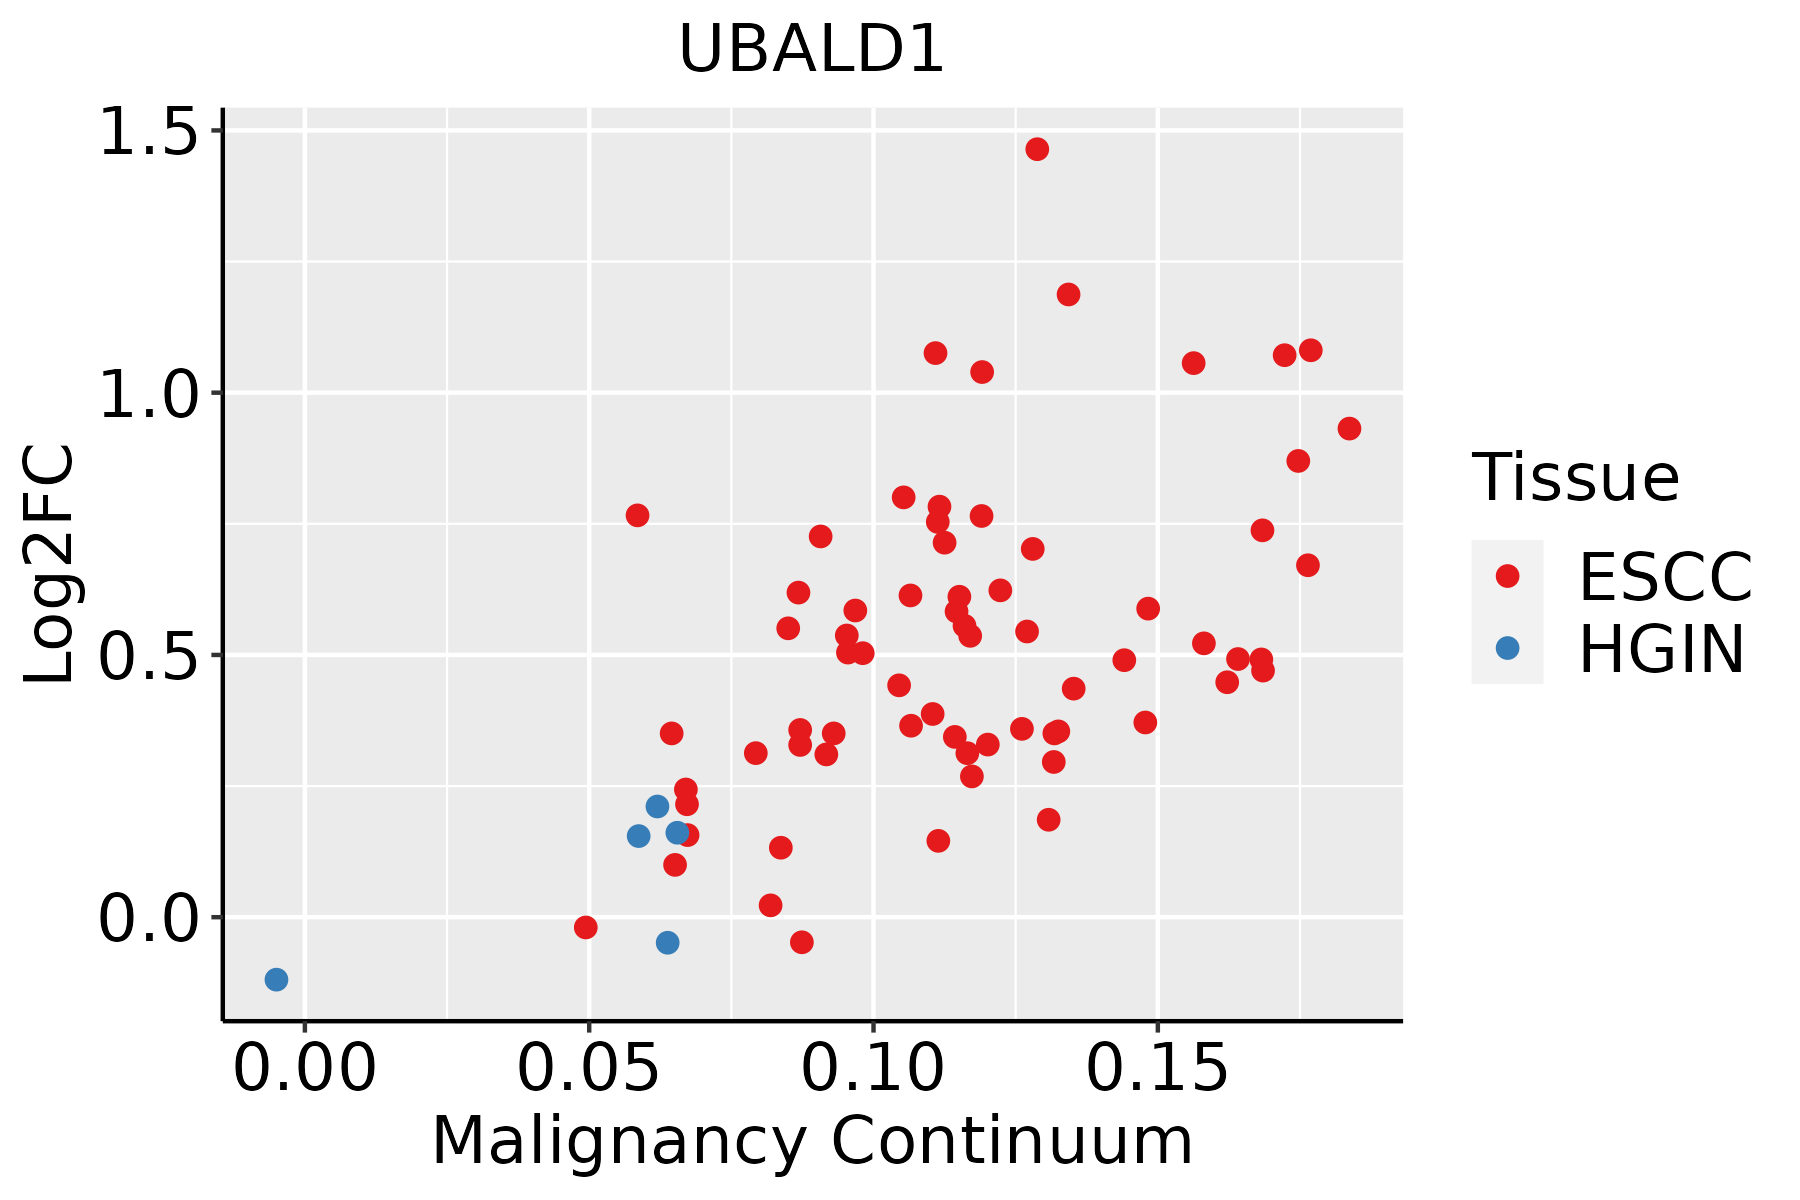 | ESCC: Esophageal squamous cell carcinoma |
| HGIN: High-grade intraepithelial neoplasias | ||
| LGIN: Low-grade intraepithelial neoplasias | ||
| Liver |  | HCC: Hepatocellular carcinoma |
| NAFLD: Non-alcoholic fatty liver disease | ||
| Oral Cavity | 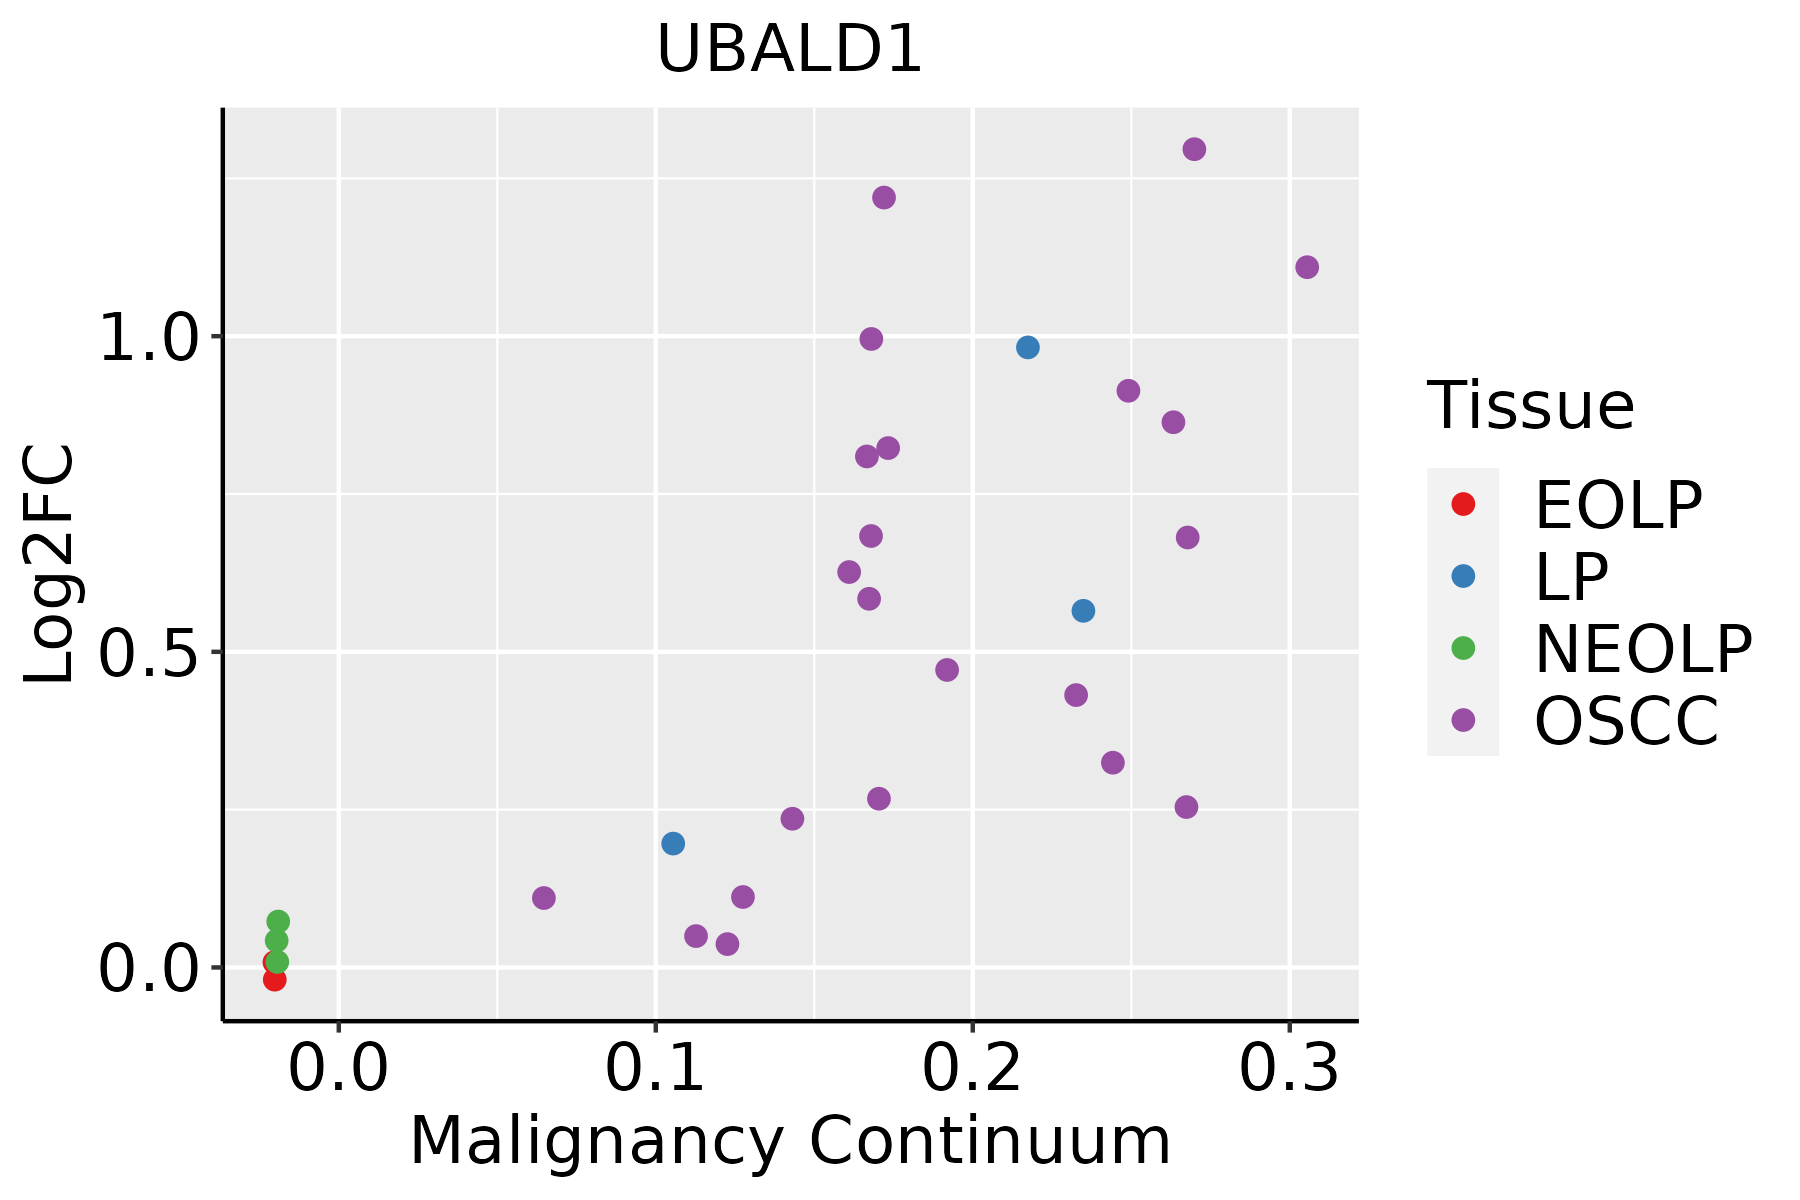 | EOLP: Erosive Oral lichen planus |
| LP: leukoplakia | ||
| NEOLP: Non-erosive oral lichen planus | ||
| OSCC: Oral squamous cell carcinoma |
| ∗log2FC in expression of this searched gene in stem-like cells from each diseased tissue sample relative to stem-like cells in normal samples in each tissue plotted against the malignancy continuum. Samples are colored based on if they are from different disease stage. |
Top |
Malignant transformation related pathway analysis |
| Find out the enriched GO biological processes and KEGG pathways involved in transition from healthy to precancer to cancer |
| Tissue | Disease Stage | Enriched GO biological Processes |
| Colorectum | AD |  |
| Colorectum | SER |  |
| Colorectum | MSS |  |
| Colorectum | MSI-H |  |
| Colorectum | FAP |  |
| ∗Top 15 enriched GO BP terms are showed in the bar plot of each disease state in each tissue. Each row represents a significant GO biological process which is colored according to the -log10(p.adjust). |
| Page: 1 2 3 4 5 6 7 8 9 |
| GO ID | Tissue | Disease Stage | Description | Gene Ratio | Bg Ratio | pvalue | p.adjust | Count |
| Page: 1 |
| Pathway ID | Tissue | Disease Stage | Description | Gene Ratio | Bg Ratio | pvalue | p.adjust | qvalue | Count |
| Page: 1 |
Top |
Cell-cell communication analysis |
| Identification of potential cell-cell interactions between two cell types and their ligand-receptor pairs for different disease states |
| Ligand | Receptor | LRpair | Pathway | Tissue | Disease Stage |
| Page: 1 |
Top |
Single-cell gene regulatory network inference analysis |
| Find out the significant the regulons (TFs) and the target genes of each regulon across cell types for different disease states |
| TF | Cell Type | Tissue | Disease Stage | Target Gene | RSS | Regulon Activity |
| ∗The dot plots of a searched regulon are shown for all cell subpopulations in each disease state of each tissue based on the regulon specific score inferred using pySCENIC and by calculating the average expression. |
| Page: 1 |
Top |
Somatic mutation of malignant transformation related genes |
| Annotation of somatic variants for genes involved in malignant transformation |
| Hugo Symbol | Variant Class | Variant Classification | dbSNP RS | HGVSc | HGVSp | HGVSp Short | SWISSPROT | BIOTYPE | SIFT | PolyPhen | Tumor Sample Barcode | Tissue | Histology | Sex | Age | Stage | Therapy Types | Drugs | Outcome |
| UBALD1 | insertion | Frame_Shift_Ins | novel | c.125_126insGA | p.Leu43ThrfsTer20 | p.L43Tfs*20 | Q8TB05 | protein_coding | TCGA-AQ-A04J-01 | Breast | breast invasive carcinoma | Female | <65 | I/II | Chemotherapy | cytoxan | SD | ||
| UBALD1 | insertion | Frame_Shift_Ins | novel | c.124_125insGCGGGGCT | p.Ala42GlyfsTer23 | p.A42Gfs*23 | Q8TB05 | protein_coding | TCGA-AQ-A04J-01 | Breast | breast invasive carcinoma | Female | <65 | I/II | Chemotherapy | cytoxan | SD | ||
| UBALD1 | SNV | Missense_Mutation | c.475N>C | p.Ala159Pro | p.A159P | Q8TB05 | protein_coding | deleterious_low_confidence(0.01) | benign(0.005) | TCGA-BS-A0TJ-01 | Endometrium | uterine corpus endometrioid carcinoma | Female | <65 | I/II | Unknown | Unknown | SD | |
| UBALD1 | SNV | Missense_Mutation | novel | c.5N>G | p.Ser2Cys | p.S2C | Q8TB05 | protein_coding | deleterious(0) | probably_damaging(0.994) | TCGA-55-7910-01 | Lung | lung adenocarcinoma | Female | <65 | I/II | Chemotherapy | cisplatin | PD |
| UBALD1 | deletion | Frame_Shift_Del | novel | c.140delT | p.Phe47SerfsTer15 | p.F47Sfs*15 | Q8TB05 | protein_coding | TCGA-BR-8591-01 | Stomach | stomach adenocarcinoma | Male | >=65 | III/IV | Unknown | Unknown | SD |
| Page: 1 |
Top |
Related drugs of malignant transformation related genes |
| Identification of chemicals and drugs interact with genes involved in malignant transfromation |
| (DGIdb 4.0) |
| Entrez ID | Symbol | Category | Interaction Types | Drug Claim Name | Drug Name | PMIDs |
| Page: 1 |

Copyright 2023-Present -The University of Texas Health Science Center at Houston |