
|
|||||
|
 | |
| |
| |
| |
| |
| |
|
Gene: TYROBP |
Gene summary for TYROBP |
| Gene information | Species | Human | Gene symbol | TYROBP | Gene ID | 7305 |
| Gene name | transmembrane immune signaling adaptor TYROBP | |
| Gene Alias | DAP12 | |
| Cytomap | 19q13.12 | |
| Gene Type | protein-coding | GO ID | GO:0000768 | UniProtAcc | O43914 |
Top |
Malignant transformation analysis |
| Identification of the aberrant gene expression in precancerous and cancerous lesions by comparing the gene expression of stem-like cells in diseased tissues with normal stem cells |
| Entrez ID | Symbol | Replicates | Species | Organ | Tissue | Adj P-value | Log2FC | Malignancy |
| 7305 | TYROBP | PTCwithHT_8 | Human | Thyroid | HT | 7.89e-26 | 1.11e+00 | 0.0351 |
| 7305 | TYROBP | PTCwithoutHT_2 | Human | Thyroid | PTC | 1.45e-02 | 3.24e-01 | 0.0419 |
| 7305 | TYROBP | PTCwithoutHT_7 | Human | Thyroid | PTC | 4.68e-08 | 7.28e-01 | 0.0381 |
| 7305 | TYROBP | PTC05 | Human | Thyroid | PTC | 2.87e-07 | 2.86e-01 | 0.2065 |
| 7305 | TYROBP | PTC06 | Human | Thyroid | PTC | 4.17e-03 | 2.21e-01 | 0.2057 |
| 7305 | TYROBP | PTC07 | Human | Thyroid | PTC | 5.71e-10 | 1.58e-01 | 0.2044 |
| 7305 | TYROBP | ATC12 | Human | Thyroid | ATC | 1.99e-02 | 1.16e-01 | 0.34 |
| 7305 | TYROBP | ATC13 | Human | Thyroid | ATC | 4.82e-02 | 4.87e-02 | 0.34 |
| 7305 | TYROBP | ATC3 | Human | Thyroid | ATC | 6.43e-04 | 2.39e-01 | 0.338 |
| 7305 | TYROBP | ATC4 | Human | Thyroid | ATC | 3.76e-06 | 1.49e-01 | 0.34 |
| Page: 1 2 3 4 |
| Tissue | Expression Dynamics | Abbreviation |
| Breast | 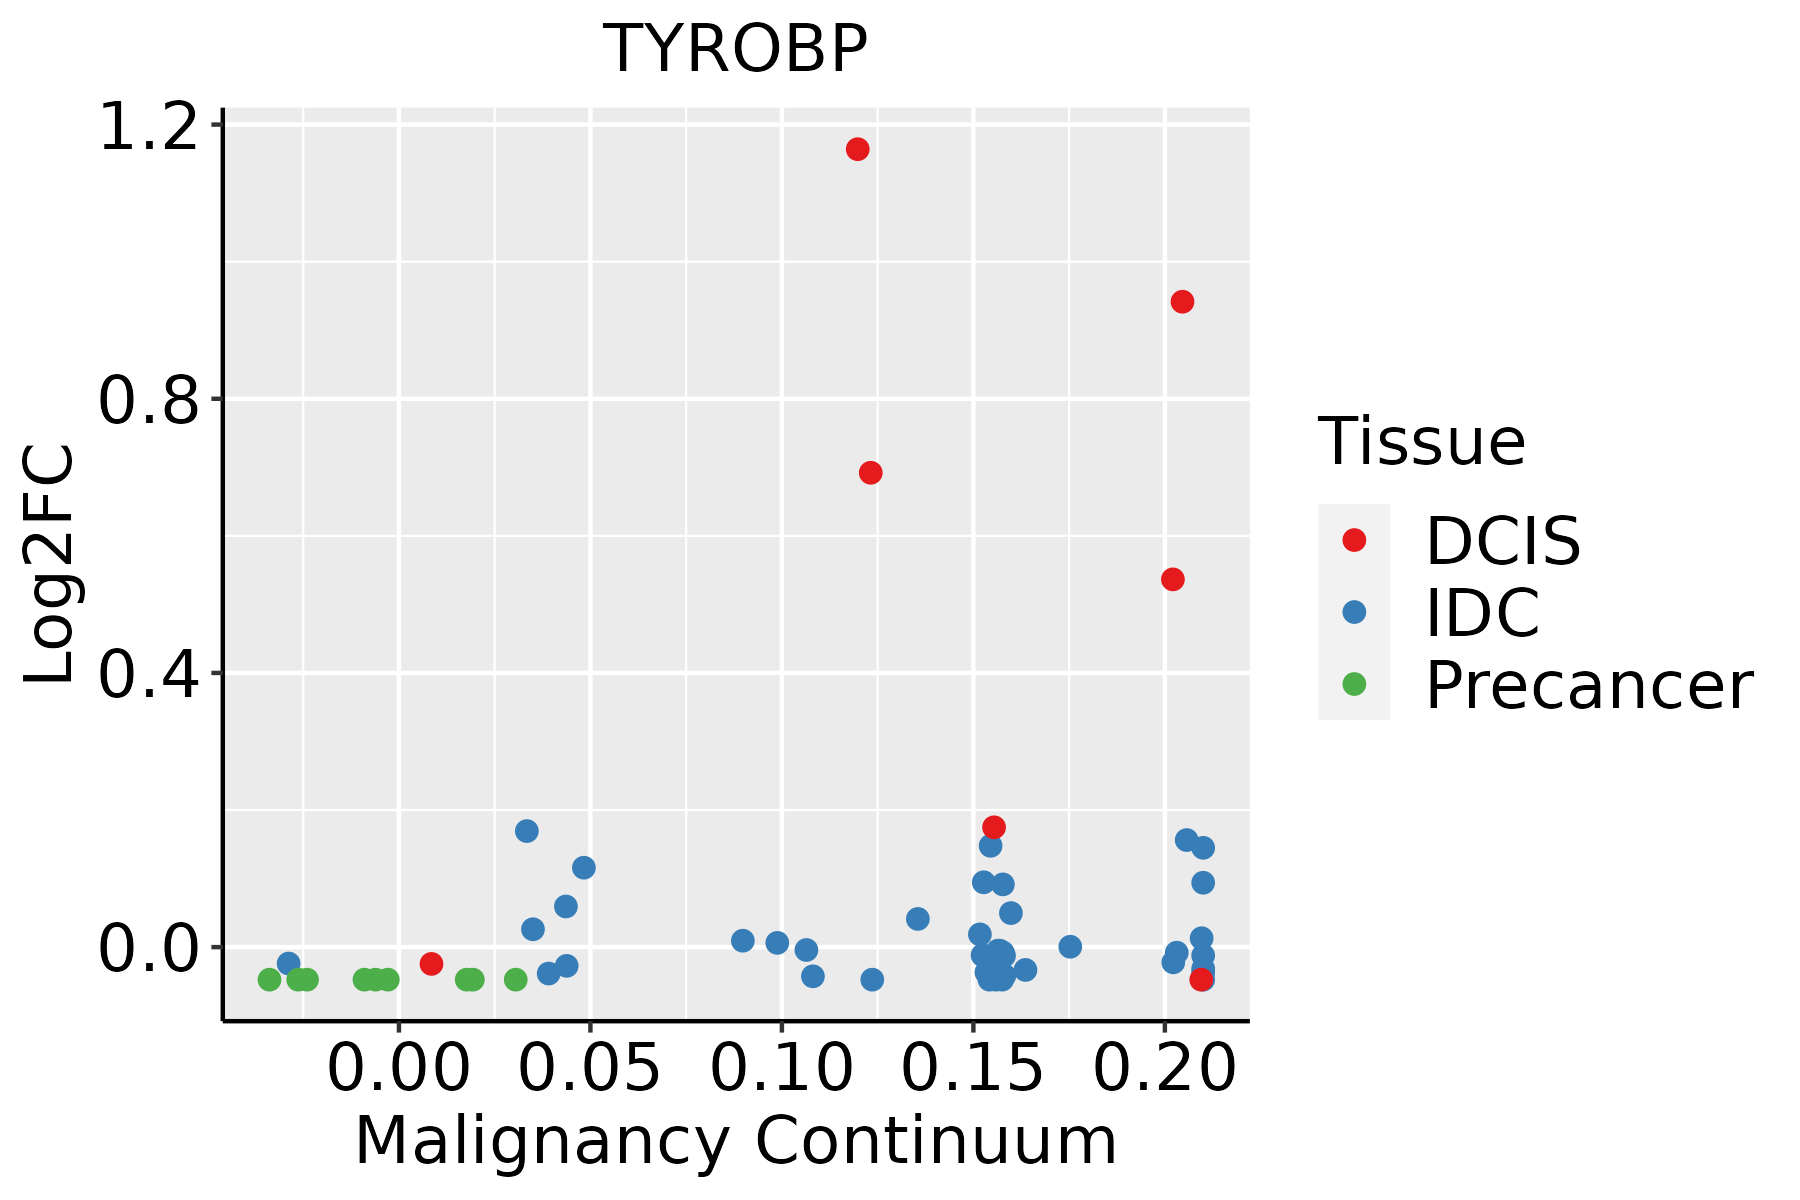 | IDC: Invasive ductal carcinoma |
| DCIS: Ductal carcinoma in situ | ||
| Precancer(BRCA1-mut): Precancerous lesion from BRCA1 mutation carriers | ||
| Cervix |  | CC: Cervix cancer |
| HSIL_HPV: HPV-infected high-grade squamous intraepithelial lesions | ||
| N_HPV: HPV-infected normal cervix | ||
| Liver | 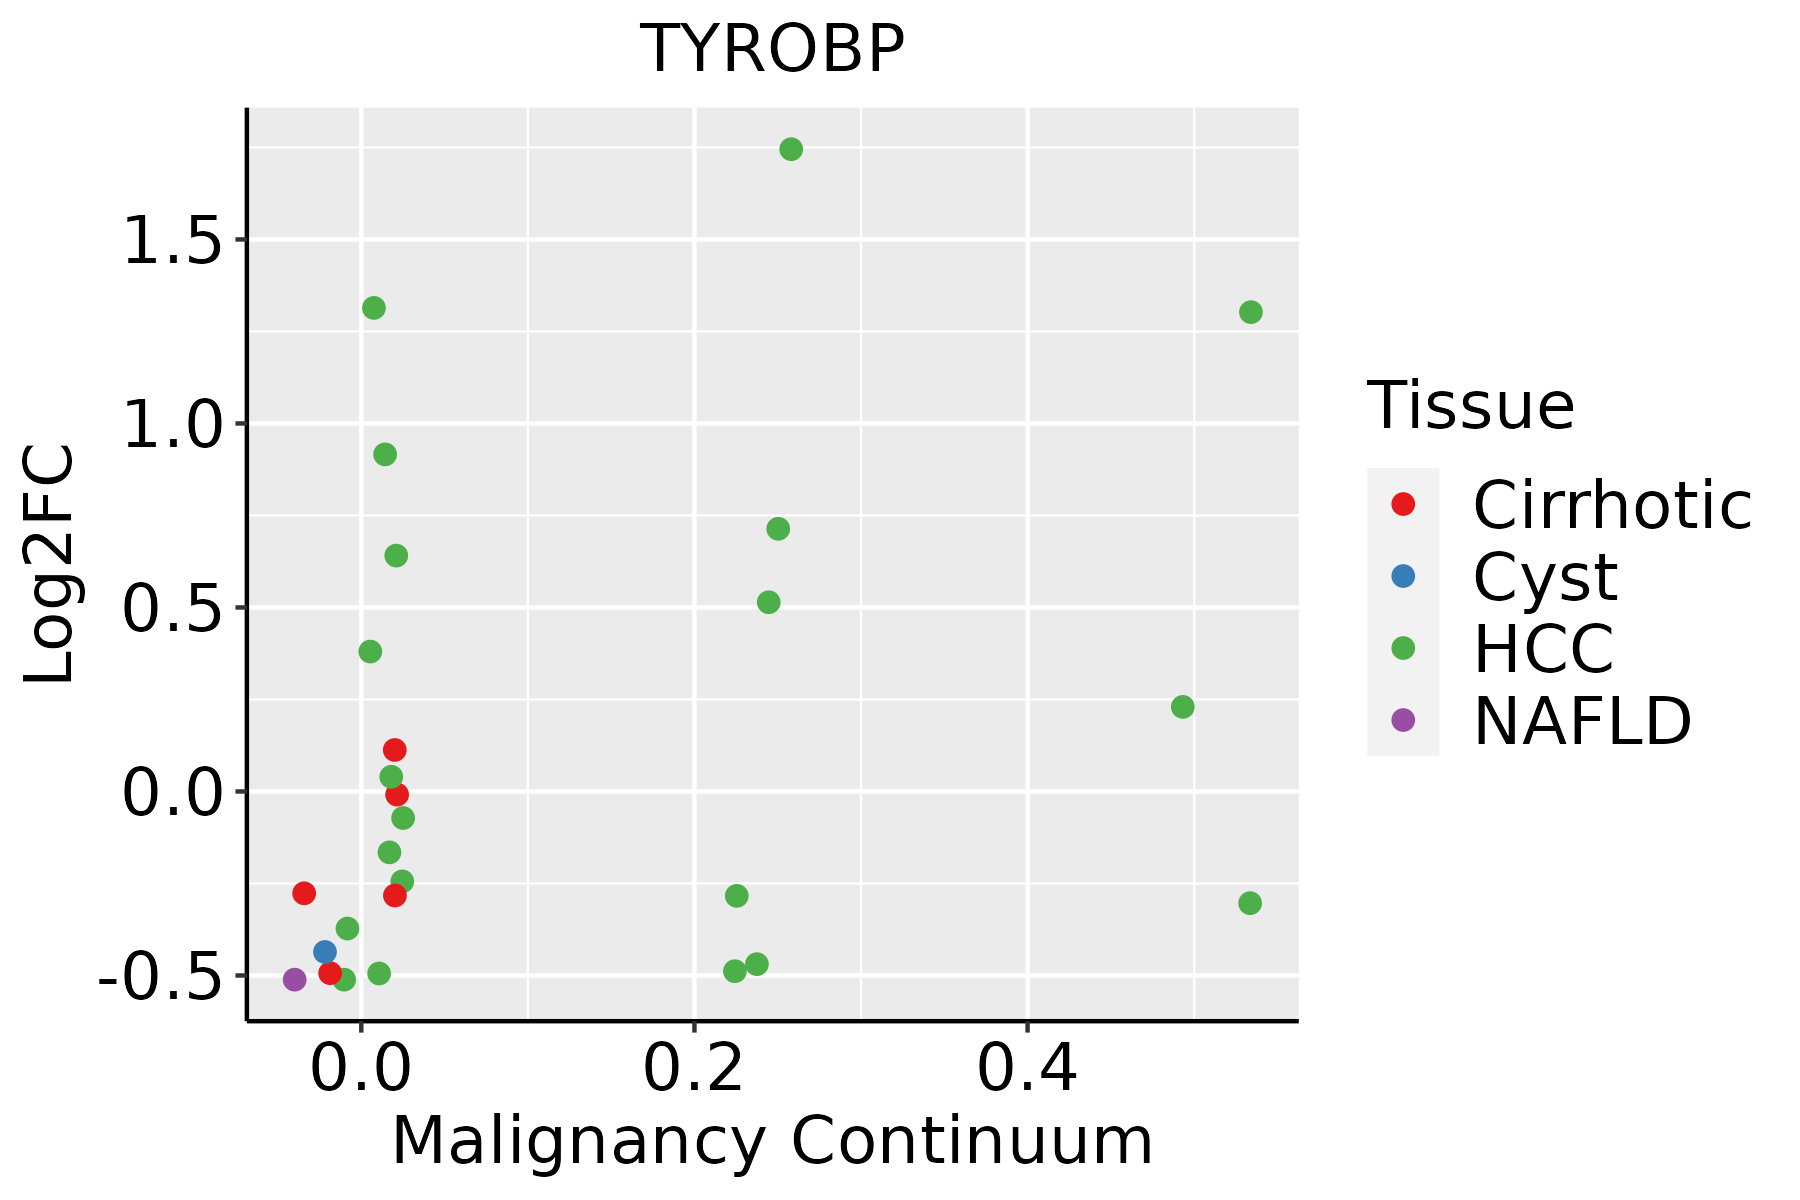 | HCC: Hepatocellular carcinoma |
| NAFLD: Non-alcoholic fatty liver disease | ||
| Oral Cavity |  | EOLP: Erosive Oral lichen planus |
| LP: leukoplakia | ||
| NEOLP: Non-erosive oral lichen planus | ||
| OSCC: Oral squamous cell carcinoma | ||
| Skin | 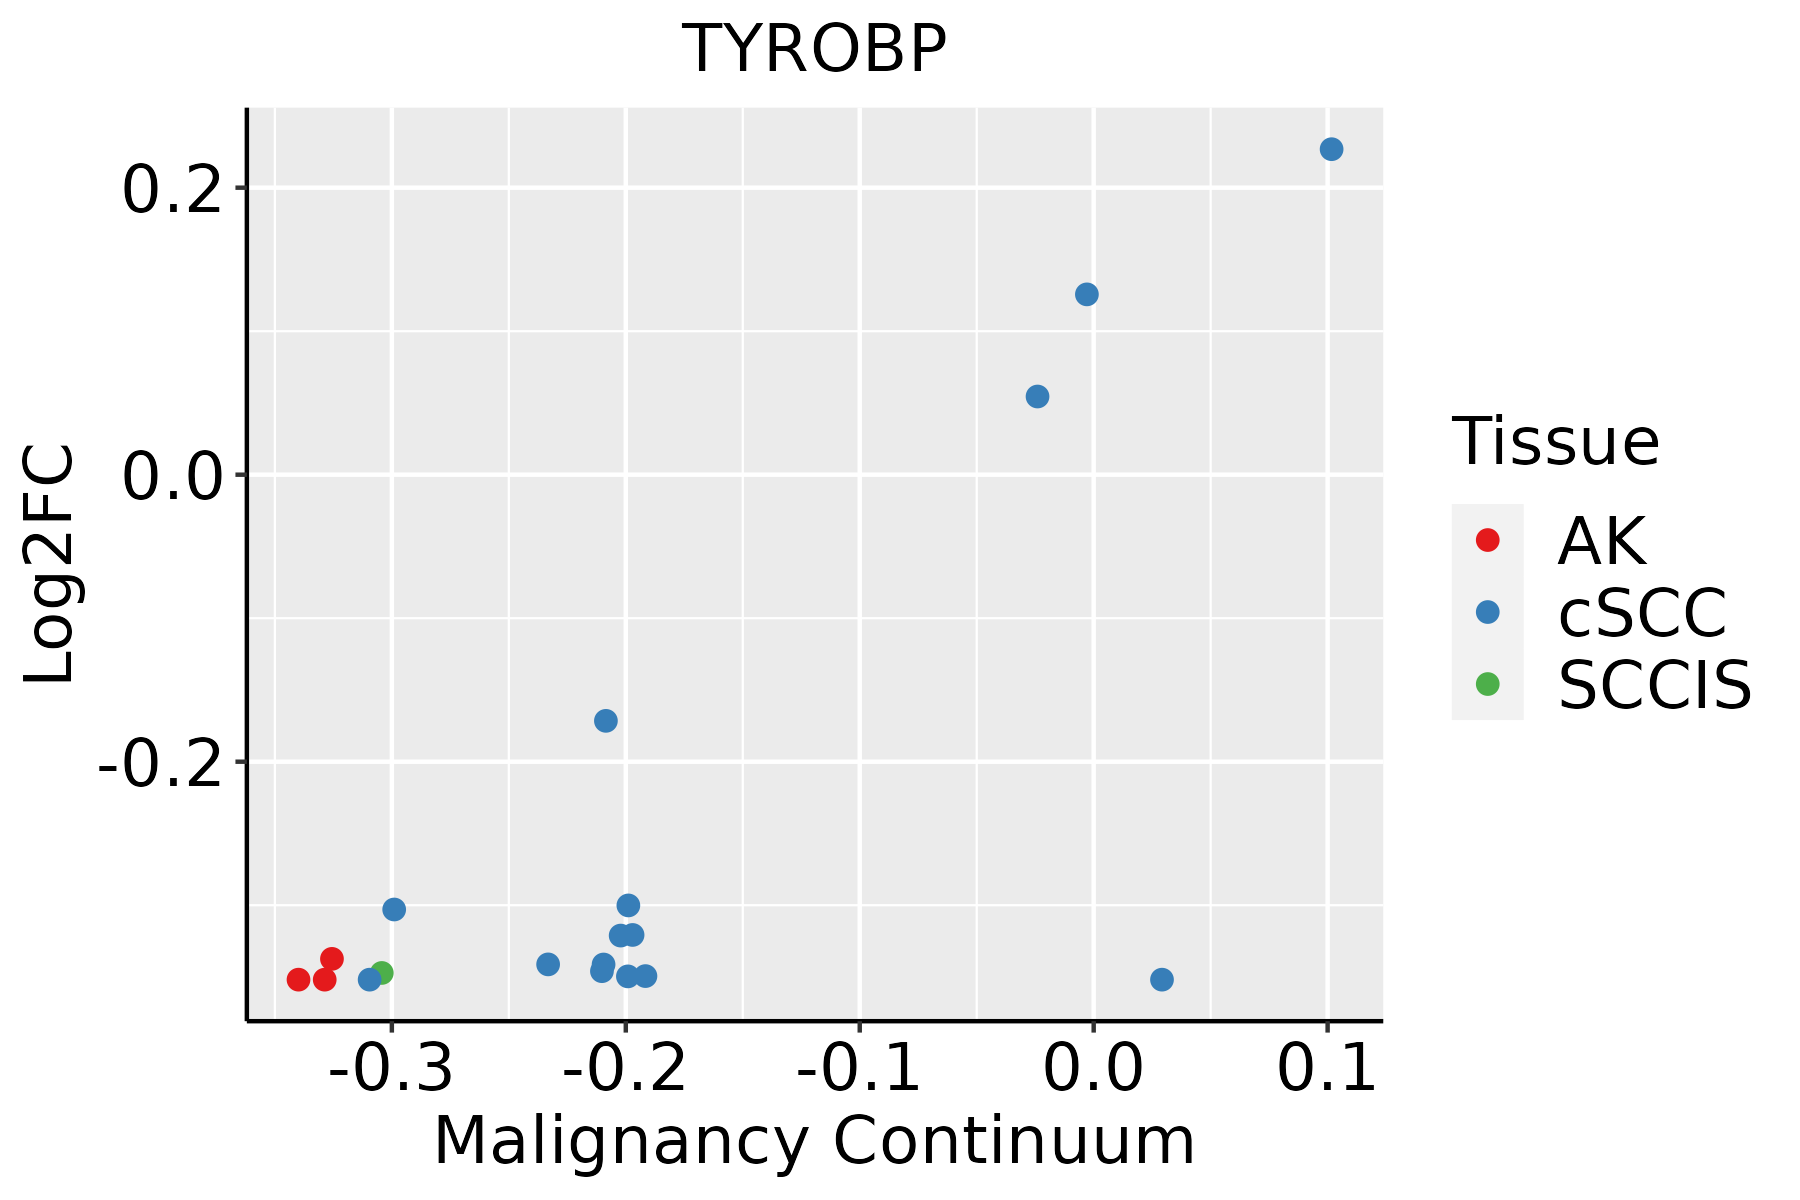 | AK: Actinic keratosis |
| cSCC: Cutaneous squamous cell carcinoma | ||
| SCCIS:squamous cell carcinoma in situ | ||
| Thyroid | 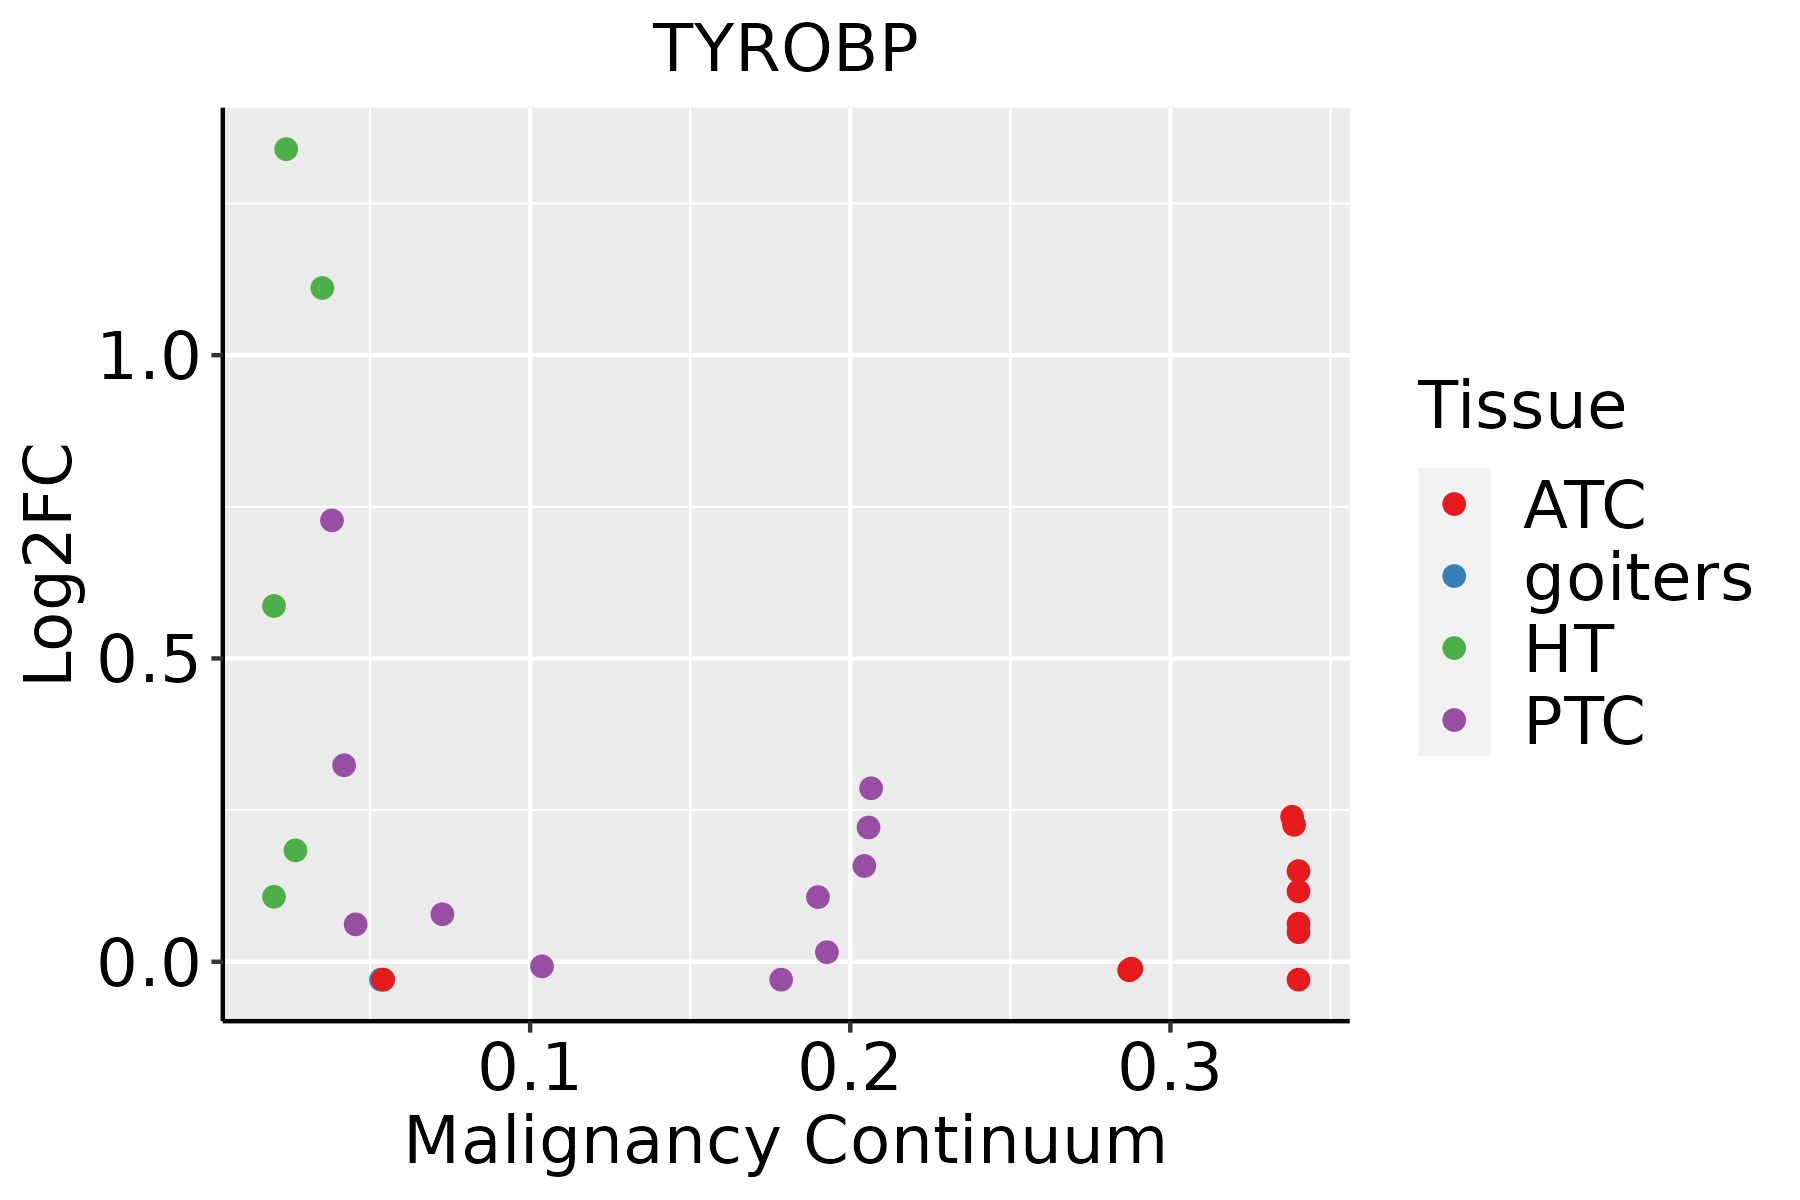 | ATC: Anaplastic thyroid cancer |
| HT: Hashimoto's thyroiditis | ||
| PTC: Papillary thyroid cancer |
| ∗log2FC in expression of this searched gene in stem-like cells from each diseased tissue sample relative to stem-like cells in normal samples in each tissue plotted against the malignancy continuum. Samples are colored based on if they are from different disease stage. |
Top |
Malignant transformation related pathway analysis |
| Find out the enriched GO biological processes and KEGG pathways involved in transition from healthy to precancer to cancer |
| Tissue | Disease Stage | Enriched GO biological Processes |
| Colorectum | AD |  |
| Colorectum | SER |  |
| Colorectum | MSS |  |
| Colorectum | MSI-H |  |
| Colorectum | FAP |  |
| ∗Top 15 enriched GO BP terms are showed in the bar plot of each disease state in each tissue. Each row represents a significant GO biological process which is colored according to the -log10(p.adjust). |
| Page: 1 2 3 4 5 6 7 8 9 |
| GO ID | Tissue | Disease Stage | Description | Gene Ratio | Bg Ratio | pvalue | p.adjust | Count |
| GO:003164724 | Breast | DCIS | regulation of protein stability | 51/1390 | 298/18723 | 1.63e-08 | 1.15e-06 | 51 |
| GO:007099724 | Breast | DCIS | neuron death | 57/1390 | 361/18723 | 4.56e-08 | 2.84e-06 | 57 |
| GO:005140222 | Breast | DCIS | neuron apoptotic process | 43/1390 | 246/18723 | 1.16e-07 | 6.13e-06 | 43 |
| GO:005082124 | Breast | DCIS | protein stabilization | 36/1390 | 191/18723 | 1.82e-07 | 9.14e-06 | 36 |
| GO:003009924 | Breast | DCIS | myeloid cell differentiation | 55/1390 | 381/18723 | 1.50e-06 | 5.68e-05 | 55 |
| GO:190121421 | Breast | DCIS | regulation of neuron death | 48/1390 | 319/18723 | 2.13e-06 | 7.79e-05 | 48 |
| GO:004352321 | Breast | DCIS | regulation of neuron apoptotic process | 36/1390 | 212/18723 | 2.45e-06 | 8.68e-05 | 36 |
| GO:000181921 | Breast | DCIS | positive regulation of cytokine production | 63/1390 | 467/18723 | 2.76e-06 | 9.42e-05 | 63 |
| GO:000257321 | Breast | DCIS | myeloid leukocyte differentiation | 34/1390 | 208/18723 | 1.08e-05 | 2.83e-04 | 34 |
| GO:004563722 | Breast | DCIS | regulation of myeloid cell differentiation | 34/1390 | 210/18723 | 1.33e-05 | 3.32e-04 | 34 |
| GO:007259322 | Breast | DCIS | reactive oxygen species metabolic process | 37/1390 | 239/18723 | 1.60e-05 | 3.88e-04 | 37 |
| GO:000268321 | Breast | DCIS | negative regulation of immune system process | 57/1390 | 434/18723 | 1.81e-05 | 4.35e-04 | 57 |
| GO:190370622 | Breast | DCIS | regulation of hemopoiesis | 50/1390 | 367/18723 | 2.21e-05 | 5.23e-04 | 50 |
| GO:190121622 | Breast | DCIS | positive regulation of neuron death | 20/1390 | 97/18723 | 2.45e-05 | 5.68e-04 | 20 |
| GO:003210321 | Breast | DCIS | positive regulation of response to external stimulus | 54/1390 | 427/18723 | 8.34e-05 | 1.58e-03 | 54 |
| GO:004563921 | Breast | DCIS | positive regulation of myeloid cell differentiation | 19/1390 | 103/18723 | 1.86e-04 | 3.03e-03 | 19 |
| GO:00313492 | Breast | DCIS | positive regulation of defense response | 38/1390 | 278/18723 | 1.91e-04 | 3.08e-03 | 38 |
| GO:004352521 | Breast | DCIS | positive regulation of neuron apoptotic process | 13/1390 | 58/18723 | 2.65e-04 | 4.03e-03 | 13 |
| GO:190382924 | Breast | DCIS | positive regulation of cellular protein localization | 37/1390 | 276/18723 | 3.40e-04 | 4.87e-03 | 37 |
| GO:200037922 | Breast | DCIS | positive regulation of reactive oxygen species metabolic process | 15/1390 | 76/18723 | 4.06e-04 | 5.54e-03 | 15 |
| Page: 1 2 3 4 5 6 7 8 9 10 11 12 13 14 15 16 17 18 19 20 21 22 23 24 25 26 27 28 29 30 31 32 33 |
| Pathway ID | Tissue | Disease Stage | Description | Gene Ratio | Bg Ratio | pvalue | p.adjust | qvalue | Count |
| hsa043806 | Oral cavity | OSCC | Osteoclast differentiation | 73/3704 | 128/8465 | 1.60e-03 | 4.44e-03 | 2.26e-03 | 73 |
| hsa0438011 | Oral cavity | OSCC | Osteoclast differentiation | 73/3704 | 128/8465 | 1.60e-03 | 4.44e-03 | 2.26e-03 | 73 |
| hsa04650 | Oral cavity | EOLP | Natural killer cell mediated cytotoxicity | 38/1218 | 132/8465 | 1.26e-05 | 7.01e-05 | 4.13e-05 | 38 |
| hsa046501 | Oral cavity | EOLP | Natural killer cell mediated cytotoxicity | 38/1218 | 132/8465 | 1.26e-05 | 7.01e-05 | 4.13e-05 | 38 |
| hsa043804 | Oral cavity | NEOLP | Osteoclast differentiation | 31/1112 | 128/8465 | 4.35e-04 | 2.60e-03 | 1.63e-03 | 31 |
| hsa043805 | Oral cavity | NEOLP | Osteoclast differentiation | 31/1112 | 128/8465 | 4.35e-04 | 2.60e-03 | 1.63e-03 | 31 |
| Page: 1 |
Top |
Cell-cell communication analysis |
| Identification of potential cell-cell interactions between two cell types and their ligand-receptor pairs for different disease states |
| Ligand | Receptor | LRpair | Pathway | Tissue | Disease Stage |
| Page: 1 |
Top |
Single-cell gene regulatory network inference analysis |
| Find out the significant the regulons (TFs) and the target genes of each regulon across cell types for different disease states |
| TF | Cell Type | Tissue | Disease Stage | Target Gene | RSS | Regulon Activity |
| ∗The dot plots of a searched regulon are shown for all cell subpopulations in each disease state of each tissue based on the regulon specific score inferred using pySCENIC and by calculating the average expression. |
| Page: 1 |
Top |
Somatic mutation of malignant transformation related genes |
| Annotation of somatic variants for genes involved in malignant transformation |
| Hugo Symbol | Variant Class | Variant Classification | dbSNP RS | HGVSc | HGVSp | HGVSp Short | SWISSPROT | BIOTYPE | SIFT | PolyPhen | Tumor Sample Barcode | Tissue | Histology | Sex | Age | Stage | Therapy Types | Drugs | Outcome |
| TYROBP | SNV | Missense_Mutation | rs780898439 | c.79N>A | p.Ala27Thr | p.A27T | O43914 | protein_coding | deleterious(0.02) | benign(0.275) | TCGA-2W-A8YY-01 | Cervix | cervical & endocervical cancer | Female | <65 | I/II | Chemotherapy | cisplatin | CR |
| TYROBP | SNV | Missense_Mutation | c.226N>A | p.Glu76Lys | p.E76K | O43914 | protein_coding | tolerated(0.41) | benign(0.124) | TCGA-LP-A7HU-01 | Cervix | cervical & endocervical cancer | Female | <65 | I/II | Unknown | Unknown | SD | |
| TYROBP | SNV | Missense_Mutation | novel | c.148G>T | p.Asp50Tyr | p.D50Y | O43914 | protein_coding | deleterious(0) | probably_damaging(0.999) | TCGA-AA-3984-01 | Colorectum | colon adenocarcinoma | Female | <65 | I/II | Unknown | Unknown | SD |
| TYROBP | SNV | Missense_Mutation | c.85N>A | p.Ala29Thr | p.A29T | O43914 | protein_coding | tolerated(0.37) | benign(0.139) | TCGA-B5-A11J-01 | Endometrium | uterine corpus endometrioid carcinoma | Female | <65 | I/II | Unknown | Unknown | SD | |
| TYROBP | SNV | Missense_Mutation | c.248N>C | p.Arg83Pro | p.R83P | O43914 | protein_coding | tolerated(0.25) | benign(0.011) | TCGA-97-A4M7-01 | Lung | lung adenocarcinoma | Male | >=65 | I/II | Unknown | Unknown | SD | |
| TYROBP | SNV | Missense_Mutation | c.104N>T | p.Cys35Phe | p.C35F | O43914 | protein_coding | deleterious(0) | probably_damaging(0.997) | TCGA-18-3411-01 | Lung | lung squamous cell carcinoma | Female | <65 | III/IV | Unknown | Unknown | SD | |
| TYROBP | SNV | Missense_Mutation | c.252C>G | p.Ile84Met | p.I84M | O43914 | protein_coding | tolerated(0.36) | benign(0.013) | TCGA-39-5022-01 | Lung | lung squamous cell carcinoma | Male | >=65 | I/II | Unknown | Unknown | PD | |
| TYROBP | SNV | Missense_Mutation | novel | c.221C>A | p.Ala74Asp | p.A74D | O43914 | protein_coding | tolerated(0.29) | possibly_damaging(0.59) | TCGA-52-7812-01 | Lung | lung squamous cell carcinoma | Male | >=65 | I/II | Chemotherapy | paclitaxel | PD |
| TYROBP | SNV | Missense_Mutation | rs150310136 | c.233C>T | p.Ala78Val | p.A78V | O43914 | protein_coding | tolerated(0.3) | benign(0.001) | TCGA-BR-8366-01 | Stomach | stomach adenocarcinoma | Female | >=65 | I/II | Unknown | Unknown | SD |
| TYROBP | deletion | Frame_Shift_Del | novel | c.8delN | p.Gly3AspfsTer17 | p.G3Dfs*17 | O43914 | protein_coding | TCGA-CG-4306-01 | Stomach | stomach adenocarcinoma | Male | >=65 | III/IV | Unknown | Unknown | SD |
| Page: 1 |
Top |
Related drugs of malignant transformation related genes |
| Identification of chemicals and drugs interact with genes involved in malignant transfromation |
| (DGIdb 4.0) |
| Entrez ID | Symbol | Category | Interaction Types | Drug Claim Name | Drug Name | PMIDs |
| Page: 1 |

Copyright 2023-Present -The University of Texas Health Science Center at Houston |