
|
|||||
|
 | |
| |
| |
| |
| |
| |
|
Gene: TRIM69 |
Gene summary for TRIM69 |
| Gene information | Species | Human | Gene symbol | TRIM69 | Gene ID | 140691 |
| Gene name | tripartite motif containing 69 | |
| Gene Alias | HSD-34 | |
| Cytomap | 15q21.1 | |
| Gene Type | protein-coding | GO ID | GO:0006464 | UniProtAcc | Q86WT6 |
Top |
Malignant transformation analysis |
| Identification of the aberrant gene expression in precancerous and cancerous lesions by comparing the gene expression of stem-like cells in diseased tissues with normal stem cells |
| Entrez ID | Symbol | Replicates | Species | Organ | Tissue | Adj P-value | Log2FC | Malignancy |
| 140691 | TRIM69 | P128T-E | Human | Esophagus | ESCC | 6.75e-32 | 9.06e-01 | 0.1241 |
| 140691 | TRIM69 | P130T-E | Human | Esophagus | ESCC | 1.13e-26 | 6.89e-01 | 0.1676 |
| 140691 | TRIM69 | C04 | Human | Oral cavity | OSCC | 1.03e-13 | 8.16e-01 | 0.2633 |
| 140691 | TRIM69 | C21 | Human | Oral cavity | OSCC | 7.41e-17 | 7.80e-01 | 0.2678 |
| 140691 | TRIM69 | C30 | Human | Oral cavity | OSCC | 1.97e-35 | 1.87e+00 | 0.3055 |
| 140691 | TRIM69 | C43 | Human | Oral cavity | OSCC | 1.84e-03 | 9.98e-02 | 0.1704 |
| 140691 | TRIM69 | C46 | Human | Oral cavity | OSCC | 1.41e-18 | 6.32e-01 | 0.1673 |
| 140691 | TRIM69 | C51 | Human | Oral cavity | OSCC | 1.69e-04 | 3.74e-01 | 0.2674 |
| 140691 | TRIM69 | C57 | Human | Oral cavity | OSCC | 2.29e-02 | 2.74e-01 | 0.1679 |
| 140691 | TRIM69 | C08 | Human | Oral cavity | OSCC | 2.93e-21 | 7.09e-01 | 0.1919 |
| 140691 | TRIM69 | LN46 | Human | Oral cavity | OSCC | 3.98e-03 | 3.97e-01 | 0.1666 |
| 140691 | TRIM69 | LP17 | Human | Oral cavity | LP | 2.45e-02 | 3.96e-01 | 0.2349 |
| 140691 | TRIM69 | NEOLP-3 | Human | Oral cavity | NEOLP | 6.26e-03 | 2.05e-01 | -0.0191 |
| 140691 | TRIM69 | SYSMH2 | Human | Oral cavity | OSCC | 3.31e-17 | 5.93e-01 | 0.2326 |
| 140691 | TRIM69 | SYSMH3 | Human | Oral cavity | OSCC | 1.28e-07 | 3.84e-01 | 0.2442 |
| 140691 | TRIM69 | SYSMH4 | Human | Oral cavity | OSCC | 3.36e-04 | 3.63e-02 | 0.1226 |
| 140691 | TRIM69 | P5_S10_cSCC | Human | Skin | cSCC | 1.04e-09 | 2.35e-01 | -0.299 |
| 140691 | TRIM69 | P1_cSCC | Human | Skin | cSCC | 1.24e-09 | 3.40e-01 | 0.0292 |
| 140691 | TRIM69 | P2_cSCC | Human | Skin | cSCC | 1.40e-03 | 2.09e-01 | -0.024 |
| 140691 | TRIM69 | P4_cSCC | Human | Skin | cSCC | 1.85e-11 | 3.38e-01 | -0.00290000000000005 |
| Page: 1 2 3 4 5 |
| Tissue | Expression Dynamics | Abbreviation |
| Esophagus | 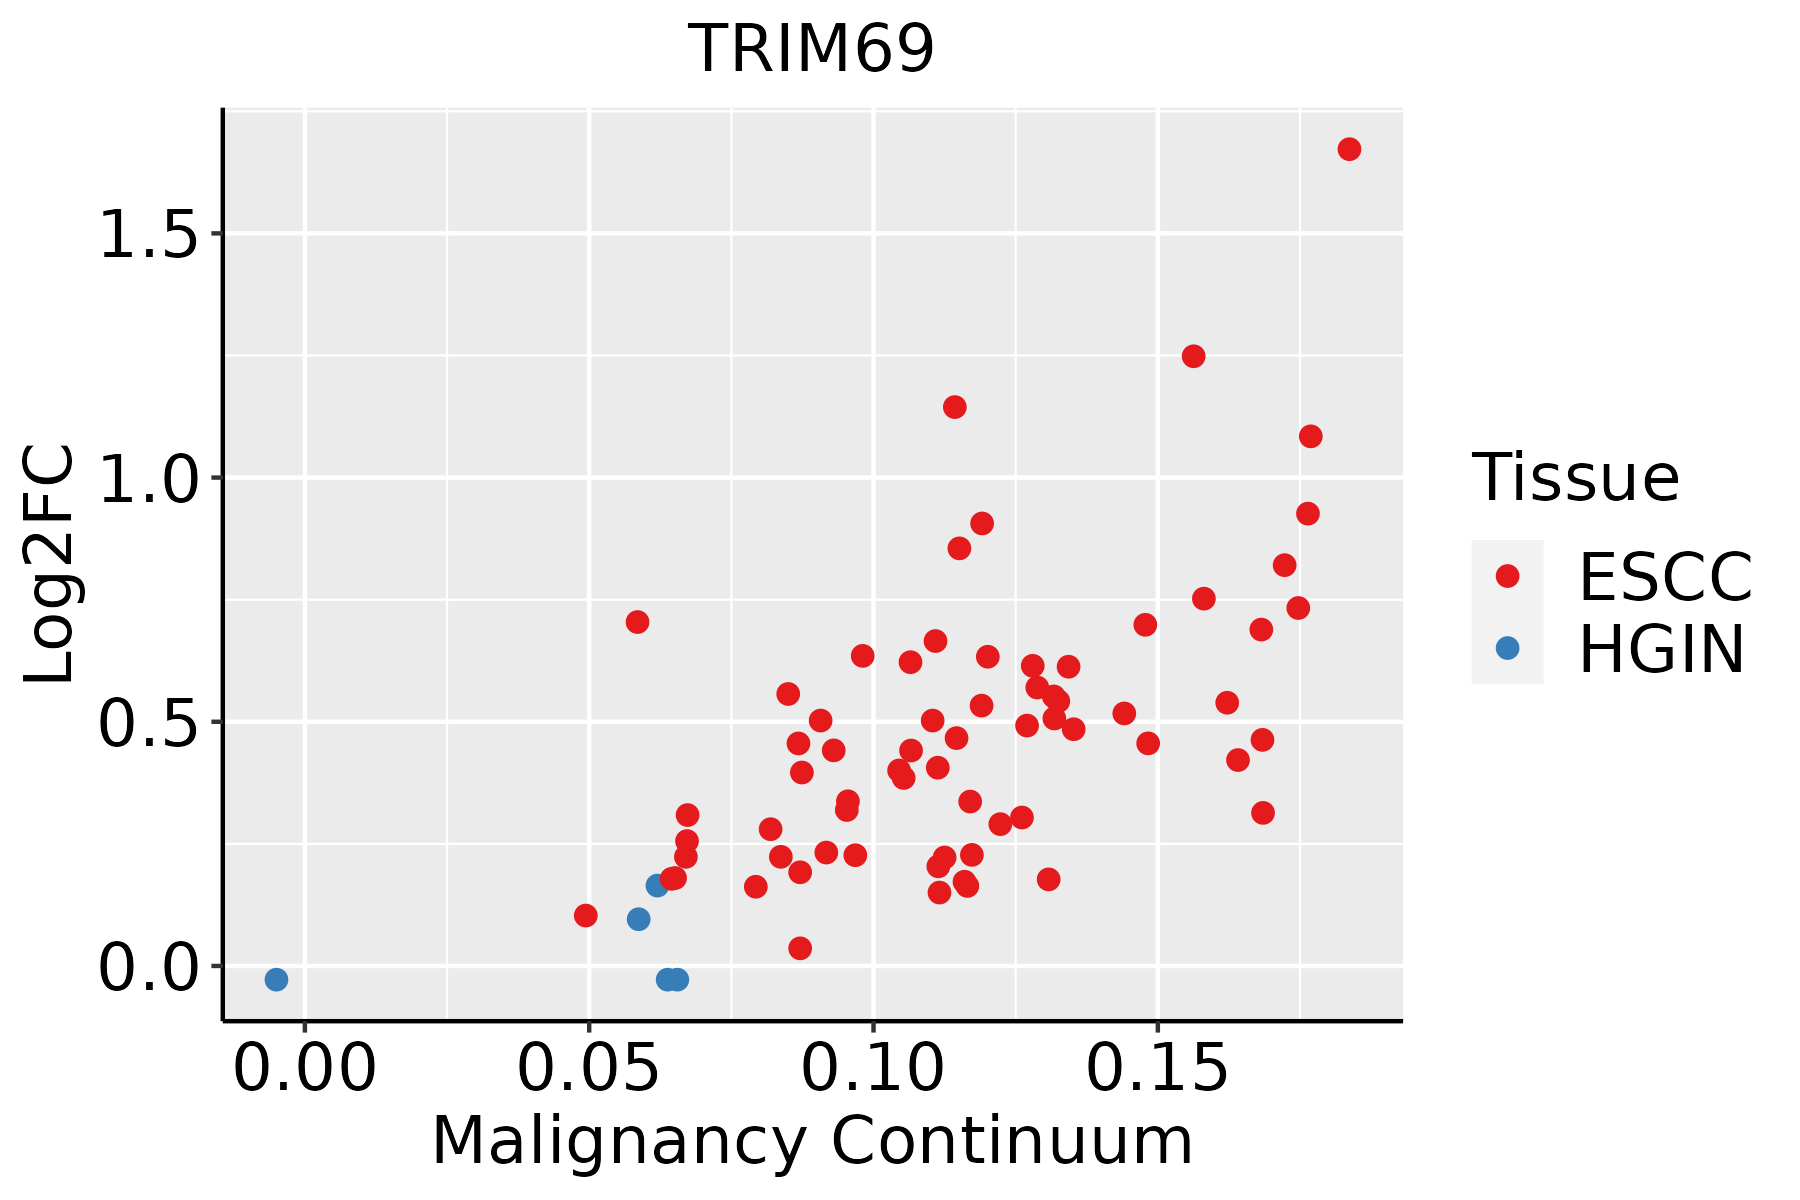 | ESCC: Esophageal squamous cell carcinoma |
| HGIN: High-grade intraepithelial neoplasias | ||
| LGIN: Low-grade intraepithelial neoplasias | ||
| Oral Cavity |  | EOLP: Erosive Oral lichen planus |
| LP: leukoplakia | ||
| NEOLP: Non-erosive oral lichen planus | ||
| OSCC: Oral squamous cell carcinoma | ||
| Skin | 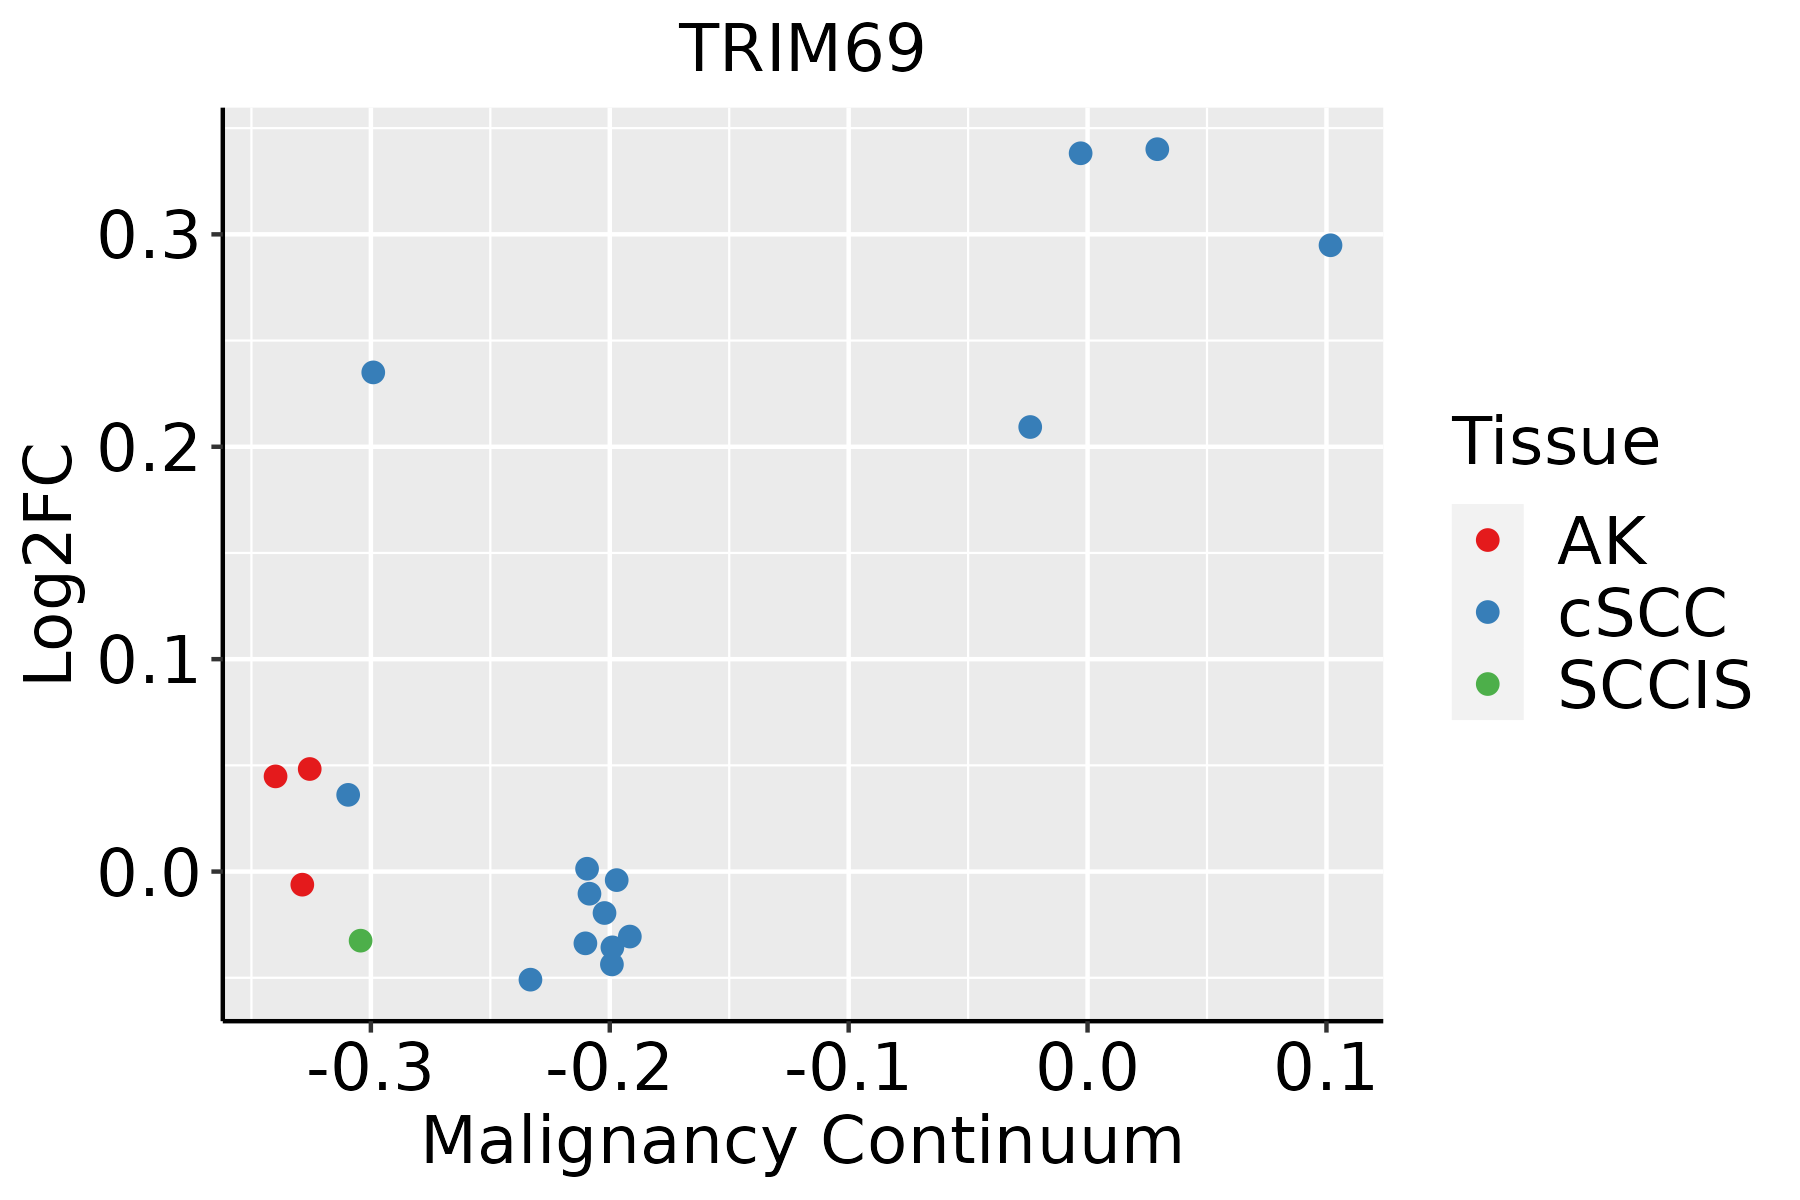 | AK: Actinic keratosis |
| cSCC: Cutaneous squamous cell carcinoma | ||
| SCCIS:squamous cell carcinoma in situ |
| ∗log2FC in expression of this searched gene in stem-like cells from each diseased tissue sample relative to stem-like cells in normal samples in each tissue plotted against the malignancy continuum. Samples are colored based on if they are from different disease stage. |
Top |
Malignant transformation related pathway analysis |
| Find out the enriched GO biological processes and KEGG pathways involved in transition from healthy to precancer to cancer |
| Tissue | Disease Stage | Enriched GO biological Processes |
| Colorectum | AD |  |
| Colorectum | SER |  |
| Colorectum | MSS |  |
| Colorectum | MSI-H |  |
| Colorectum | FAP |  |
| ∗Top 15 enriched GO BP terms are showed in the bar plot of each disease state in each tissue. Each row represents a significant GO biological process which is colored according to the -log10(p.adjust). |
| Page: 1 2 3 4 5 6 7 8 9 |
| GO ID | Tissue | Disease Stage | Description | Gene Ratio | Bg Ratio | pvalue | p.adjust | Count |
| Page: 1 |
| Pathway ID | Tissue | Disease Stage | Description | Gene Ratio | Bg Ratio | pvalue | p.adjust | qvalue | Count |
| Page: 1 |
Top |
Cell-cell communication analysis |
| Identification of potential cell-cell interactions between two cell types and their ligand-receptor pairs for different disease states |
| Ligand | Receptor | LRpair | Pathway | Tissue | Disease Stage |
| Page: 1 |
Top |
Single-cell gene regulatory network inference analysis |
| Find out the significant the regulons (TFs) and the target genes of each regulon across cell types for different disease states |
| TF | Cell Type | Tissue | Disease Stage | Target Gene | RSS | Regulon Activity |
| ∗The dot plots of a searched regulon are shown for all cell subpopulations in each disease state of each tissue based on the regulon specific score inferred using pySCENIC and by calculating the average expression. |
| Page: 1 |
Top |
Somatic mutation of malignant transformation related genes |
| Annotation of somatic variants for genes involved in malignant transformation |
| Hugo Symbol | Variant Class | Variant Classification | dbSNP RS | HGVSc | HGVSp | HGVSp Short | SWISSPROT | BIOTYPE | SIFT | PolyPhen | Tumor Sample Barcode | Tissue | Histology | Sex | Age | Stage | Therapy Types | Drugs | Outcome |
| TRIM69 | insertion | Frame_Shift_Ins | novel | c.332_333insTT | p.His112SerfsTer12 | p.H112Sfs*12 | Q86WT6 | protein_coding | TCGA-AN-A0AK-01 | Breast | breast invasive carcinoma | Female | >=65 | I/II | Unknown | Unknown | SD | ||
| TRIM69 | insertion | In_Frame_Ins | novel | c.333_334insTTTTCTAAAGGTATCCACCAACCCCTCCTCCAA | p.Gly111_His112insPheSerLysGlyIleHisGlnProLeuLeuGln | p.G111_H112insFSKGIHQPLLQ | Q86WT6 | protein_coding | TCGA-AN-A0AK-01 | Breast | breast invasive carcinoma | Female | >=65 | I/II | Unknown | Unknown | SD | ||
| TRIM69 | deletion | Frame_Shift_Del | novel | c.324delN | p.Leu108PhefsTer15 | p.L108Ffs*15 | Q86WT6 | protein_coding | TCGA-D8-A27V-01 | Breast | breast invasive carcinoma | Female | <65 | I/II | Hormone Therapy | tamoxiphen | SD | ||
| TRIM69 | SNV | Missense_Mutation | rs761545728 | c.146N>A | p.Arg49Gln | p.R49Q | Q86WT6 | protein_coding | tolerated(0.21) | benign(0.165) | TCGA-EA-A1QT-01 | Cervix | cervical & endocervical cancer | Female | <65 | I/II | Unknown | Unknown | SD |
| TRIM69 | SNV | Missense_Mutation | c.792N>T | p.Gln264His | p.Q264H | Q86WT6 | protein_coding | tolerated(0.18) | benign(0.025) | TCGA-FU-A3HZ-01 | Cervix | cervical & endocervical cancer | Female | <65 | I/II | Chemotherapy | cisplatin | CR | |
| TRIM69 | SNV | Missense_Mutation | novel | c.1465N>C | p.Glu489Gln | p.E489Q | Q86WT6 | protein_coding | tolerated(0.07) | possibly_damaging(0.846) | TCGA-VS-A8EL-01 | Cervix | cervical & endocervical cancer | Female | <65 | I/II | Chemotherapy | cisplatin | CR |
| TRIM69 | SNV | Missense_Mutation | c.859N>A | p.Leu287Met | p.L287M | Q86WT6 | protein_coding | deleterious(0.04) | benign(0.388) | TCGA-A6-3809-01 | Colorectum | colon adenocarcinoma | Female | >=65 | I/II | Unknown | Unknown | SD | |
| TRIM69 | SNV | Missense_Mutation | c.41N>A | p.Gly14Asp | p.G14D | Q86WT6 | protein_coding | tolerated_low_confidence(0.22) | benign(0) | TCGA-AA-3989-01 | Colorectum | colon adenocarcinoma | Male | >=65 | III/IV | Unknown | Unknown | PD | |
| TRIM69 | SNV | Missense_Mutation | novel | c.1141N>A | p.Glu381Lys | p.E381K | Q86WT6 | protein_coding | deleterious(0.01) | probably_damaging(0.99) | TCGA-AA-A00N-01 | Colorectum | colon adenocarcinoma | Male | >=65 | I/II | Unknown | Unknown | PD |
| TRIM69 | SNV | Missense_Mutation | c.1292C>T | p.Ser431Phe | p.S431F | Q86WT6 | protein_coding | deleterious(0.03) | probably_damaging(0.972) | TCGA-AA-A010-01 | Colorectum | colon adenocarcinoma | Female | <65 | I/II | Chemotherapy | folinic | CR |
| Page: 1 2 3 4 5 6 |
Top |
Related drugs of malignant transformation related genes |
| Identification of chemicals and drugs interact with genes involved in malignant transfromation |
| (DGIdb 4.0) |
| Entrez ID | Symbol | Category | Interaction Types | Drug Claim Name | Drug Name | PMIDs |
| Page: 1 |

Copyright 2023-Present -The University of Texas Health Science Center at Houston |