
|
|||||
|
 | |
| |
| |
| |
| |
| |
|
Gene: TMPO |
Gene summary for TMPO |
| Gene information | Species | Human | Gene symbol | TMPO | Gene ID | 7112 |
| Gene name | thymopoietin | |
| Gene Alias | CMD1T | |
| Cytomap | 12q23.1 | |
| Gene Type | protein-coding | GO ID | GO:0000785 | UniProtAcc | A0A024RBE7 |
Top |
Malignant transformation analysis |
| Identification of the aberrant gene expression in precancerous and cancerous lesions by comparing the gene expression of stem-like cells in diseased tissues with normal stem cells |
| Entrez ID | Symbol | Replicates | Species | Organ | Tissue | Adj P-value | Log2FC | Malignancy |
| 7112 | TMPO | P130T-E | Human | Esophagus | ESCC | 3.22e-54 | 1.59e+00 | 0.1676 |
| 7112 | TMPO | HCC1_Meng | Human | Liver | HCC | 7.19e-59 | 9.17e-02 | 0.0246 |
| 7112 | TMPO | HCC2_Meng | Human | Liver | HCC | 5.25e-32 | 1.62e-01 | 0.0107 |
| 7112 | TMPO | HCC1 | Human | Liver | HCC | 2.68e-13 | 4.24e+00 | 0.5336 |
| 7112 | TMPO | HCC2 | Human | Liver | HCC | 1.27e-24 | 4.51e+00 | 0.5341 |
| 7112 | TMPO | HCC5 | Human | Liver | HCC | 1.01e-04 | 2.16e+00 | 0.4932 |
| 7112 | TMPO | Pt13.b | Human | Liver | HCC | 4.19e-02 | 1.51e-02 | 0.0251 |
| 7112 | TMPO | Pt14.a | Human | Liver | HCC | 1.13e-04 | 3.90e-01 | 0.0169 |
| 7112 | TMPO | Pt14.b | Human | Liver | HCC | 1.30e-02 | 2.21e-01 | 0.018 |
| 7112 | TMPO | S014 | Human | Liver | HCC | 7.47e-26 | 1.35e+00 | 0.2254 |
| 7112 | TMPO | S015 | Human | Liver | HCC | 1.34e-17 | 8.78e-01 | 0.2375 |
| 7112 | TMPO | S016 | Human | Liver | HCC | 3.44e-27 | 1.04e+00 | 0.2243 |
| 7112 | TMPO | S027 | Human | Liver | HCC | 1.32e-05 | 8.25e-01 | 0.2446 |
| 7112 | TMPO | S028 | Human | Liver | HCC | 1.39e-28 | 1.49e+00 | 0.2503 |
| 7112 | TMPO | S029 | Human | Liver | HCC | 4.50e-19 | 1.15e+00 | 0.2581 |
| 7112 | TMPO | C04 | Human | Oral cavity | OSCC | 9.20e-11 | 9.14e-01 | 0.2633 |
| 7112 | TMPO | C21 | Human | Oral cavity | OSCC | 6.25e-15 | 8.48e-01 | 0.2678 |
| 7112 | TMPO | C30 | Human | Oral cavity | OSCC | 1.67e-16 | 1.34e+00 | 0.3055 |
| 7112 | TMPO | C38 | Human | Oral cavity | OSCC | 1.16e-08 | 1.20e+00 | 0.172 |
| 7112 | TMPO | C43 | Human | Oral cavity | OSCC | 4.21e-16 | 4.32e-01 | 0.1704 |
| Page: 1 2 3 4 5 6 |
| Tissue | Expression Dynamics | Abbreviation |
| Esophagus | 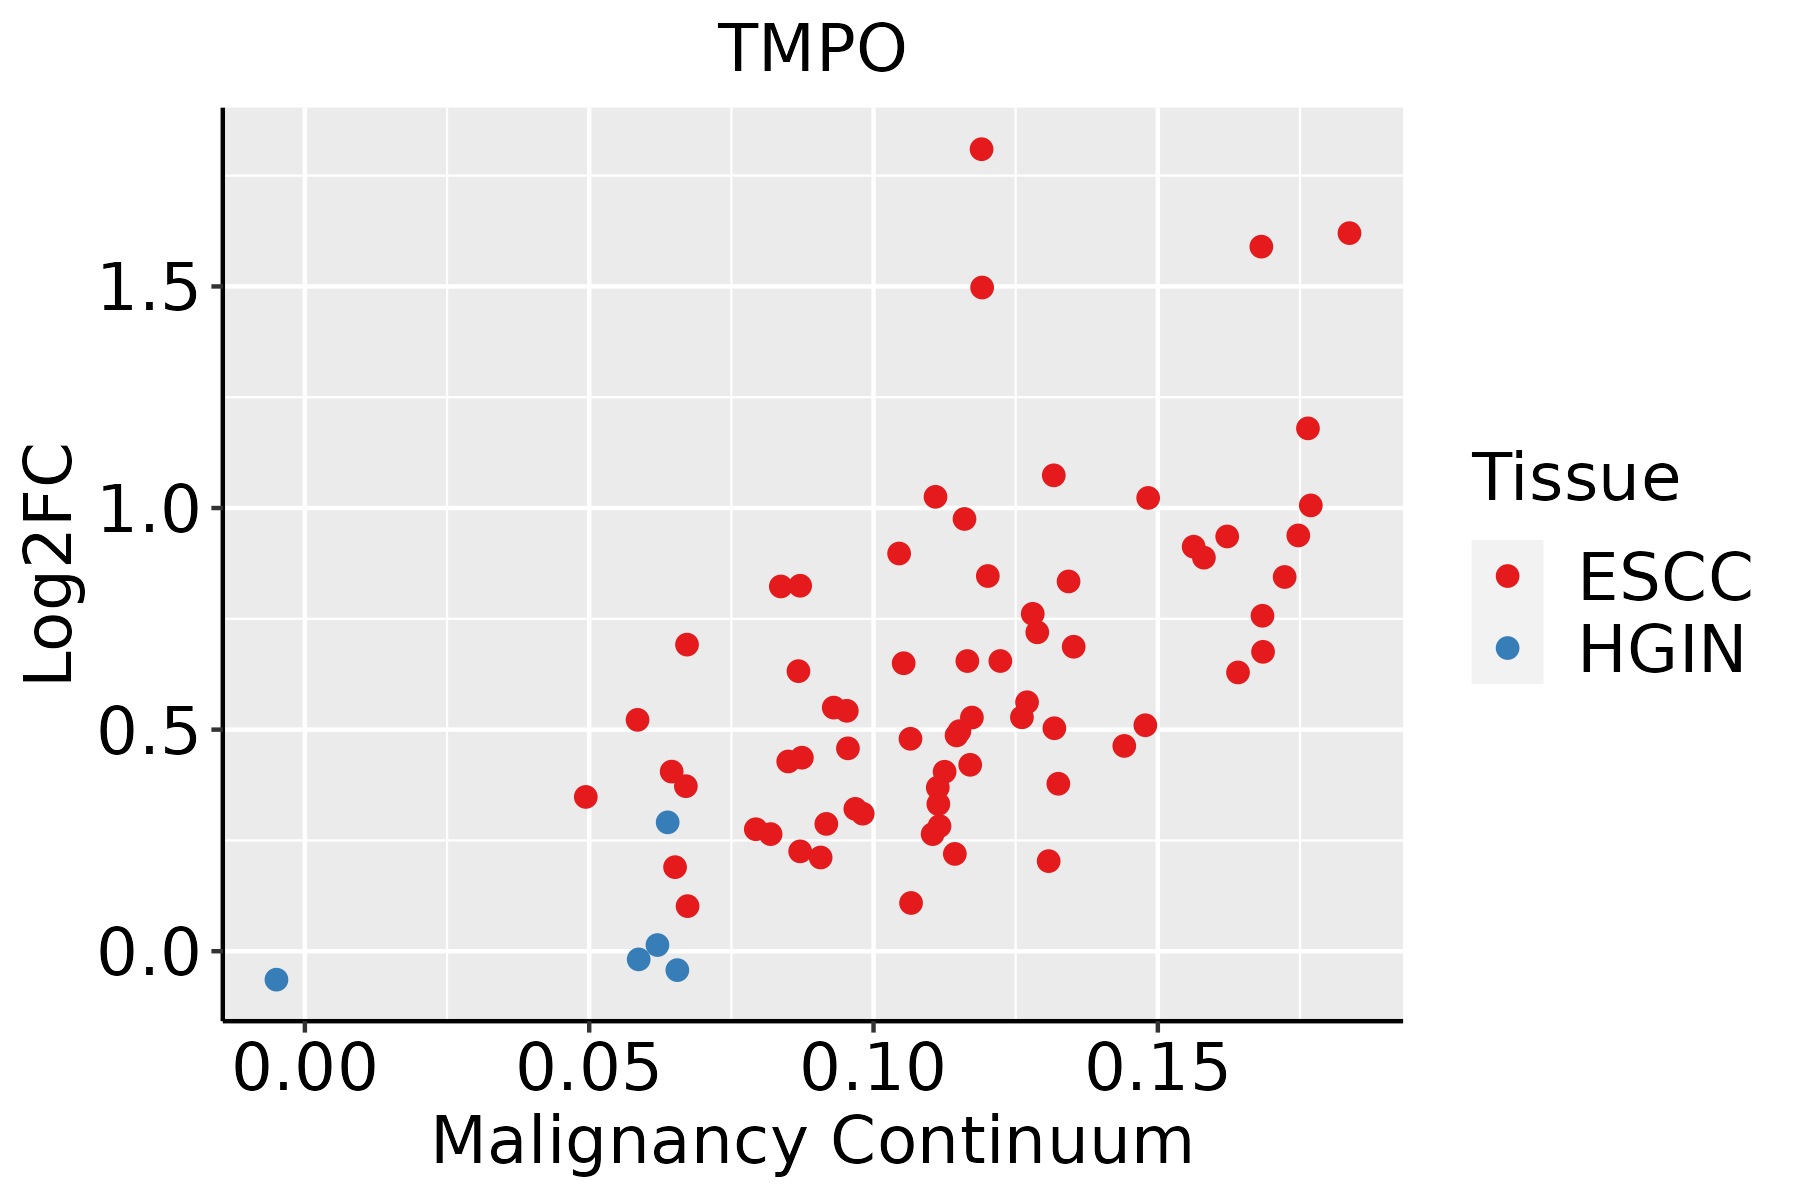 | ESCC: Esophageal squamous cell carcinoma |
| HGIN: High-grade intraepithelial neoplasias | ||
| LGIN: Low-grade intraepithelial neoplasias | ||
| Liver | 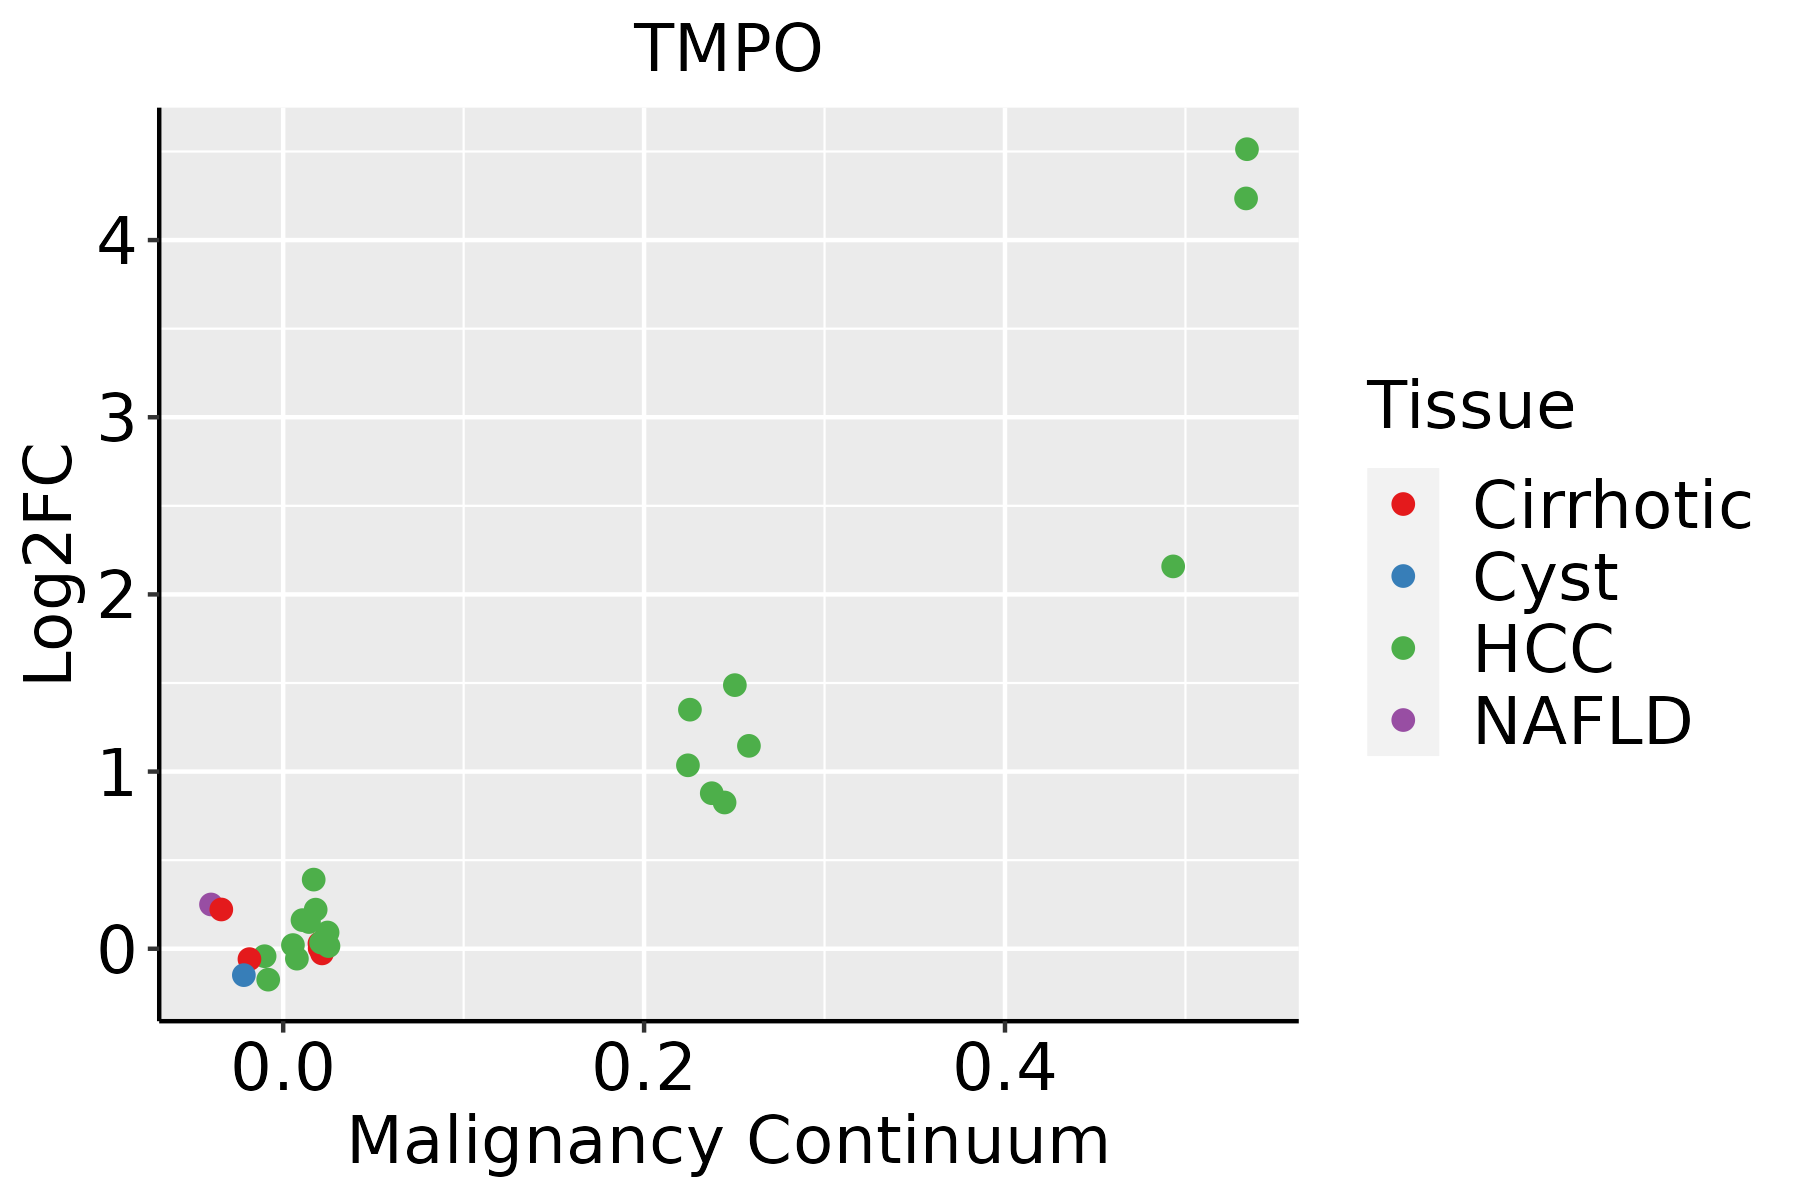 | HCC: Hepatocellular carcinoma |
| NAFLD: Non-alcoholic fatty liver disease | ||
| Oral Cavity |  | EOLP: Erosive Oral lichen planus |
| LP: leukoplakia | ||
| NEOLP: Non-erosive oral lichen planus | ||
| OSCC: Oral squamous cell carcinoma | ||
| Prostate | 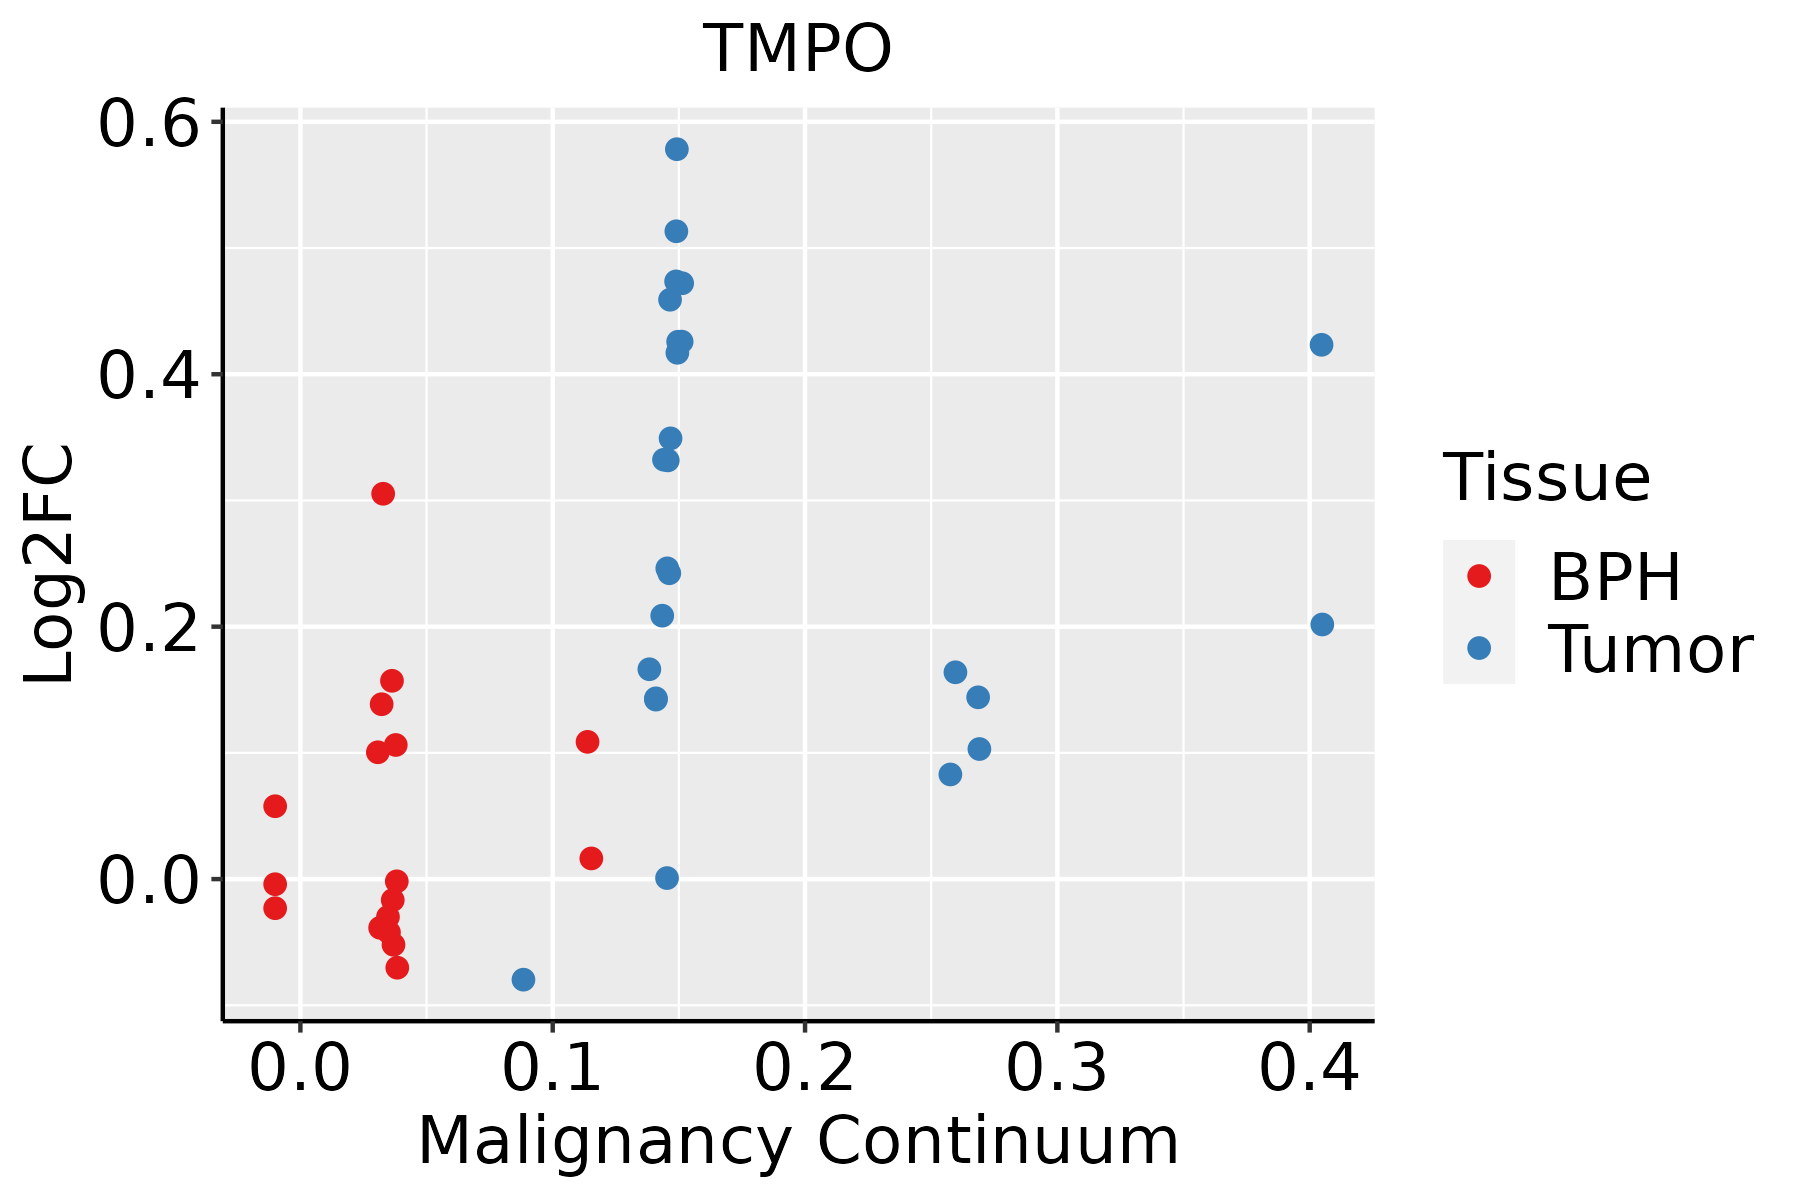 | BPH: Benign Prostatic Hyperplasia |
| Skin | 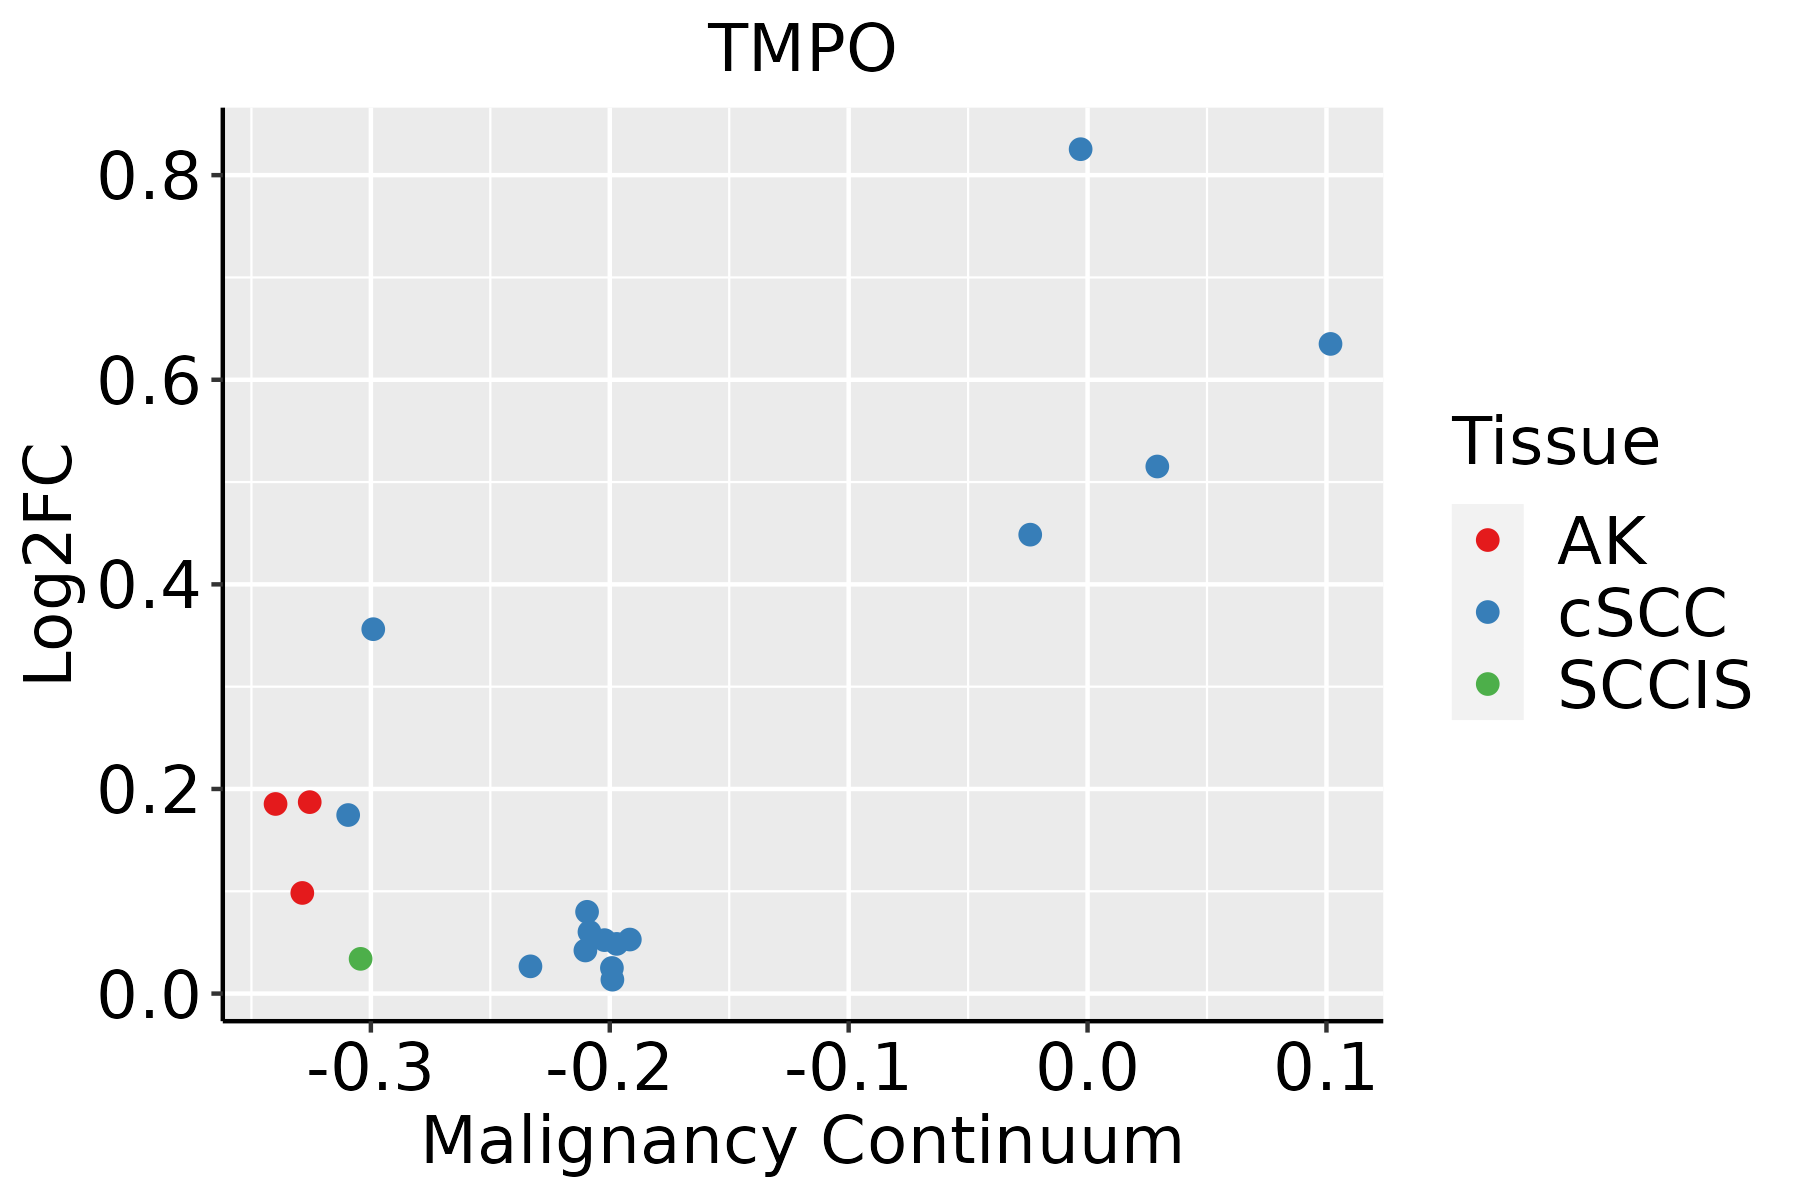 | AK: Actinic keratosis |
| cSCC: Cutaneous squamous cell carcinoma | ||
| SCCIS:squamous cell carcinoma in situ | ||
| Thyroid |  | ATC: Anaplastic thyroid cancer |
| HT: Hashimoto's thyroiditis | ||
| PTC: Papillary thyroid cancer |
| ∗log2FC in expression of this searched gene in stem-like cells from each diseased tissue sample relative to stem-like cells in normal samples in each tissue plotted against the malignancy continuum. Samples are colored based on if they are from different disease stage. |
Top |
Malignant transformation related pathway analysis |
| Find out the enriched GO biological processes and KEGG pathways involved in transition from healthy to precancer to cancer |
| Tissue | Disease Stage | Enriched GO biological Processes |
| Colorectum | AD |  |
| Colorectum | SER |  |
| Colorectum | MSS |  |
| Colorectum | MSI-H |  |
| Colorectum | FAP |  |
| ∗Top 15 enriched GO BP terms are showed in the bar plot of each disease state in each tissue. Each row represents a significant GO biological process which is colored according to the -log10(p.adjust). |
| Page: 1 2 3 4 5 6 7 8 9 |
| GO ID | Tissue | Disease Stage | Description | Gene Ratio | Bg Ratio | pvalue | p.adjust | Count |
| Page: 1 |
| Pathway ID | Tissue | Disease Stage | Description | Gene Ratio | Bg Ratio | pvalue | p.adjust | qvalue | Count |
| Page: 1 |
Top |
Cell-cell communication analysis |
| Identification of potential cell-cell interactions between two cell types and their ligand-receptor pairs for different disease states |
| Ligand | Receptor | LRpair | Pathway | Tissue | Disease Stage |
| Page: 1 |
Top |
Single-cell gene regulatory network inference analysis |
| Find out the significant the regulons (TFs) and the target genes of each regulon across cell types for different disease states |
| TF | Cell Type | Tissue | Disease Stage | Target Gene | RSS | Regulon Activity |
| ∗The dot plots of a searched regulon are shown for all cell subpopulations in each disease state of each tissue based on the regulon specific score inferred using pySCENIC and by calculating the average expression. |
| Page: 1 |
Top |
Somatic mutation of malignant transformation related genes |
| Annotation of somatic variants for genes involved in malignant transformation |
| Hugo Symbol | Variant Class | Variant Classification | dbSNP RS | HGVSc | HGVSp | HGVSp Short | SWISSPROT | BIOTYPE | SIFT | PolyPhen | Tumor Sample Barcode | Tissue | Histology | Sex | Age | Stage | Therapy Types | Drugs | Outcome |
| TMPO | SNV | Missense_Mutation | novel | c.622N>A | p.Glu208Lys | p.E208K | P42166 | protein_coding | deleterious_low_confidence(0.01) | benign(0.321) | TCGA-AR-A2LE-01 | Breast | breast invasive carcinoma | Female | >=65 | I/II | Hormone Therapy | tamoxiphen | PD |
| TMPO | SNV | Missense_Mutation | c.508N>C | p.Glu170Gln | p.E170Q | P42166 | protein_coding | deleterious_low_confidence(0.01) | probably_damaging(0.94) | TCGA-B6-A0WZ-01 | Breast | breast invasive carcinoma | Female | <65 | I/II | Unknown | Unknown | PD | |
| TMPO | SNV | Missense_Mutation | rs770791830 | c.709G>A | p.Glu237Lys | p.E237K | P42166 | protein_coding | deleterious_low_confidence(0) | possibly_damaging(0.448) | TCGA-E9-A1N4-01 | Breast | breast invasive carcinoma | Female | <65 | III/IV | Chemotherapy | doxorubicin | SD |
| TMPO | deletion | Frame_Shift_Del | c.878_891delNNNNNNNNNNNNNN | p.Thr295SerfsTer7 | p.T295Sfs*7 | protein_coding | TCGA-BH-A0B3-01 | Breast | breast invasive carcinoma | Female | <65 | I/II | Chemotherapy | cyclophosphamide | SD | ||||
| TMPO | insertion | Frame_Shift_Ins | rs770800449 | c.295dupA | p.Thr99AsnfsTer2 | p.T99Nfs*2 | P42166 | protein_coding | TCGA-D8-A1JA-01 | Breast | breast invasive carcinoma | Female | <65 | III/IV | Chemotherapy | adriamycin | PD | ||
| TMPO | deletion | Frame_Shift_Del | novel | c.674delN | p.Ala226LeufsTer3 | p.A226Lfs*3 | P42167 | protein_coding | TCGA-EW-A2FV-01 | Breast | breast invasive carcinoma | Female | <65 | III/IV | Chemotherapy | docetaxel | SD | ||
| TMPO | SNV | Missense_Mutation | novel | c.764N>A | p.Pro255His | p.P255H | P42166 | protein_coding | deleterious_low_confidence(0) | benign(0.011) | TCGA-2W-A8YY-01 | Cervix | cervical & endocervical cancer | Female | <65 | I/II | Chemotherapy | cisplatin | CR |
| TMPO | SNV | Missense_Mutation | novel | c.1150N>A | p.Leu384Met | p.L384M | P42166 | protein_coding | deleterious_low_confidence(0) | probably_damaging(0.996) | TCGA-2W-A8YY-01 | Cervix | cervical & endocervical cancer | Female | <65 | I/II | Chemotherapy | cisplatin | CR |
| TMPO | SNV | Missense_Mutation | novel | c.1120N>T | p.Ala374Ser | p.A374S | P42166 | protein_coding | deleterious_low_confidence(0) | probably_damaging(0.987) | TCGA-DS-A1OC-01 | Cervix | cervical & endocervical cancer | Female | <65 | I/II | Chemotherapy | gemcitabine | SD |
| TMPO | SNV | Missense_Mutation | c.822C>A | p.Phe274Leu | p.F274L | protein_coding | tolerated(0.56) | benign(0.001) | TCGA-FU-A3HZ-01 | Cervix | cervical & endocervical cancer | Female | <65 | I/II | Chemotherapy | cisplatin | CR |
| Page: 1 2 3 4 5 6 7 8 9 10 |
Top |
Related drugs of malignant transformation related genes |
| Identification of chemicals and drugs interact with genes involved in malignant transfromation |
| (DGIdb 4.0) |
| Entrez ID | Symbol | Category | Interaction Types | Drug Claim Name | Drug Name | PMIDs |
| Page: 1 |

Copyright 2023-Present -The University of Texas Health Science Center at Houston |