
|
|||||
|
 | |
| |
| |
| |
| |
| |
|
Gene: TMLHE |
Gene summary for TMLHE |
| Gene information | Species | Human | Gene symbol | TMLHE | Gene ID | 55217 |
| Gene name | trimethyllysine hydroxylase, epsilon | |
| Gene Alias | AUTSX6 | |
| Cytomap | Xq28 | |
| Gene Type | protein-coding | GO ID | GO:0006575 | UniProtAcc | Q9NVH6 |
Top |
Malignant transformation analysis |
| Identification of the aberrant gene expression in precancerous and cancerous lesions by comparing the gene expression of stem-like cells in diseased tissues with normal stem cells |
| Entrez ID | Symbol | Replicates | Species | Organ | Tissue | Adj P-value | Log2FC | Malignancy |
| 55217 | TMLHE | S027 | Human | Liver | HCC | 1.69e-05 | 6.26e-01 | 0.2446 |
| 55217 | TMLHE | S028 | Human | Liver | HCC | 5.70e-14 | 5.82e-01 | 0.2503 |
| 55217 | TMLHE | S029 | Human | Liver | HCC | 2.86e-10 | 5.92e-01 | 0.2581 |
| Page: 1 2 3 4 |
| Tissue | Expression Dynamics | Abbreviation |
| Esophagus |  | ESCC: Esophageal squamous cell carcinoma |
| HGIN: High-grade intraepithelial neoplasias | ||
| LGIN: Low-grade intraepithelial neoplasias | ||
| Liver | 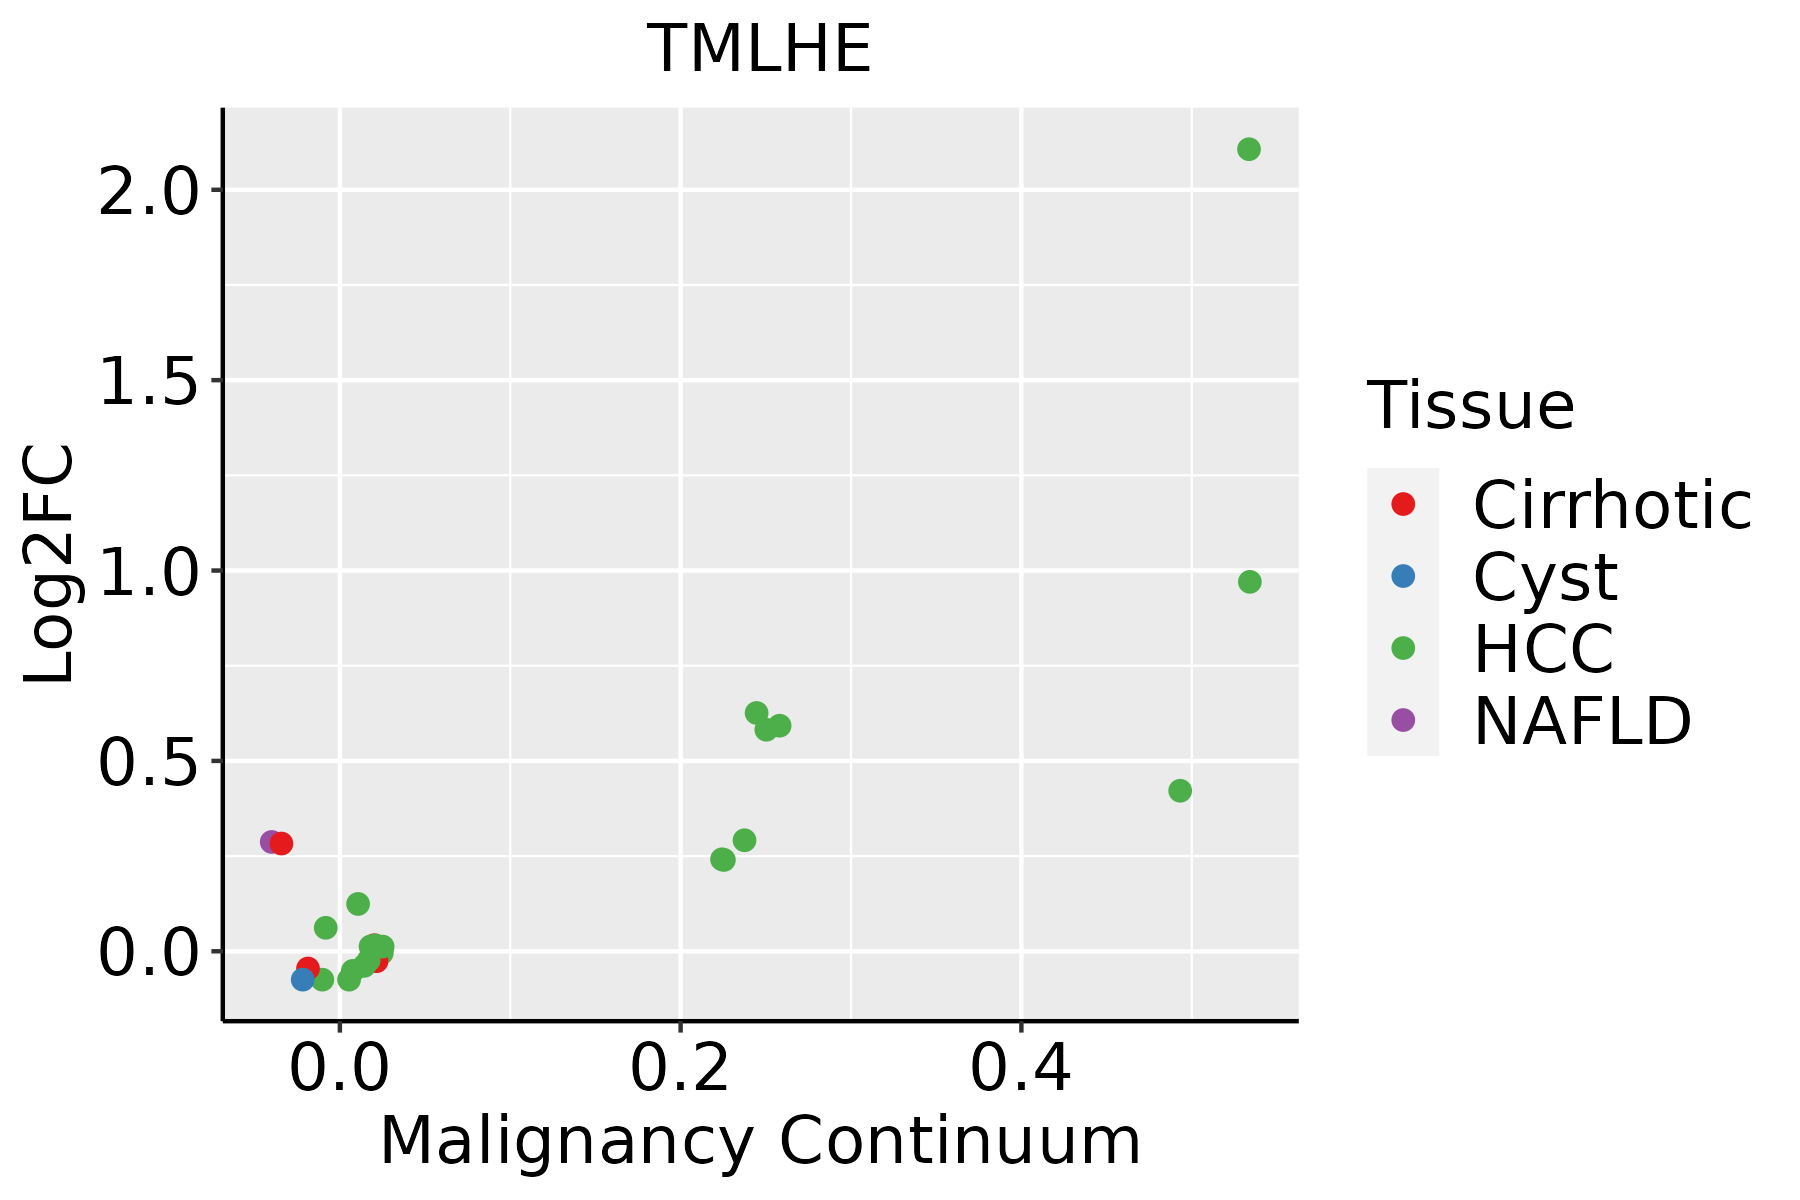 | HCC: Hepatocellular carcinoma |
| NAFLD: Non-alcoholic fatty liver disease |
| ∗log2FC in expression of this searched gene in stem-like cells from each diseased tissue sample relative to stem-like cells in normal samples in each tissue plotted against the malignancy continuum. Samples are colored based on if they are from different disease stage. |
Top |
Malignant transformation related pathway analysis |
| Find out the enriched GO biological processes and KEGG pathways involved in transition from healthy to precancer to cancer |
| Tissue | Disease Stage | Enriched GO biological Processes |
| Colorectum | AD |  |
| Colorectum | SER |  |
| Colorectum | MSS |  |
| Colorectum | MSI-H |  |
| Colorectum | FAP |  |
| ∗Top 15 enriched GO BP terms are showed in the bar plot of each disease state in each tissue. Each row represents a significant GO biological process which is colored according to the -log10(p.adjust). |
| Page: 1 2 3 4 5 6 7 8 9 |
| GO ID | Tissue | Disease Stage | Description | Gene Ratio | Bg Ratio | pvalue | p.adjust | Count |
| GO:00065757 | Esophagus | ESCC | cellular modified amino acid metabolic process | 112/8552 | 188/18723 | 8.31e-05 | 6.06e-04 | 112 |
| GO:00423986 | Esophagus | ESCC | cellular modified amino acid biosynthetic process | 34/8552 | 46/18723 | 9.39e-05 | 6.70e-04 | 34 |
| GO:000657521 | Liver | HCC | cellular modified amino acid metabolic process | 119/7958 | 188/18723 | 6.47e-09 | 1.67e-07 | 119 |
| GO:004239821 | Liver | HCC | cellular modified amino acid biosynthetic process | 34/7958 | 46/18723 | 1.53e-05 | 1.67e-04 | 34 |
| GO:0006577 | Liver | HCC | amino-acid betaine metabolic process | 13/7958 | 17/18723 | 4.77e-03 | 2.02e-02 | 13 |
| Page: 1 |
| Pathway ID | Tissue | Disease Stage | Description | Gene Ratio | Bg Ratio | pvalue | p.adjust | qvalue | Count |
| hsa0031010 | Esophagus | ESCC | Lysine degradation | 41/4205 | 63/8465 | 9.63e-03 | 2.27e-02 | 1.16e-02 | 41 |
| hsa0031013 | Esophagus | ESCC | Lysine degradation | 41/4205 | 63/8465 | 9.63e-03 | 2.27e-02 | 1.16e-02 | 41 |
| hsa0031041 | Liver | HCC | Lysine degradation | 47/4020 | 63/8465 | 1.02e-05 | 7.58e-05 | 4.22e-05 | 47 |
| hsa0031051 | Liver | HCC | Lysine degradation | 47/4020 | 63/8465 | 1.02e-05 | 7.58e-05 | 4.22e-05 | 47 |
| Page: 1 |
Top |
Cell-cell communication analysis |
| Identification of potential cell-cell interactions between two cell types and their ligand-receptor pairs for different disease states |
| Ligand | Receptor | LRpair | Pathway | Tissue | Disease Stage |
| Page: 1 |
Top |
Single-cell gene regulatory network inference analysis |
| Find out the significant the regulons (TFs) and the target genes of each regulon across cell types for different disease states |
| TF | Cell Type | Tissue | Disease Stage | Target Gene | RSS | Regulon Activity |
| ∗The dot plots of a searched regulon are shown for all cell subpopulations in each disease state of each tissue based on the regulon specific score inferred using pySCENIC and by calculating the average expression. |
| Page: 1 |
Top |
Somatic mutation of malignant transformation related genes |
| Annotation of somatic variants for genes involved in malignant transformation |
| Hugo Symbol | Variant Class | Variant Classification | dbSNP RS | HGVSc | HGVSp | HGVSp Short | SWISSPROT | BIOTYPE | SIFT | PolyPhen | Tumor Sample Barcode | Tissue | Histology | Sex | Age | Stage | Therapy Types | Drugs | Outcome |
| TMLHE | SNV | Missense_Mutation | novel | c.1253N>A | p.Gly418Glu | p.G418E | Q9NVH6 | protein_coding | deleterious(0) | probably_damaging(0.999) | TCGA-AO-A0JB-01 | Breast | breast invasive carcinoma | Female | <65 | III/IV | Chemotherapy | cyclophosphamide | SD |
| TMLHE | deletion | Frame_Shift_Del | c.377_386delCTAAATATGA | p.Thr126IlefsTer2 | p.T126Ifs*2 | Q9NVH6 | protein_coding | TCGA-A8-A09A-01 | Breast | breast invasive carcinoma | Female | <65 | I/II | Hormone Therapy | tamoxiphen | SD | |||
| TMLHE | SNV | Missense_Mutation | c.226N>A | p.Leu76Ile | p.L76I | Q9NVH6 | protein_coding | deleterious(0.01) | probably_damaging(0.998) | TCGA-MY-A5BD-01 | Cervix | cervical & endocervical cancer | Female | <65 | I/II | Chemotherapy | cisplatin | CR | |
| TMLHE | SNV | Missense_Mutation | novel | c.767N>A | p.Val256Glu | p.V256E | Q9NVH6 | protein_coding | deleterious(0) | probably_damaging(0.969) | TCGA-VS-A8Q8-01 | Cervix | cervical & endocervical cancer | Female | <65 | I/II | Unknown | Unknown | PD |
| TMLHE | deletion | Frame_Shift_Del | novel | c.352_353delNN | p.Phe118HisfsTer9 | p.F118Hfs*9 | Q9NVH6 | protein_coding | TCGA-Q1-A73O-01 | Cervix | cervical & endocervical cancer | Female | <65 | I/II | Chemotherapy | cisplatin | CR | ||
| TMLHE | SNV | Missense_Mutation | c.917N>C | p.Gly306Ala | p.G306A | Q9NVH6 | protein_coding | tolerated(0.15) | benign(0.015) | TCGA-AA-3982-01 | Colorectum | colon adenocarcinoma | Male | >=65 | III/IV | Unknown | Unknown | SD | |
| TMLHE | SNV | Missense_Mutation | c.574G>A | p.Val192Ile | p.V192I | Q9NVH6 | protein_coding | tolerated(0.1) | possibly_damaging(0.636) | TCGA-AG-A002-01 | Colorectum | rectum adenocarcinoma | Male | <65 | I/II | Unknown | Unknown | SD | |
| TMLHE | SNV | Missense_Mutation | novel | c.143C>A | p.Ser48Tyr | p.S48Y | Q9NVH6 | protein_coding | deleterious(0.03) | benign(0) | TCGA-AG-A002-01 | Colorectum | rectum adenocarcinoma | Male | <65 | I/II | Unknown | Unknown | SD |
| TMLHE | SNV | Missense_Mutation | novel | c.405N>C | p.Lys135Asn | p.K135N | Q9NVH6 | protein_coding | tolerated(0.15) | benign(0.015) | TCGA-F5-6814-01 | Colorectum | rectum adenocarcinoma | Male | <65 | I/II | Unknown | Unknown | SD |
| TMLHE | SNV | Missense_Mutation | rs782642019 | c.329N>A | p.Arg110His | p.R110H | Q9NVH6 | protein_coding | tolerated(0.16) | benign(0.003) | TCGA-A5-A0G2-01 | Endometrium | uterine corpus endometrioid carcinoma | Female | <65 | III/IV | Unknown | Unknown | SD |
| Page: 1 2 3 4 5 |
Top |
Related drugs of malignant transformation related genes |
| Identification of chemicals and drugs interact with genes involved in malignant transfromation |
| (DGIdb 4.0) |
| Entrez ID | Symbol | Category | Interaction Types | Drug Claim Name | Drug Name | PMIDs |
| Page: 1 |

Copyright 2023-Present -The University of Texas Health Science Center at Houston |