
|
|||||
|
 | |
| |
| |
| |
| |
| |
|
Gene: TMEM2 |
Gene summary for TMEM2 |
| Gene information | Species | Human | Gene symbol | TMEM2 | Gene ID | 23670 |
| Gene name | cell migration inducing hyaluronidase 2 | |
| Gene Alias | TMEM2 | |
| Cytomap | 9q21.13 | |
| Gene Type | protein-coding | GO ID | GO:0001525 | UniProtAcc | Q9UHN6 |
Top |
Malignant transformation analysis |
| Identification of the aberrant gene expression in precancerous and cancerous lesions by comparing the gene expression of stem-like cells in diseased tissues with normal stem cells |
| Entrez ID | Symbol | Replicates | Species | Organ | Tissue | Adj P-value | Log2FC | Malignancy |
| 23670 | TMEM2 | cirrhotic2 | Human | Liver | Cirrhotic | 3.08e-02 | -5.04e-02 | 0.0201 |
| 23670 | TMEM2 | cirrhotic3 | Human | Liver | Cirrhotic | 1.42e-08 | 1.17e-01 | 0.0215 |
| 23670 | TMEM2 | HCC1 | Human | Liver | HCC | 1.80e-10 | 4.26e+00 | 0.5336 |
| 23670 | TMEM2 | HCC2 | Human | Liver | HCC | 5.04e-07 | 3.32e+00 | 0.5341 |
| 23670 | TMEM2 | Pt13.b | Human | Liver | HCC | 3.35e-05 | -8.56e-02 | 0.0251 |
| 23670 | TMEM2 | S014 | Human | Liver | HCC | 2.33e-03 | -2.44e-01 | 0.2254 |
| 23670 | TMEM2 | S016 | Human | Liver | HCC | 7.91e-05 | -2.44e-01 | 0.2243 |
| 23670 | TMEM2 | S028 | Human | Liver | HCC | 3.92e-02 | -2.44e-01 | 0.2503 |
| 23670 | TMEM2 | C04 | Human | Oral cavity | OSCC | 2.50e-06 | 4.05e-01 | 0.2633 |
| 23670 | TMEM2 | C21 | Human | Oral cavity | OSCC | 1.51e-04 | 2.50e-01 | 0.2678 |
| 23670 | TMEM2 | C30 | Human | Oral cavity | OSCC | 2.94e-31 | 1.09e+00 | 0.3055 |
| 23670 | TMEM2 | C51 | Human | Oral cavity | OSCC | 9.11e-04 | 2.90e-01 | 0.2674 |
| 23670 | TMEM2 | C57 | Human | Oral cavity | OSCC | 6.56e-03 | 8.81e-02 | 0.1679 |
| 23670 | TMEM2 | C06 | Human | Oral cavity | OSCC | 7.45e-03 | 6.78e-01 | 0.2699 |
| 23670 | TMEM2 | C09 | Human | Oral cavity | OSCC | 5.29e-11 | 3.27e-01 | 0.1431 |
| 23670 | TMEM2 | LP15 | Human | Oral cavity | LP | 2.63e-03 | 5.30e-01 | 0.2174 |
| 23670 | TMEM2 | SYSMH3 | Human | Oral cavity | OSCC | 1.52e-08 | 3.36e-01 | 0.2442 |
| 23670 | TMEM2 | SYSMH4 | Human | Oral cavity | OSCC | 2.13e-02 | 1.33e-01 | 0.1226 |
| 23670 | TMEM2 | SYSMH6 | Human | Oral cavity | OSCC | 9.11e-10 | 3.15e-01 | 0.1275 |
| 23670 | TMEM2 | Dong_P1 | Human | Prostate | Tumor | 1.93e-22 | 2.36e-01 | 0.035 |
| Page: 1 2 3 4 5 |
| Tissue | Expression Dynamics | Abbreviation |
| Colorectum (GSE201348) |  | FAP: Familial adenomatous polyposis |
| CRC: Colorectal cancer | ||
| Colorectum (HTA11) |  | AD: Adenomas |
| SER: Sessile serrated lesions | ||
| MSI-H: Microsatellite-high colorectal cancer | ||
| MSS: Microsatellite stable colorectal cancer | ||
| Esophagus | 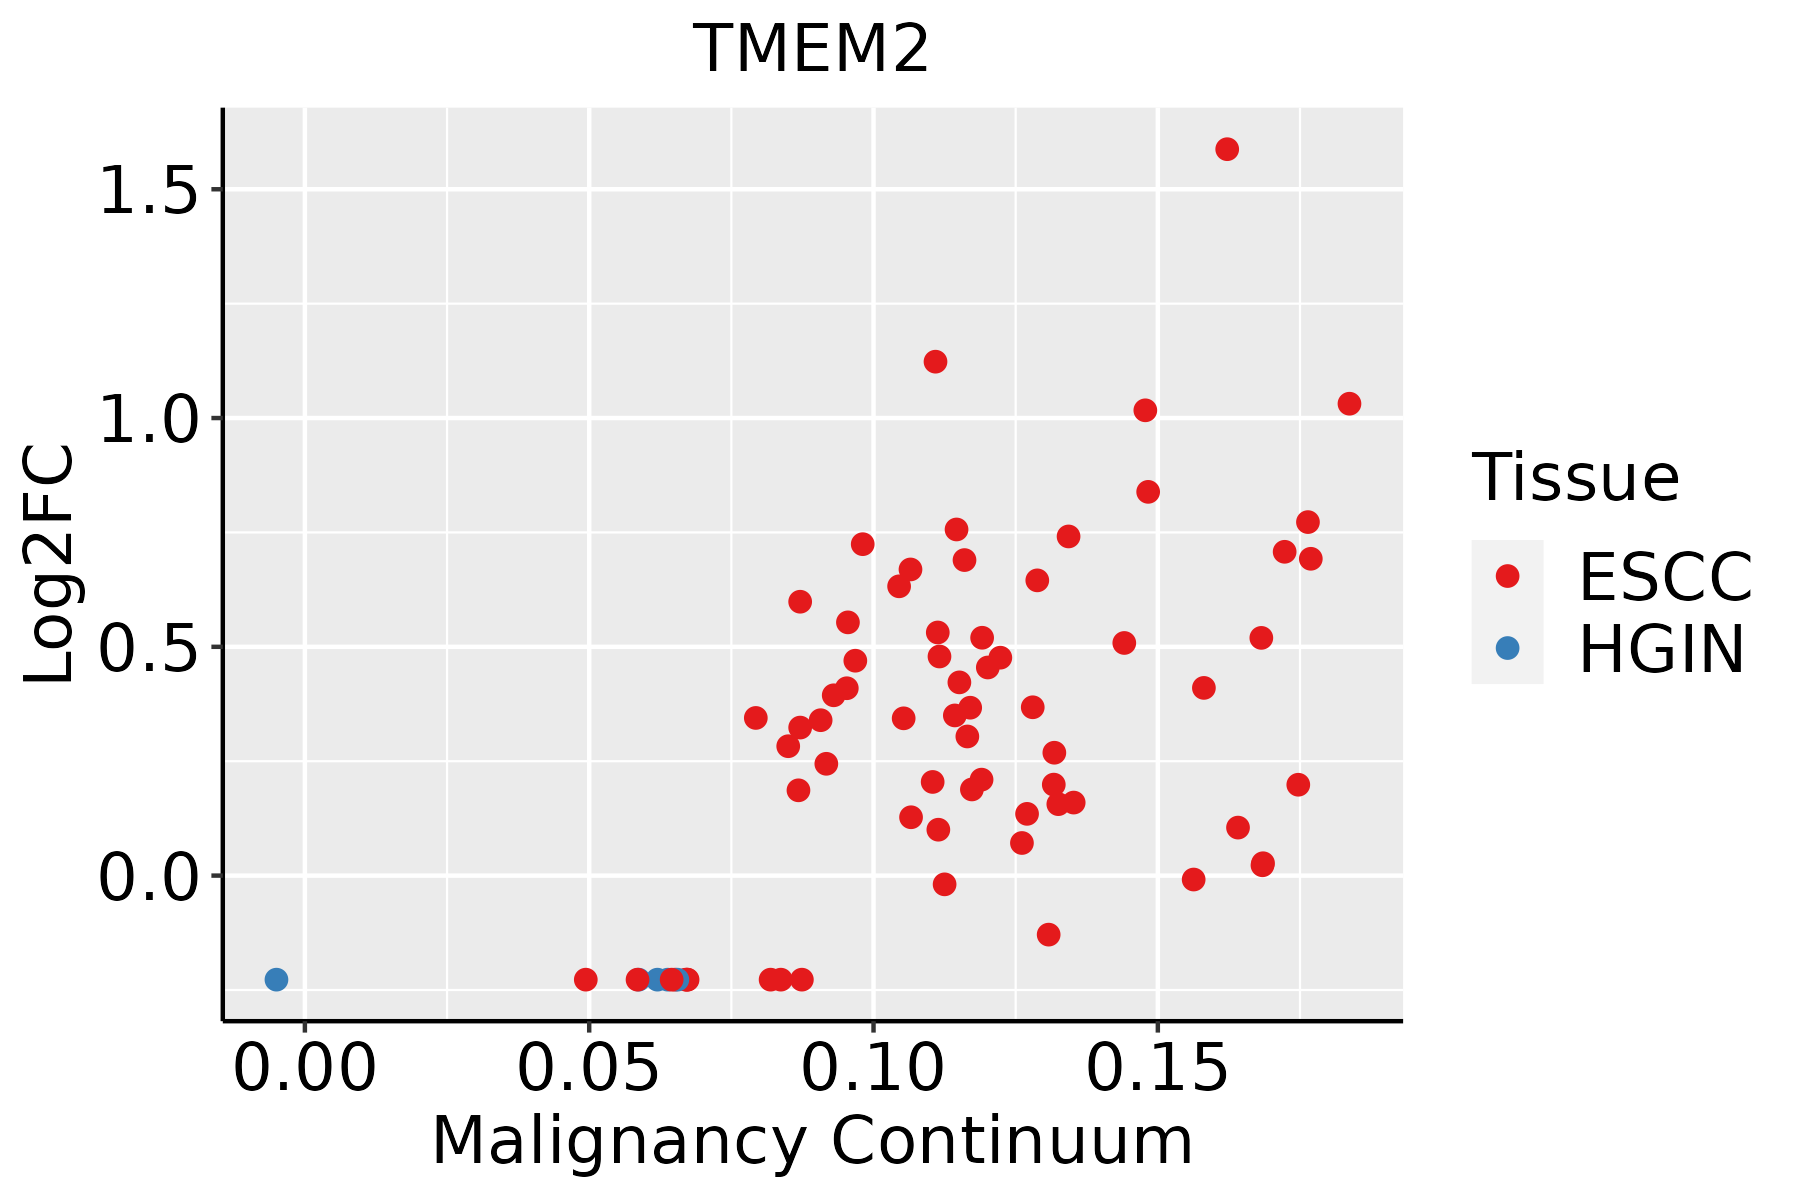 | ESCC: Esophageal squamous cell carcinoma |
| HGIN: High-grade intraepithelial neoplasias | ||
| LGIN: Low-grade intraepithelial neoplasias | ||
| Liver |  | HCC: Hepatocellular carcinoma |
| NAFLD: Non-alcoholic fatty liver disease | ||
| Oral Cavity | 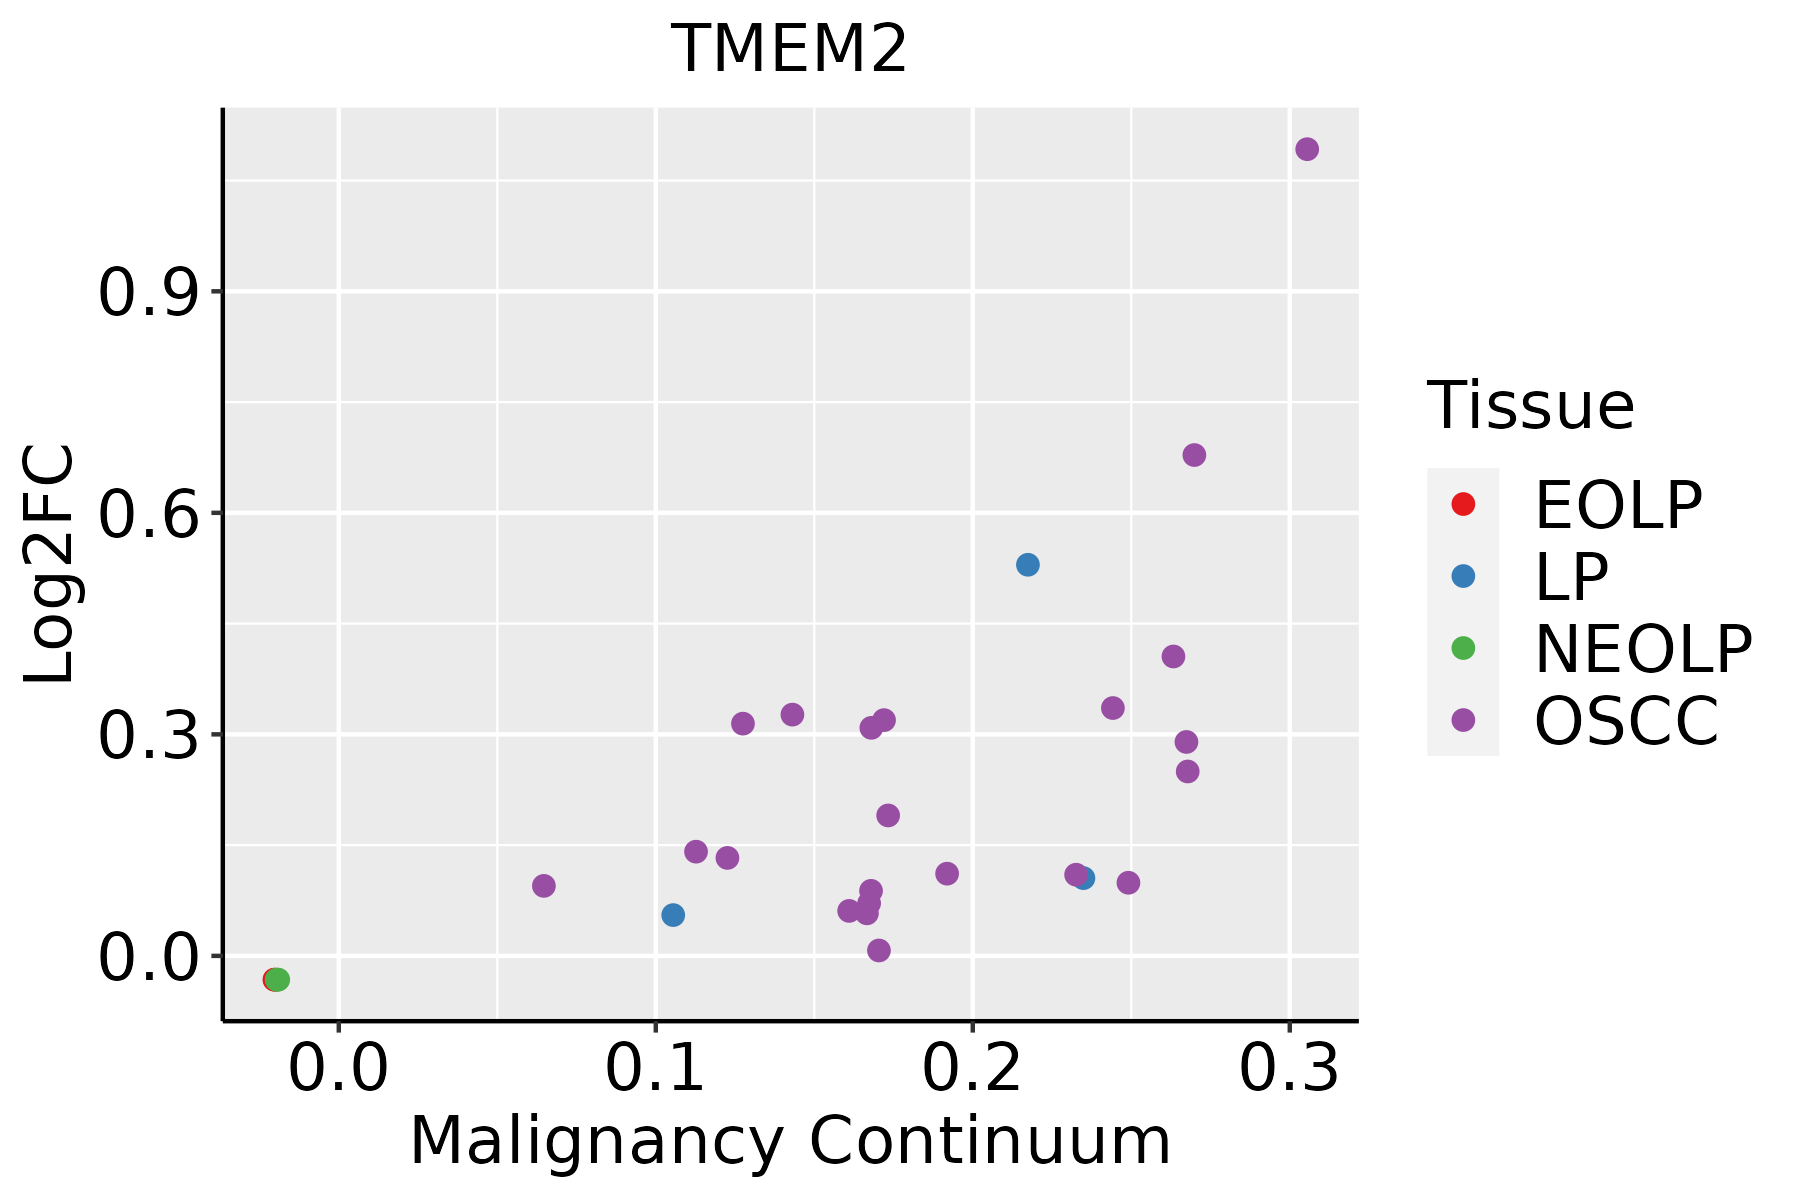 | EOLP: Erosive Oral lichen planus |
| LP: leukoplakia | ||
| NEOLP: Non-erosive oral lichen planus | ||
| OSCC: Oral squamous cell carcinoma | ||
| Prostate |  | BPH: Benign Prostatic Hyperplasia |
| ∗log2FC in expression of this searched gene in stem-like cells from each diseased tissue sample relative to stem-like cells in normal samples in each tissue plotted against the malignancy continuum. Samples are colored based on if they are from different disease stage. |
Top |
Malignant transformation related pathway analysis |
| Find out the enriched GO biological processes and KEGG pathways involved in transition from healthy to precancer to cancer |
| Tissue | Disease Stage | Enriched GO biological Processes |
| Colorectum | AD |  |
| Colorectum | SER |  |
| Colorectum | MSS |  |
| Colorectum | MSI-H |  |
| Colorectum | FAP |  |
| ∗Top 15 enriched GO BP terms are showed in the bar plot of each disease state in each tissue. Each row represents a significant GO biological process which is colored according to the -log10(p.adjust). |
| Page: 1 2 3 4 5 6 7 8 9 |
| GO ID | Tissue | Disease Stage | Description | Gene Ratio | Bg Ratio | pvalue | p.adjust | Count |
| GO:0016032 | Colorectum | AD | viral process | 168/3918 | 415/18723 | 4.67e-20 | 3.66e-17 | 168 |
| GO:0048524 | Colorectum | AD | positive regulation of viral process | 31/3918 | 65/18723 | 1.33e-06 | 4.23e-05 | 31 |
| GO:0050792 | Colorectum | AD | regulation of viral process | 59/3918 | 164/18723 | 5.95e-06 | 1.52e-04 | 59 |
| GO:0000910 | Colorectum | AD | cytokinesis | 59/3918 | 173/18723 | 3.74e-05 | 6.75e-04 | 59 |
| GO:0061640 | Colorectum | AD | cytoskeleton-dependent cytokinesis | 37/3918 | 100/18723 | 1.58e-04 | 2.20e-03 | 37 |
| GO:0051604 | Colorectum | AD | protein maturation | 85/3918 | 294/18723 | 6.73e-04 | 6.91e-03 | 85 |
| GO:0006487 | Colorectum | AD | protein N-linked glycosylation | 25/3918 | 65/18723 | 9.12e-04 | 8.71e-03 | 25 |
| GO:0006486 | Colorectum | AD | protein glycosylation | 64/3918 | 226/18723 | 4.86e-03 | 3.27e-02 | 64 |
| GO:0043413 | Colorectum | AD | macromolecule glycosylation | 64/3918 | 226/18723 | 4.86e-03 | 3.27e-02 | 64 |
| GO:0070085 | Colorectum | AD | glycosylation | 67/3918 | 240/18723 | 5.78e-03 | 3.67e-02 | 67 |
| GO:0016485 | Colorectum | AD | protein processing | 63/3918 | 225/18723 | 6.77e-03 | 4.19e-02 | 63 |
| GO:00160321 | Colorectum | SER | viral process | 118/2897 | 415/18723 | 8.36e-12 | 1.65e-09 | 118 |
| GO:00516041 | Colorectum | SER | protein maturation | 73/2897 | 294/18723 | 1.82e-05 | 5.38e-04 | 73 |
| GO:00009101 | Colorectum | SER | cytokinesis | 45/2897 | 173/18723 | 2.28e-04 | 3.93e-03 | 45 |
| GO:00507921 | Colorectum | SER | regulation of viral process | 43/2897 | 164/18723 | 2.57e-04 | 4.31e-03 | 43 |
| GO:00164851 | Colorectum | SER | protein processing | 55/2897 | 225/18723 | 2.84e-04 | 4.67e-03 | 55 |
| GO:00616401 | Colorectum | SER | cytoskeleton-dependent cytokinesis | 29/2897 | 100/18723 | 4.25e-04 | 6.25e-03 | 29 |
| GO:00485241 | Colorectum | SER | positive regulation of viral process | 21/2897 | 65/18723 | 5.39e-04 | 7.57e-03 | 21 |
| GO:00064871 | Colorectum | MSS | protein N-linked glycosylation | 23/3467 | 65/18723 | 9.47e-04 | 9.54e-03 | 23 |
| GO:00516042 | Colorectum | MSS | protein maturation | 75/3467 | 294/18723 | 1.70e-03 | 1.53e-02 | 75 |
| Page: 1 2 3 4 5 6 7 8 9 10 11 12 13 14 15 16 17 18 |
| Pathway ID | Tissue | Disease Stage | Description | Gene Ratio | Bg Ratio | pvalue | p.adjust | qvalue | Count |
| Page: 1 |
Top |
Cell-cell communication analysis |
| Identification of potential cell-cell interactions between two cell types and their ligand-receptor pairs for different disease states |
| Ligand | Receptor | LRpair | Pathway | Tissue | Disease Stage |
| Page: 1 |
Top |
Single-cell gene regulatory network inference analysis |
| Find out the significant the regulons (TFs) and the target genes of each regulon across cell types for different disease states |
| TF | Cell Type | Tissue | Disease Stage | Target Gene | RSS | Regulon Activity |
| ∗The dot plots of a searched regulon are shown for all cell subpopulations in each disease state of each tissue based on the regulon specific score inferred using pySCENIC and by calculating the average expression. |
| Page: 1 |
Top |
Somatic mutation of malignant transformation related genes |
| Annotation of somatic variants for genes involved in malignant transformation |
| Hugo Symbol | Variant Class | Variant Classification | dbSNP RS | HGVSc | HGVSp | HGVSp Short | SWISSPROT | BIOTYPE | SIFT | PolyPhen | Tumor Sample Barcode | Tissue | Histology | Sex | Age | Stage | Therapy Types | Drugs | Outcome |
| TMEM2 | SNV | Missense_Mutation | novel | c.3527G>A | p.Arg1176Lys | p.R1176K | Q9UHN6 | protein_coding | tolerated(0.66) | benign(0) | TCGA-A8-A06Q-01 | Breast | breast invasive carcinoma | Female | <65 | III/IV | Unknown | Unknown | SD |
| TMEM2 | SNV | Missense_Mutation | novel | c.3357N>A | p.Phe1119Leu | p.F1119L | Q9UHN6 | protein_coding | deleterious(0.03) | possibly_damaging(0.49) | TCGA-AN-A046-01 | Breast | breast invasive carcinoma | Female | >=65 | I/II | Unknown | Unknown | SD |
| TMEM2 | SNV | Missense_Mutation | c.1139N>G | p.Gln380Arg | p.Q380R | Q9UHN6 | protein_coding | tolerated(0.68) | benign(0.001) | TCGA-AR-A0TX-01 | Breast | breast invasive carcinoma | Female | <65 | I/II | Unknown | Unknown | SD | |
| TMEM2 | insertion | Nonsense_Mutation | novel | c.922_923insCTGAATCTGTGGGATCTACTAAAGTTTA | p.Arg308ProfsTer10 | p.R308Pfs*10 | Q9UHN6 | protein_coding | TCGA-AO-A0JF-01 | Breast | breast invasive carcinoma | Female | >=65 | I/II | Chemotherapy | doxorubicin | SD | ||
| TMEM2 | SNV | Missense_Mutation | novel | c.3854N>T | p.Ser1285Phe | p.S1285F | Q9UHN6 | protein_coding | deleterious(0.01) | probably_damaging(0.996) | TCGA-2W-A8YY-01 | Cervix | cervical & endocervical cancer | Female | <65 | I/II | Chemotherapy | cisplatin | CR |
| TMEM2 | SNV | Missense_Mutation | rs772803934 | c.1469N>A | p.Arg490Gln | p.R490Q | Q9UHN6 | protein_coding | deleterious(0.03) | benign(0.264) | TCGA-2W-A8YY-01 | Cervix | cervical & endocervical cancer | Female | <65 | I/II | Chemotherapy | cisplatin | CR |
| TMEM2 | SNV | Missense_Mutation | c.415N>T | p.Asp139Tyr | p.D139Y | Q9UHN6 | protein_coding | tolerated(0.07) | possibly_damaging(0.87) | TCGA-2W-A8YY-01 | Cervix | cervical & endocervical cancer | Female | <65 | I/II | Chemotherapy | cisplatin | CR | |
| TMEM2 | SNV | Missense_Mutation | novel | c.1885N>G | p.Thr629Ala | p.T629A | Q9UHN6 | protein_coding | deleterious(0.05) | benign(0.083) | TCGA-EA-A410-01 | Cervix | cervical & endocervical cancer | Female | <65 | I/II | Unknown | Unknown | SD |
| TMEM2 | SNV | Missense_Mutation | rs776808520 | c.314C>T | p.Ser105Leu | p.S105L | Q9UHN6 | protein_coding | deleterious(0) | benign(0.03) | TCGA-FU-A3HY-01 | Cervix | cervical & endocervical cancer | Female | <65 | I/II | Chemotherapy | cisplatin | CR |
| TMEM2 | SNV | Missense_Mutation | c.2635C>T | p.His879Tyr | p.H879Y | Q9UHN6 | protein_coding | tolerated(1) | benign(0.171) | TCGA-JW-A5VL-01 | Cervix | cervical & endocervical cancer | Female | <65 | I/II | Unknown | Unknown | SD |
| Page: 1 2 3 4 5 6 7 8 9 10 11 12 13 14 15 16 |
Top |
Related drugs of malignant transformation related genes |
| Identification of chemicals and drugs interact with genes involved in malignant transfromation |
| (DGIdb 4.0) |
| Entrez ID | Symbol | Category | Interaction Types | Drug Claim Name | Drug Name | PMIDs |
| Page: 1 |

Copyright 2023-Present -The University of Texas Health Science Center at Houston |