Schematic overview of the cellular and molecular mechanisms involved in the cancer progression, including the proposed cellular and molecular mechanisms in cancer cells trajectory. AT1: alveolar type 1 cells; AT2: alveolar type 2 cells; AAH: atypical adenomatous hyperplasia; AIS: adenocarcinoma in situ; MIA: minimally invasive adenocarcinoma; IA: invasive adenocarcinoma; EMT: epithelial-mesenchymal transition

Home

Download

Statistics

Help

Contact

Center for Computational Systems Medicine
leaf

Gene summary

leaf

Malignant transformation analysis

leaf

Malignant transformation related pathway analysis

leaf

Cell-cell communication analysis

leaf

Single-cell gene regulatory network inference analysis

leaf

Somatic mutation of malignant transformation related genes

leaf

Related drugs of malignant transformation related genes

Gene: TIPRL

Gene summary for TIPRL

check button Gene summary.

Gene informationSpeciesHuman
Gene symbol

TIPRL

Gene ID

261726

Gene nameTOR signaling pathway regulator
Gene AliasTIP
Cytomap1q24.2
Gene Typeprotein-coding
GO ID

GO:0000075

UniProtAcc

O75663


Top

Malignant transformation analysis

check button Identification of the aberrant gene expression in precancerous and cancerous lesions by comparing the gene expression of stem-like cells in diseased tissues with normal stem cells
check button Malignant transformation involving gene list.
Entrez IDSymbolReplicatesSpeciesOrganTissueAdj P-valueLog2FCMalignancy
261726TIPRLP47T-EHumanEsophagusESCC3.54e-478.29e-010.1067
261726TIPRLP48T-EHumanEsophagusESCC1.10e-224.56e-010.0959
261726TIPRLP49T-EHumanEsophagusESCC8.09e-262.28e+000.1768
261726TIPRLP52T-EHumanEsophagusESCC3.26e-449.57e-010.1555
261726TIPRLP54T-EHumanEsophagusESCC1.21e-235.01e-010.0975
261726TIPRLP56T-EHumanEsophagusESCC2.30e-121.62e+000.1613
261726TIPRLP57T-EHumanEsophagusESCC2.19e-163.43e-010.0926
261726TIPRLP61T-EHumanEsophagusESCC2.02e-204.14e-010.099
261726TIPRLP62T-EHumanEsophagusESCC2.28e-711.15e+000.1302
261726TIPRLP65T-EHumanEsophagusESCC3.45e-315.50e-010.0978
261726TIPRLP74T-EHumanEsophagusESCC1.44e-441.19e+000.1479
261726TIPRLP75T-EHumanEsophagusESCC2.47e-601.06e+000.1125
261726TIPRLP76T-EHumanEsophagusESCC5.11e-641.11e+000.1207
261726TIPRLP79T-EHumanEsophagusESCC2.17e-365.89e-010.1154
261726TIPRLP80T-EHumanEsophagusESCC4.64e-541.63e+000.155
261726TIPRLP82T-EHumanEsophagusESCC8.62e-181.11e+000.1072
261726TIPRLP83T-EHumanEsophagusESCC9.19e-521.47e+000.1738
261726TIPRLP84T-EHumanEsophagusESCC3.54e-166.65e-010.0933
261726TIPRLP89T-EHumanEsophagusESCC8.07e-322.10e+000.1752
261726TIPRLP91T-EHumanEsophagusESCC3.88e-191.95e+000.1828
Page: 1 2 3 4 5 6 7 8 

check button Transcriptomic changes along malignancy continuum.
TissueExpression DynamicsAbbreviation
BreastThe image shows the transcriptomic changes along malignancy continuum.log2FC in expression of this searched gene in stem-like cells from each diseased tissue sample relative to stem-like cells in normal samples in each tissue plotted against the malignancy continuum. Samples are colored based on if they are from different disease stage.
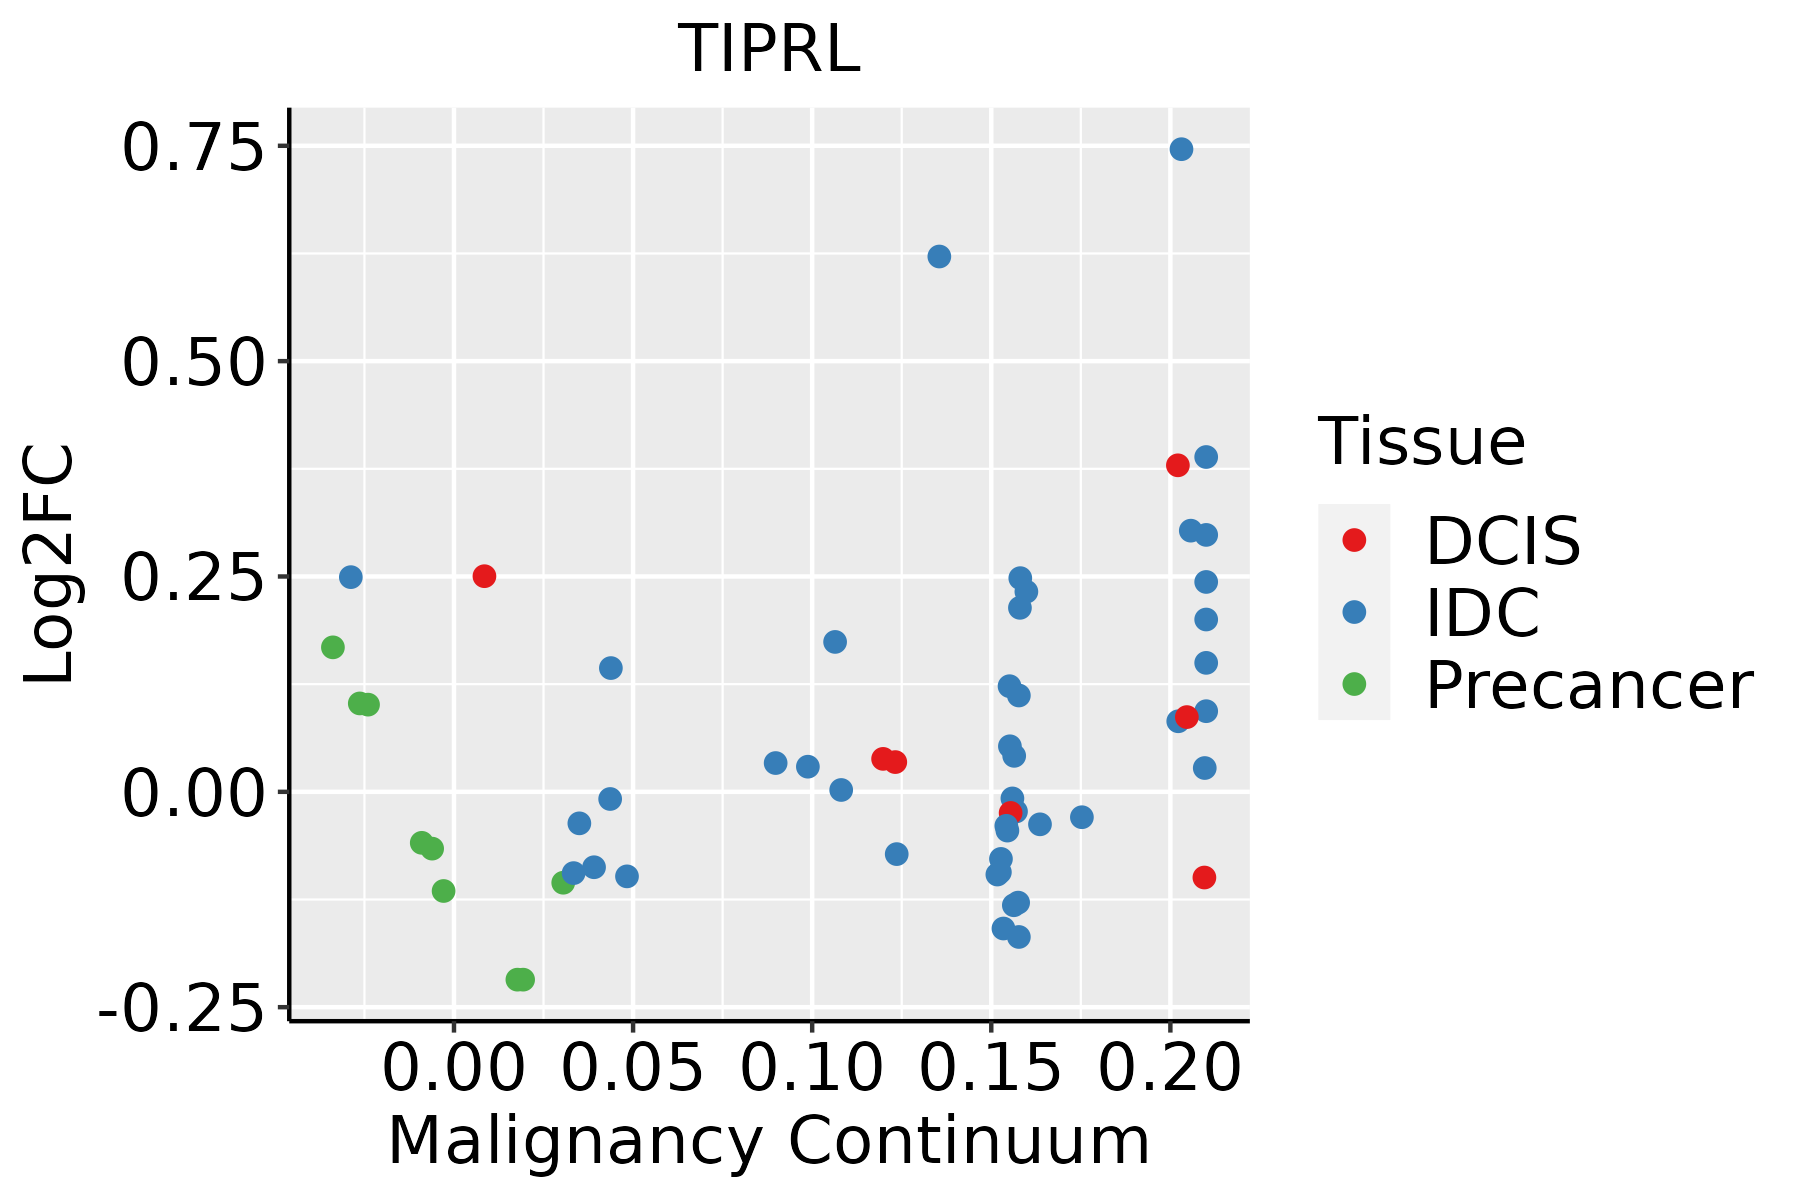
IDC: Invasive ductal carcinoma
DCIS: Ductal carcinoma in situ
Precancer(BRCA1-mut): Precancerous lesion from BRCA1 mutation carriers
EsophagusThe image shows the transcriptomic changes along malignancy continuum.log2FC in expression of this searched gene in stem-like cells from each diseased tissue sample relative to stem-like cells in normal samples in each tissue plotted against the malignancy continuum. Samples are colored based on if they are from different disease stage.
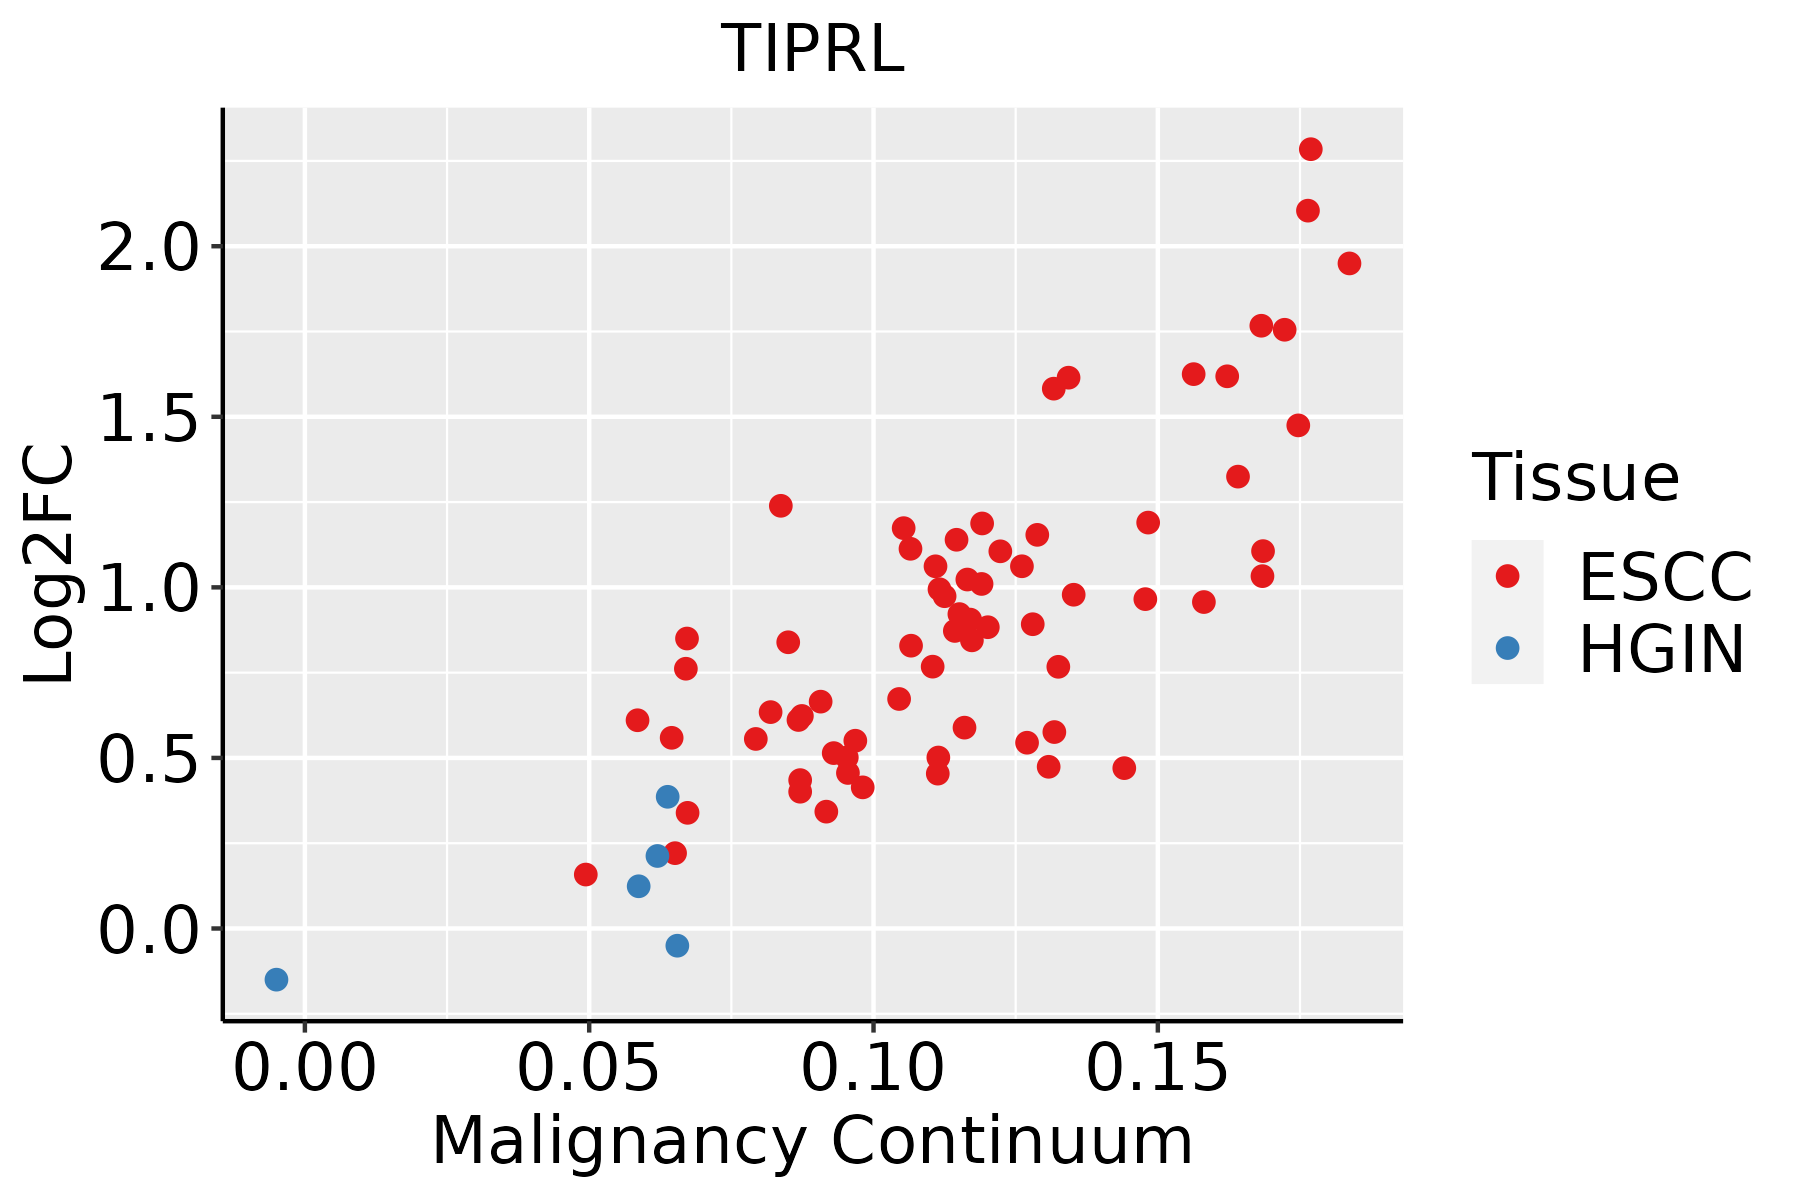
ESCC: Esophageal squamous cell carcinoma
HGIN: High-grade intraepithelial neoplasias
LGIN: Low-grade intraepithelial neoplasias
LiverThe image shows the transcriptomic changes along malignancy continuum.log2FC in expression of this searched gene in stem-like cells from each diseased tissue sample relative to stem-like cells in normal samples in each tissue plotted against the malignancy continuum. Samples are colored based on if they are from different disease stage.
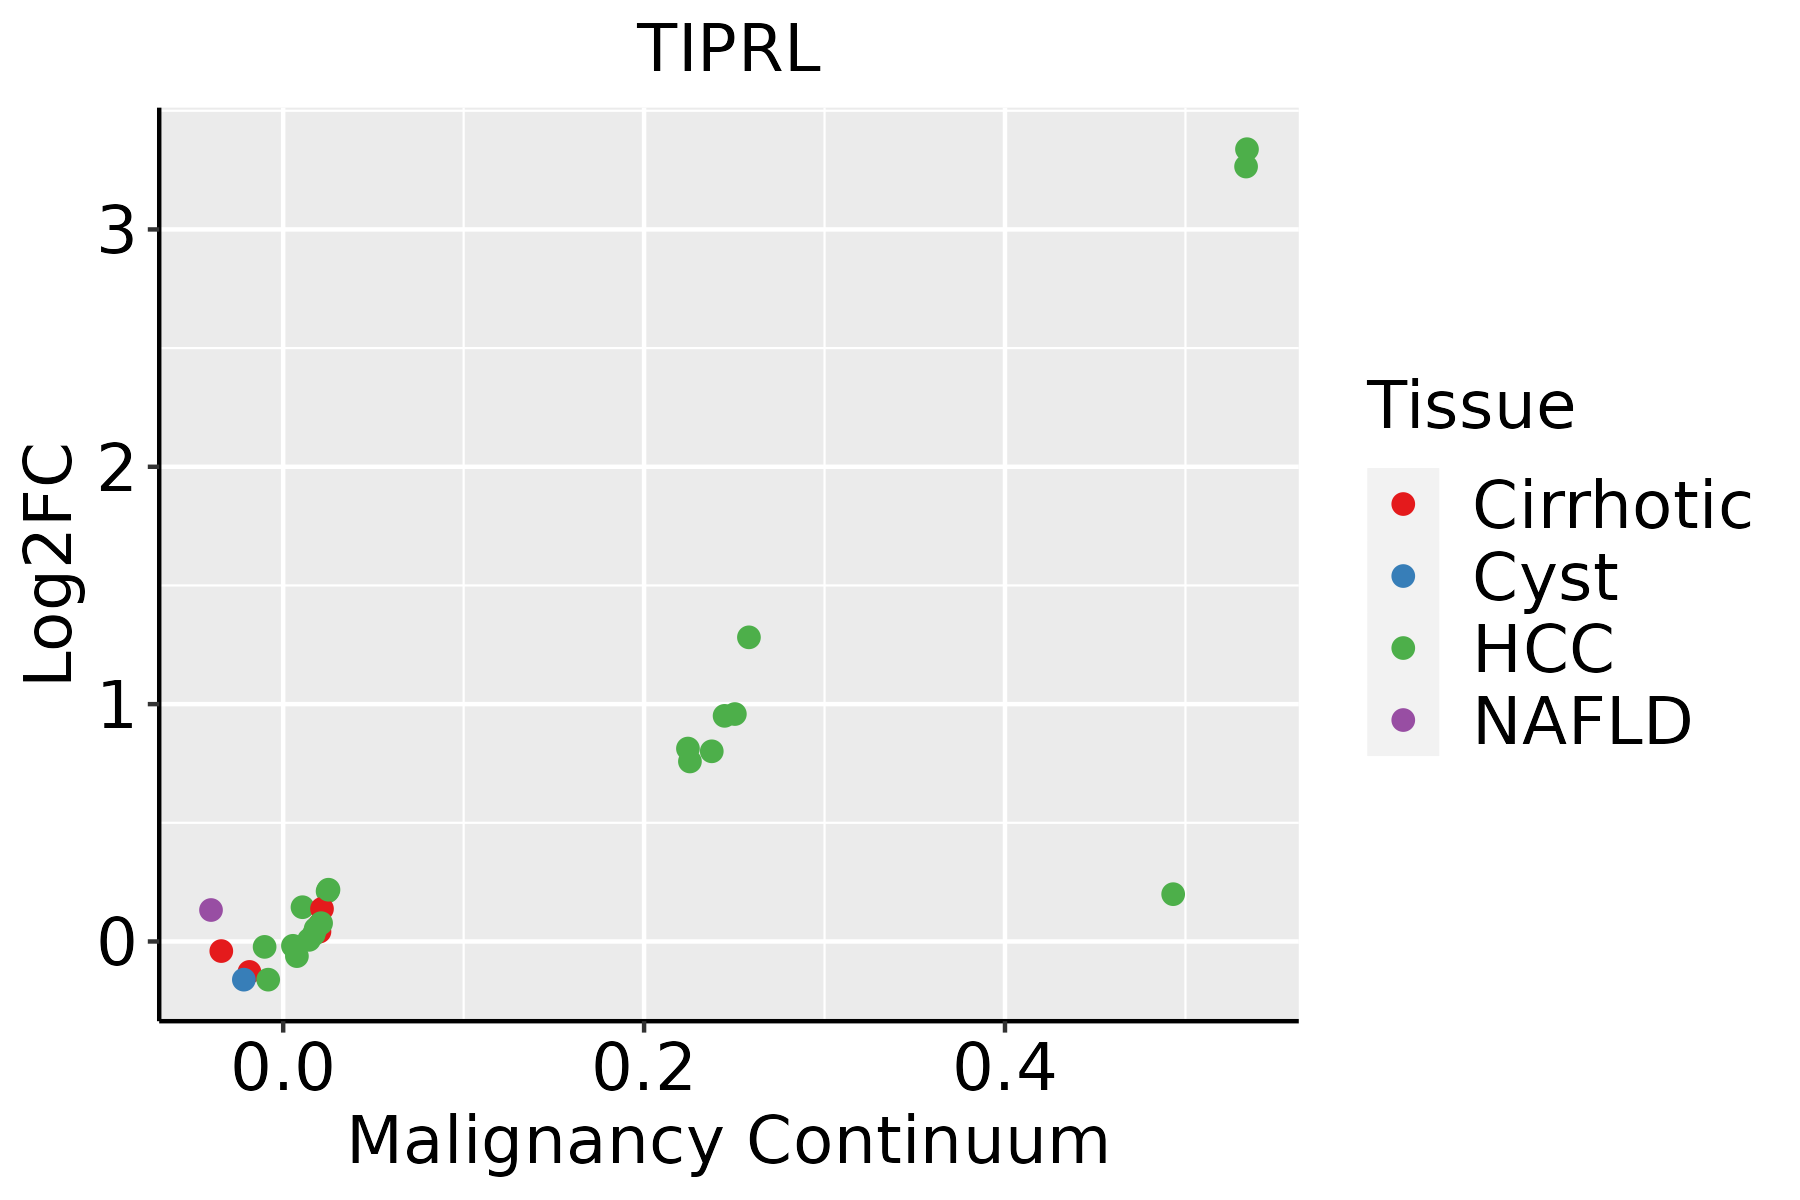
HCC: Hepatocellular carcinoma
NAFLD: Non-alcoholic fatty liver disease
LungThe image shows the transcriptomic changes along malignancy continuum.log2FC in expression of this searched gene in stem-like cells from each diseased tissue sample relative to stem-like cells in normal samples in each tissue plotted against the malignancy continuum. Samples are colored based on if they are from different disease stage.
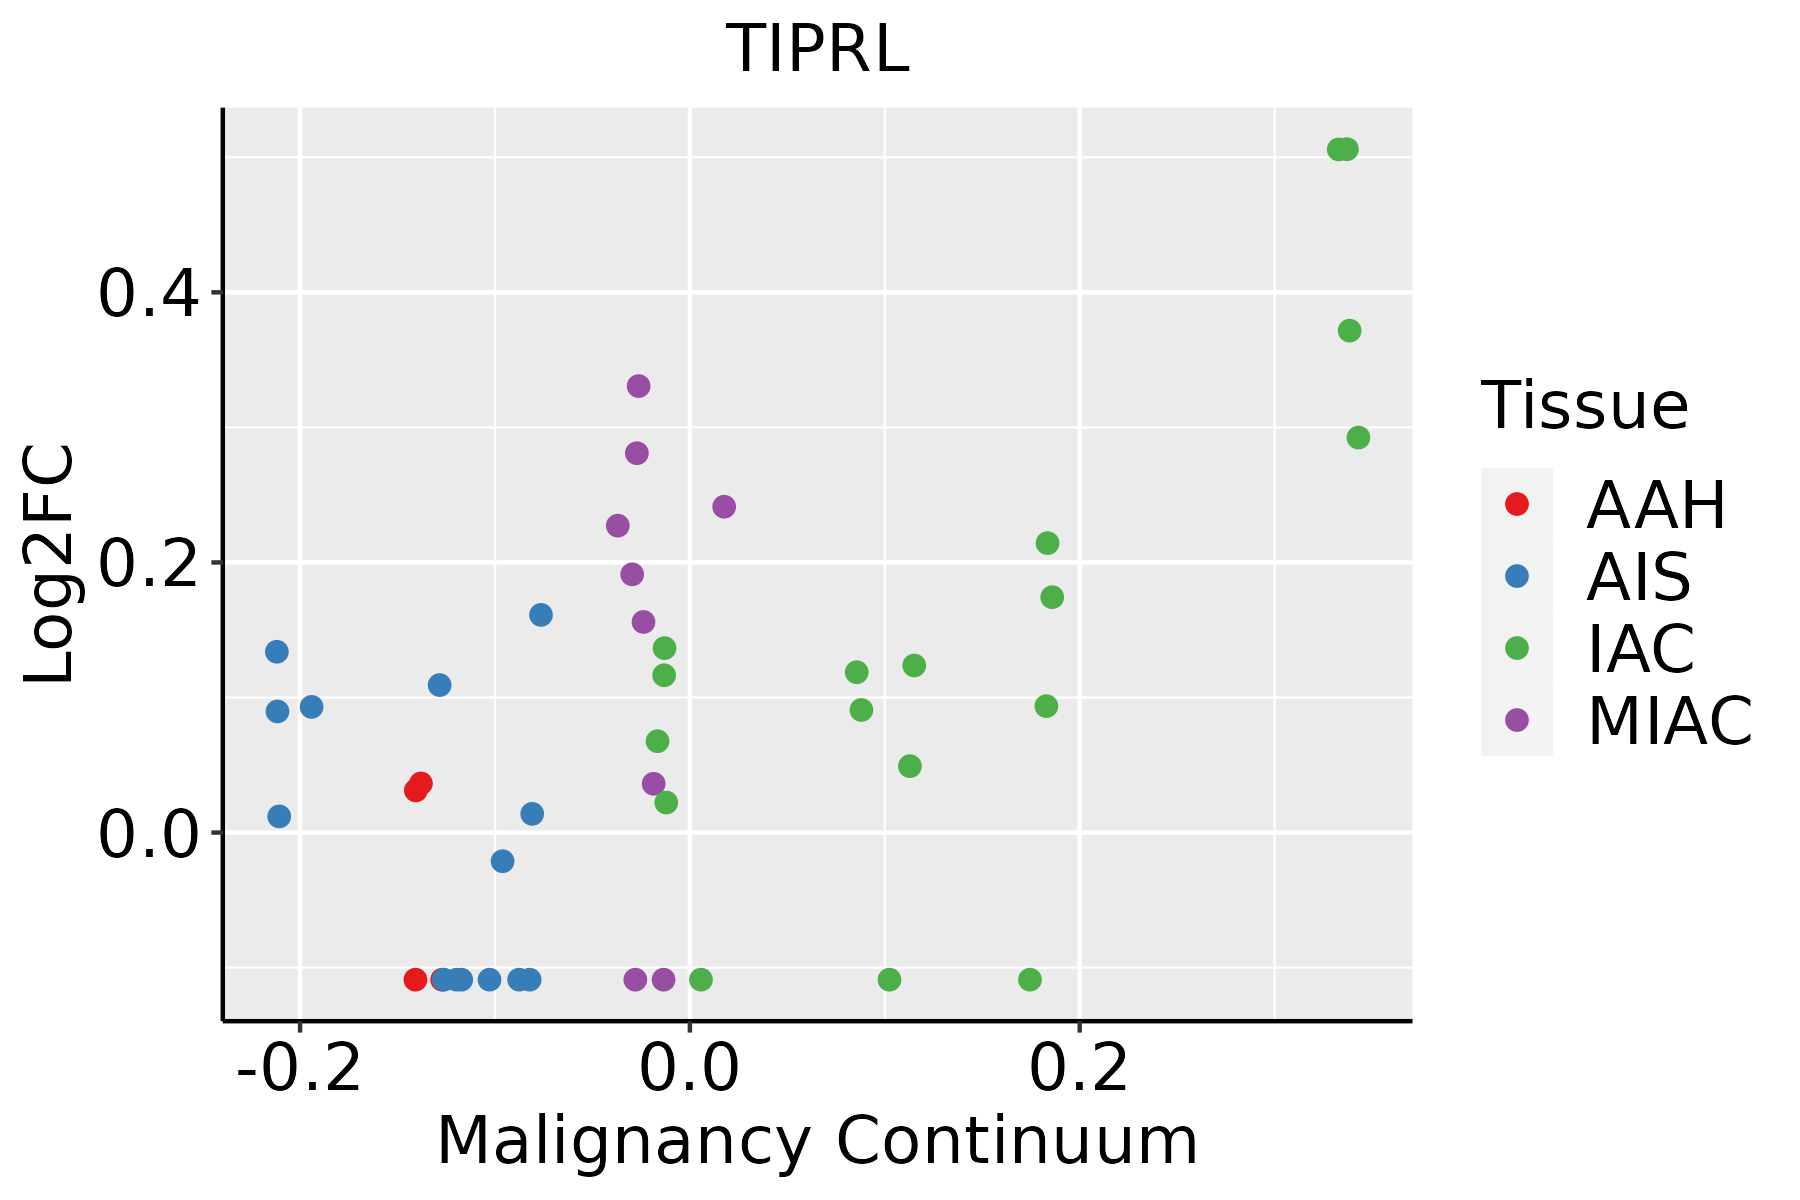
AAH: Atypical adenomatous hyperplasia
AIS: Adenocarcinoma in situ
IAC: Invasive lung adenocarcinoma
MIA: Minimally invasive adenocarcinoma
Oral CavityThe image shows the transcriptomic changes along malignancy continuum.log2FC in expression of this searched gene in stem-like cells from each diseased tissue sample relative to stem-like cells in normal samples in each tissue plotted against the malignancy continuum. Samples are colored based on if they are from different disease stage.
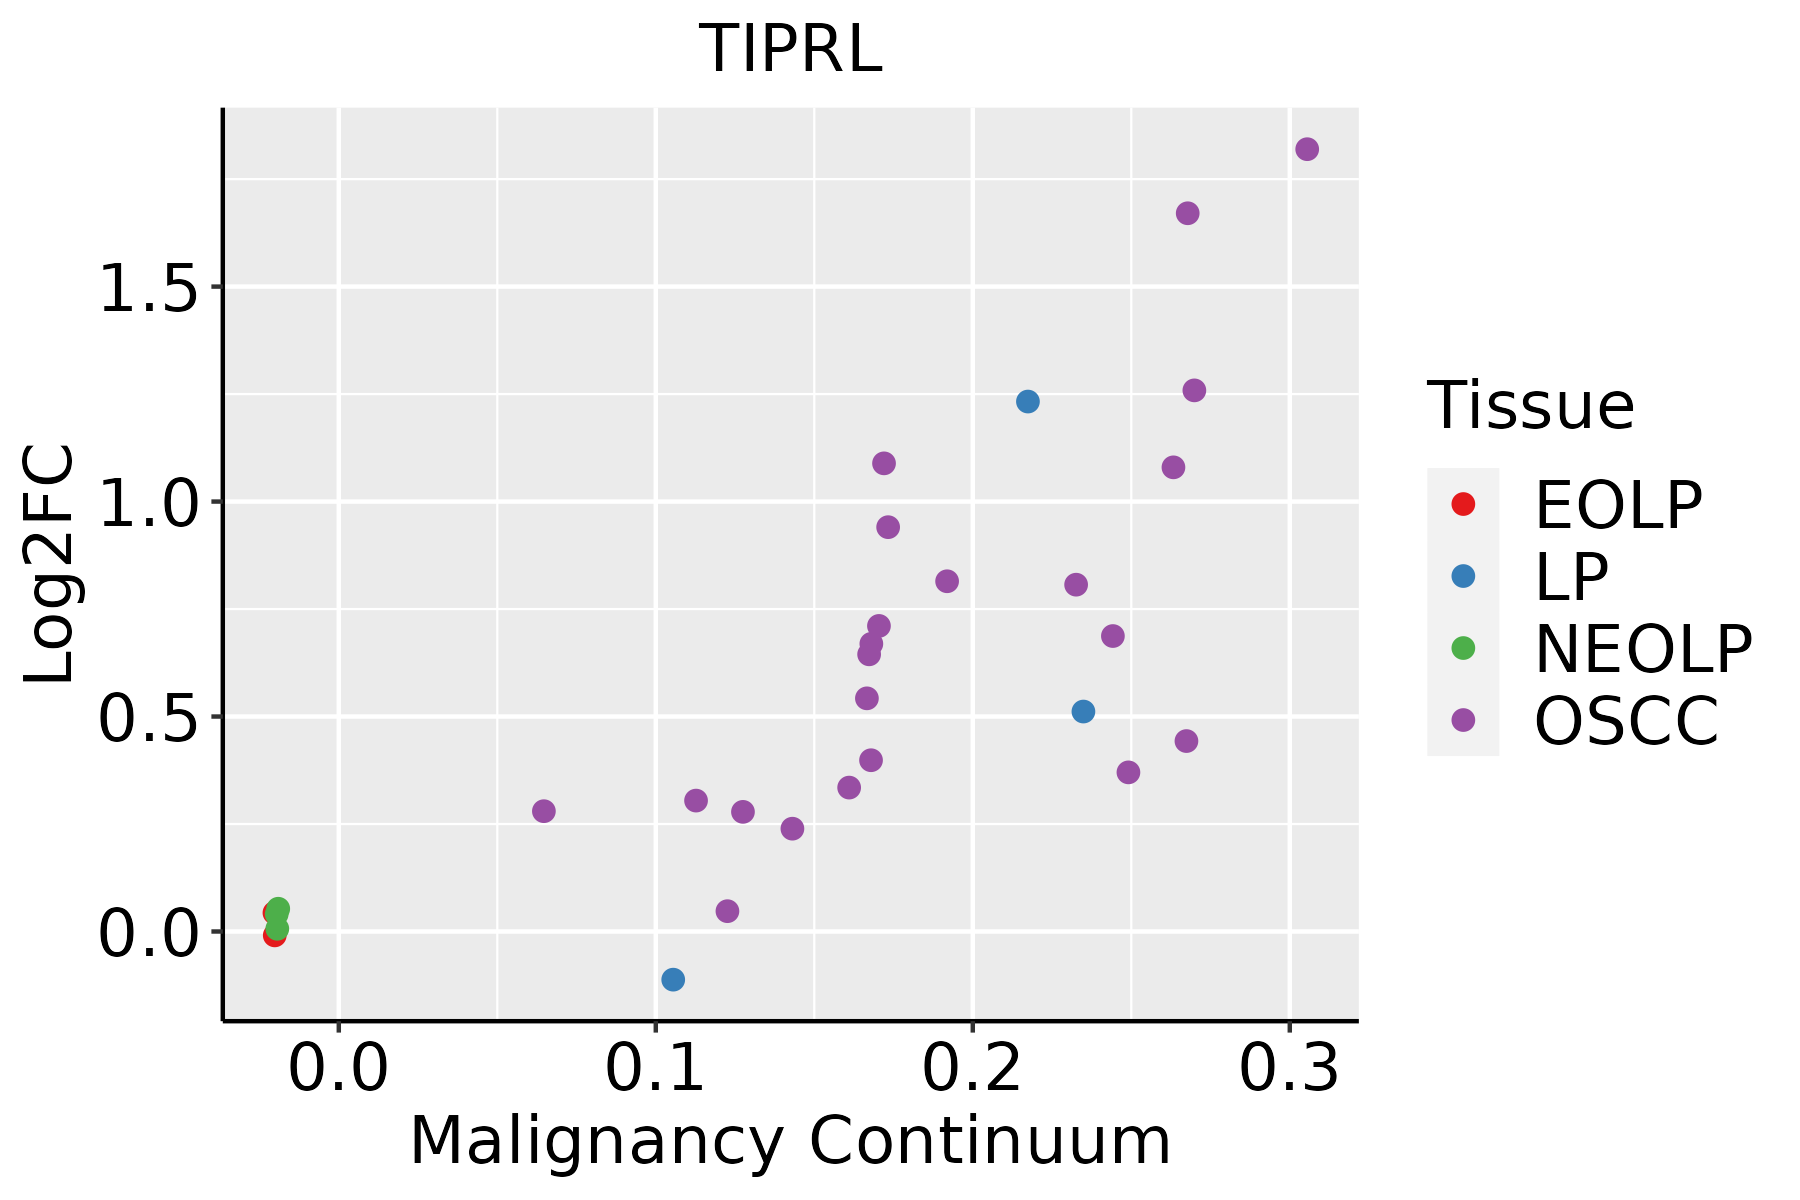
EOLP: Erosive Oral lichen planus
LP: leukoplakia
NEOLP: Non-erosive oral lichen planus
OSCC: Oral squamous cell carcinoma
SkinThe image shows the transcriptomic changes along malignancy continuum.log2FC in expression of this searched gene in stem-like cells from each diseased tissue sample relative to stem-like cells in normal samples in each tissue plotted against the malignancy continuum. Samples are colored based on if they are from different disease stage.
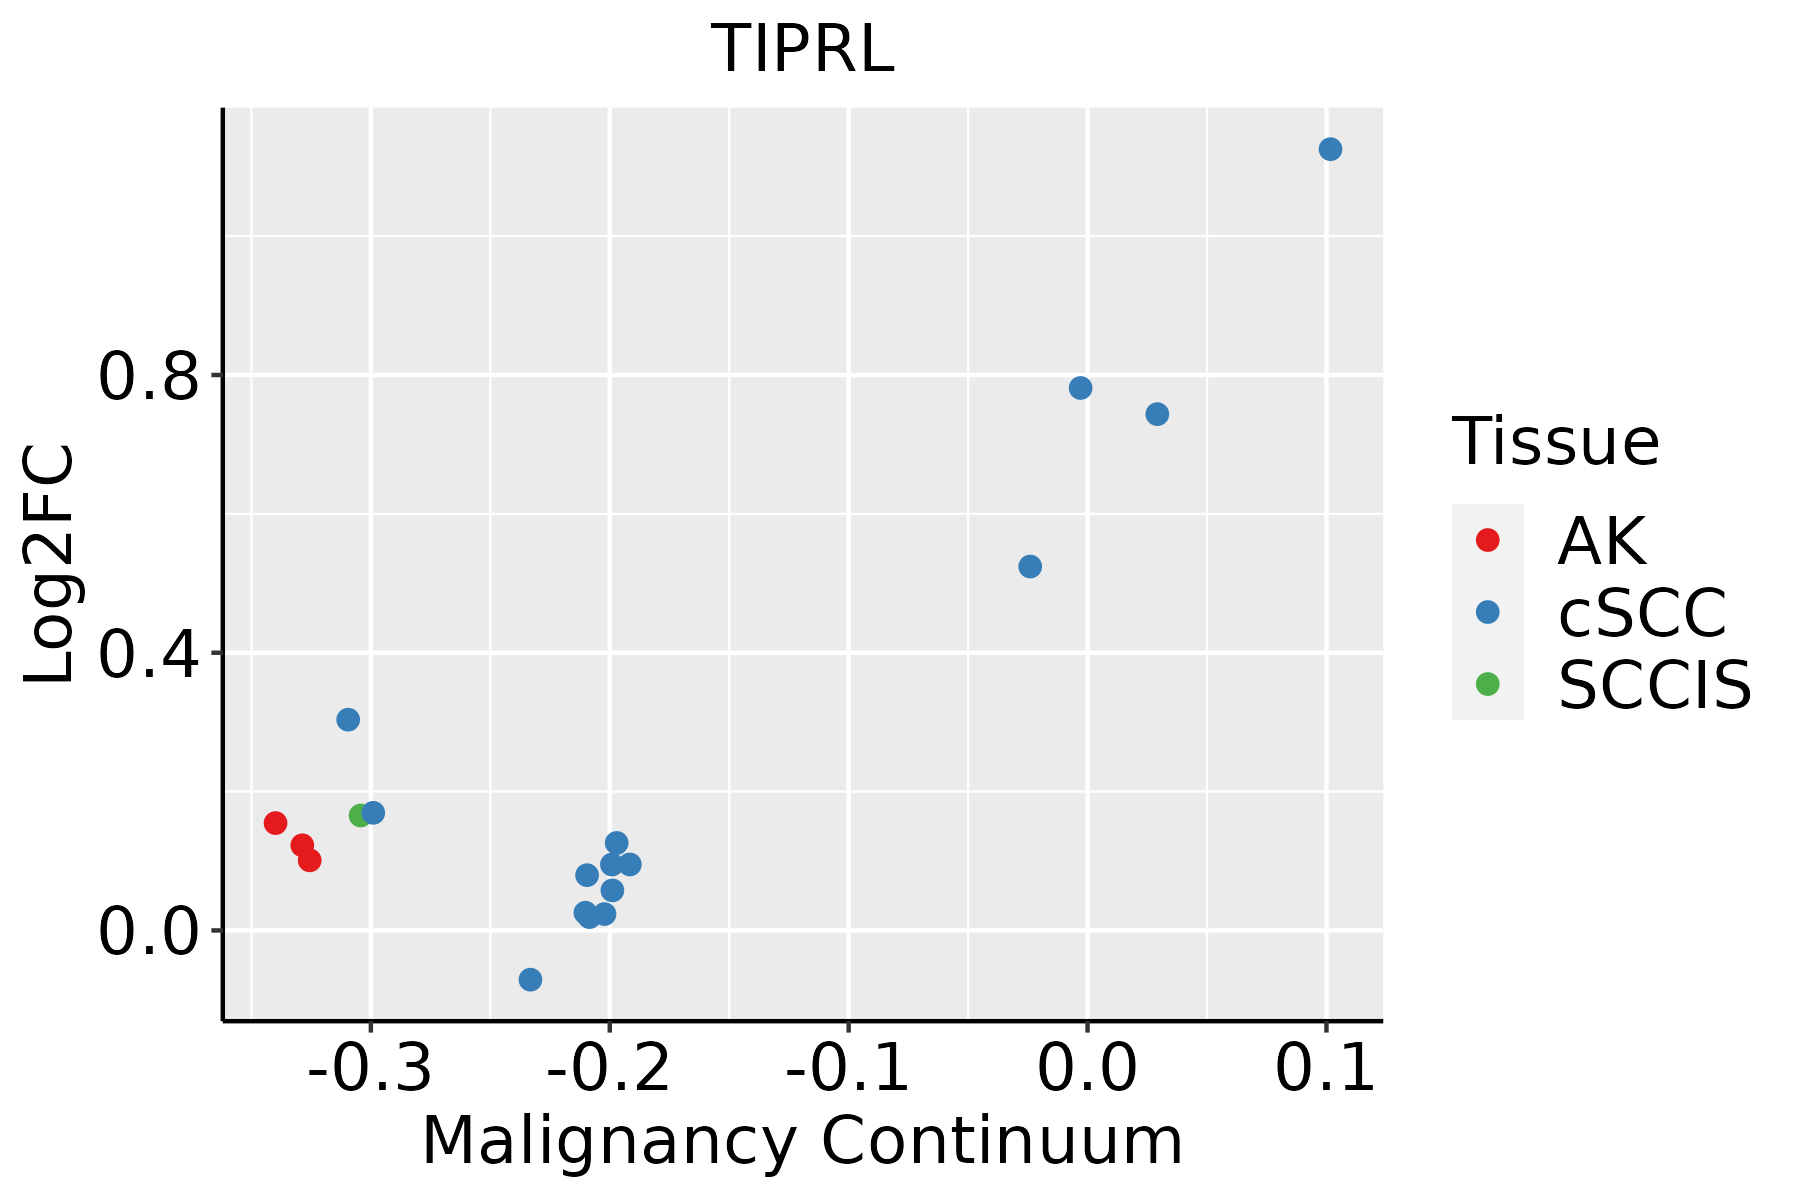
AK: Actinic keratosis
cSCC: Cutaneous squamous cell carcinoma
SCCIS:squamous cell carcinoma in situ
ThyroidThe image shows the transcriptomic changes along malignancy continuum.log2FC in expression of this searched gene in stem-like cells from each diseased tissue sample relative to stem-like cells in normal samples in each tissue plotted against the malignancy continuum. Samples are colored based on if they are from different disease stage.ATC: Anaplastic thyroid cancer
HT: Hashimoto's thyroiditis
PTC: Papillary thyroid cancer
∗log2FC in expression of this searched gene in stem-like cells from each diseased tissue sample relative to stem-like cells in normal samples in each tissue plotted against the malignancy continuum. Samples are colored based on if they are from different disease stage.

Top

Malignant transformation related pathway analysis

check buttonFind out the enriched GO biological processes and KEGG pathways involved in transition from healthy to precancer to cancer
check button Figure of enriched GO biological processes.
TissueDisease StageEnriched GO biological Processes
ColorectumADGO analysis - Figure of enriched GO biological processes: Top 15 enriched GO BP terms are showed in the bar plot of each disease state in each tissue. Each row represents a significant GO biological process which is colored according to the -log10(p.adjust).
ColorectumSERGO analysis - Figure of enriched GO biological processes: Top 15 enriched GO BP terms are showed in the bar plot of each disease state in each tissue. Each row represents a significant GO biological process which is colored according to the -log10(p.adjust).
ColorectumMSSGO analysis - Figure of enriched GO biological processes: Top 15 enriched GO BP terms are showed in the bar plot of each disease state in each tissue. Each row represents a significant GO biological process which is colored according to the -log10(p.adjust).
ColorectumMSI-HGO analysis - Figure of enriched GO biological processes: Top 15 enriched GO BP terms are showed in the bar plot of each disease state in each tissue. Each row represents a significant GO biological process which is colored according to the -log10(p.adjust).
ColorectumFAPGO analysis - Figure of enriched GO biological processes: Top 15 enriched GO BP terms are showed in the bar plot of each disease state in each tissue. Each row represents a significant GO biological process which is colored according to the -log10(p.adjust).
∗Top 15 enriched GO BP terms are showed in the bar plot of each disease state in each tissue. Each row represents a significant GO biological process which is colored according to the -log10(p.adjust).
Page: 1 2 3 4 5 6 7 8 9 

check button Enriched GO biological processes.
GO IDTissueDisease StageDescriptionGene RatioBg Ratiopvaluep.adjustCount
GO:005134613BreastIDCnegative regulation of hydrolase activity71/1434379/187231.33e-122.90e-1071
GO:003530414BreastIDCregulation of protein dephosphorylation18/143490/187231.39e-042.48e-0318
GO:00459369BreastIDCnegative regulation of phosphate metabolic process53/1434441/187237.21e-048.79e-0353
GO:00105639BreastIDCnegative regulation of phosphorus metabolic process53/1434442/187237.60e-049.25e-0353
GO:003530813BreastIDCnegative regulation of protein dephosphorylation9/143434/187238.01e-049.58e-039
GO:004366613BreastIDCregulation of phosphoprotein phosphatase activity12/143458/187231.27e-031.35e-0212
GO:00353052BreastIDCnegative regulation of dephosphorylation9/143445/187236.33e-034.47e-029
GO:005134623BreastDCISnegative regulation of hydrolase activity64/1390379/187234.32e-104.80e-0864
GO:003530423BreastDCISregulation of protein dephosphorylation18/139090/187239.33e-051.71e-0318
GO:004593614BreastDCISnegative regulation of phosphate metabolic process53/1390441/187233.48e-044.96e-0353
GO:001056314BreastDCISnegative regulation of phosphorus metabolic process53/1390442/187233.68e-045.18e-0353
GO:003530821BreastDCISnegative regulation of protein dephosphorylation9/139034/187236.39e-047.92e-039
GO:004366622BreastDCISregulation of phosphoprotein phosphatase activity12/139058/187239.71e-041.08e-0212
GO:003530511BreastDCISnegative regulation of dephosphorylation9/139045/187235.17e-033.81e-029
GO:00353039BreastDCISregulation of dephosphorylation18/1390128/187236.44e-034.58e-0218
GO:004593626EsophagusHGINnegative regulation of phosphate metabolic process89/2587441/187231.24e-042.54e-0389
GO:001056326EsophagusHGINnegative regulation of phosphorus metabolic process89/2587442/187231.34e-042.71e-0389
GO:000647017EsophagusHGINprotein dephosphorylation61/2587281/187231.86e-043.51e-0361
GO:003530425EsophagusHGINregulation of protein dephosphorylation24/258790/187239.27e-041.17e-0224
GO:00427708EsophagusHGINsignal transduction in response to DNA damage39/2587172/187231.07e-031.32e-0239
Page: 1 2 3 4 5 6 7 8 9 10 

check button Enriched KEGG pathways.
Pathway IDTissueDisease StageDescriptionGene RatioBg Ratiopvaluep.adjustqvalueCount
Page: 1 

Top

Cell-cell communication analysis

check buttonIdentification of potential cell-cell interactions between two cell types and their ligand-receptor pairs for different disease states
LigandReceptorLRpairPathwayTissueDisease Stage
Page: 1 

Top

Single-cell gene regulatory network inference analysis

check buttonFind out the significant the regulons (TFs) and the target genes of each regulon across cell types for different disease states
TFCell TypeTissueDisease StageTarget GeneRSSRegulon Activity
∗The dot plots of a searched regulon are shown for all cell subpopulations in each disease state of each tissue based on the regulon specific score inferred using pySCENIC and by calculating the average expression.
Page: 1 

Top

Somatic mutation of malignant transformation related genes

check buttonAnnotation of somatic variants for genes involved in malignant transformation
Hugo SymbolVariant ClassVariant ClassificationdbSNP RSHGVScHGVSpHGVSp ShortSWISSPROTBIOTYPESIFTPolyPhenTumor Sample BarcodeTissueHistologySexAgeStageTherapy TypesDrugsOutcome
TIPRLinsertionFrame_Shift_Insnovelc.751_752insACp.Lys251AsnfsTer3p.K251Nfs*3O75663protein_codingTCGA-A2-A04Y-01Breastbreast invasive carcinomaFemale<65I/IIChemotherapycytoxanSD
TIPRLinsertionIn_Frame_Insnovelc.753_754insCTCAAGCCTTGTp.Leu252_Ile253insLysProCysLeup.L252_I253insKPCLO75663protein_codingTCGA-A2-A04Y-01Breastbreast invasive carcinomaFemale<65I/IIChemotherapycytoxanSD
TIPRLSNVMissense_Mutationrs760294386c.215C>Tp.Ala72Valp.A72VO75663protein_codingdeleterious(0)probably_damaging(0.996)TCGA-AA-3977-01Colorectumcolon adenocarcinomaMale>=65I/IIUnknownUnknownSD
TIPRLSNVMissense_Mutationnovelc.277N>Ap.Glu93Lysp.E93KO75663protein_codingdeleterious(0.03)benign(0.356)TCGA-EI-6917-01Colorectumrectum adenocarcinomaMale<65III/IVChemotherapy5fluorouracil+oxaciplatina+l-folinianSD
TIPRLSNVMissense_Mutationnovelc.201C>Ap.Phe67Leup.F67LO75663protein_codingdeleterious(0)probably_damaging(0.999)TCGA-AP-A1E0-01Endometriumuterine corpus endometrioid carcinomaFemale<65III/IVChemotherapypaclitaxelSD
TIPRLSNVMissense_Mutationnovelc.371C>Tp.Ser124Phep.S124FO75663protein_codingdeleterious(0.02)benign(0.353)TCGA-AX-A1CE-01Endometriumuterine corpus endometrioid carcinomaFemale<65I/IIUnspecificPaclitaxelSD
TIPRLSNVMissense_Mutationnovelc.491N>Ap.Gly164Glup.G164EO75663protein_codingdeleterious(0)probably_damaging(1)TCGA-B5-A3FA-01Endometriumuterine corpus endometrioid carcinomaFemale>=65I/IIUnknownUnknownSD
TIPRLSNVMissense_Mutationnovelc.593A>Gp.Asp198Glyp.D198GO75663protein_codingdeleterious(0)probably_damaging(1)TCGA-FI-A2D5-01Endometriumuterine corpus endometrioid carcinomaFemale<65III/IVChemotherapycarboplatinumPD
TIPRLSNVMissense_Mutationc.519N>Cp.Arg173Serp.R173SO75663protein_codingdeleterious(0)probably_damaging(0.999)TCGA-DD-A73C-01Liverliver hepatocellular carcinomaFemale>=65III/IVUnknownUnknownPD
TIPRLSNVMissense_Mutationc.94N>Tp.Asp32Tyrp.D32YO75663protein_codingtolerated(0.09)possibly_damaging(0.62)TCGA-44-7669-01Lunglung adenocarcinomaMale<65I/IIChemotherapyalimtaPD
Page: 1 2 

Top

Related drugs of malignant transformation related genes

check buttonIdentification of chemicals and drugs interact with genes involved in malignant transfromation
(DGIdb 4.0)
Entrez IDSymbolCategoryInteraction TypesDrug Claim NameDrug NamePMIDs
Page: 1