Schematic overview of the cellular and molecular mechanisms involved in the cancer progression, including the proposed cellular and molecular mechanisms in cancer cells trajectory. AT1: alveolar type 1 cells; AT2: alveolar type 2 cells; AAH: atypical adenomatous hyperplasia; AIS: adenocarcinoma in situ; MIA: minimally invasive adenocarcinoma; IA: invasive adenocarcinoma; EMT: epithelial-mesenchymal transition

Home

Download

Statistics

Help

Contact

Center for Computational Systems Medicine
leaf

Gene summary

leaf

Malignant transformation analysis

leaf

Malignant transformation related pathway analysis

leaf

Cell-cell communication analysis

leaf

Single-cell gene regulatory network inference analysis

leaf

Somatic mutation of malignant transformation related genes

leaf

Related drugs of malignant transformation related genes

Gene: TIMM17B

Gene summary for TIMM17B

check button Gene summary.

Gene informationSpeciesHuman
Gene symbol

TIMM17B

Gene ID

10245

Gene nametranslocase of inner mitochondrial membrane 17B
Gene AliasDXS9822
CytomapXp11.23
Gene Typeprotein-coding
GO ID

GO:0006605

UniProtAcc

O60830


Top

Malignant transformation analysis

check button Identification of the aberrant gene expression in precancerous and cancerous lesions by comparing the gene expression of stem-like cells in diseased tissues with normal stem cells
check button Malignant transformation involving gene list.
Entrez IDSymbolReplicatesSpeciesOrganTissueAdj P-valueLog2FCMalignancy
10245TIMM17BP38T-EHumanEsophagusESCC9.77e-153.69e-010.127
10245TIMM17BP39T-EHumanEsophagusESCC1.23e-215.96e-010.0894
10245TIMM17BP40T-EHumanEsophagusESCC1.35e-248.25e-010.109
10245TIMM17BP42T-EHumanEsophagusESCC3.77e-235.62e-010.1175
10245TIMM17BP44T-EHumanEsophagusESCC1.34e-175.36e-010.1096
10245TIMM17BP47T-EHumanEsophagusESCC2.85e-471.04e+000.1067
10245TIMM17BP48T-EHumanEsophagusESCC7.40e-325.97e-010.0959
10245TIMM17BP49T-EHumanEsophagusESCC2.60e-121.28e+000.1768
10245TIMM17BP52T-EHumanEsophagusESCC2.68e-441.19e+000.1555
10245TIMM17BP54T-EHumanEsophagusESCC2.11e-206.24e-010.0975
10245TIMM17BP56T-EHumanEsophagusESCC5.01e-091.45e+000.1613
10245TIMM17BP57T-EHumanEsophagusESCC4.64e-235.35e-010.0926
10245TIMM17BP61T-EHumanEsophagusESCC2.43e-299.63e-010.099
10245TIMM17BP62T-EHumanEsophagusESCC9.55e-531.12e+000.1302
10245TIMM17BP65T-EHumanEsophagusESCC5.62e-235.11e-010.0978
10245TIMM17BP74T-EHumanEsophagusESCC5.33e-381.03e+000.1479
10245TIMM17BP75T-EHumanEsophagusESCC2.26e-541.15e+000.1125
10245TIMM17BP76T-EHumanEsophagusESCC5.98e-471.02e+000.1207
10245TIMM17BP79T-EHumanEsophagusESCC4.81e-902.07e+000.1154
10245TIMM17BP80T-EHumanEsophagusESCC1.78e-612.00e+000.155
Page: 1 2 3 4 5 6 7 

check button Transcriptomic changes along malignancy continuum.
TissueExpression DynamicsAbbreviation
Colorectum (GSE201348)The image shows the transcriptomic changes along malignancy continuum.log2FC in expression of this searched gene in stem-like cells from each diseased tissue sample relative to stem-like cells in normal samples in each tissue plotted against the malignancy continuum. Samples are colored based on if they are from different disease stage.FAP: Familial adenomatous polyposis
CRC: Colorectal cancer
Colorectum (HTA11)The image shows the transcriptomic changes along malignancy continuum.log2FC in expression of this searched gene in stem-like cells from each diseased tissue sample relative to stem-like cells in normal samples in each tissue plotted against the malignancy continuum. Samples are colored based on if they are from different disease stage.AD: Adenomas
SER: Sessile serrated lesions
MSI-H: Microsatellite-high colorectal cancer
MSS: Microsatellite stable colorectal cancer
EsophagusThe image shows the transcriptomic changes along malignancy continuum.log2FC in expression of this searched gene in stem-like cells from each diseased tissue sample relative to stem-like cells in normal samples in each tissue plotted against the malignancy continuum. Samples are colored based on if they are from different disease stage.
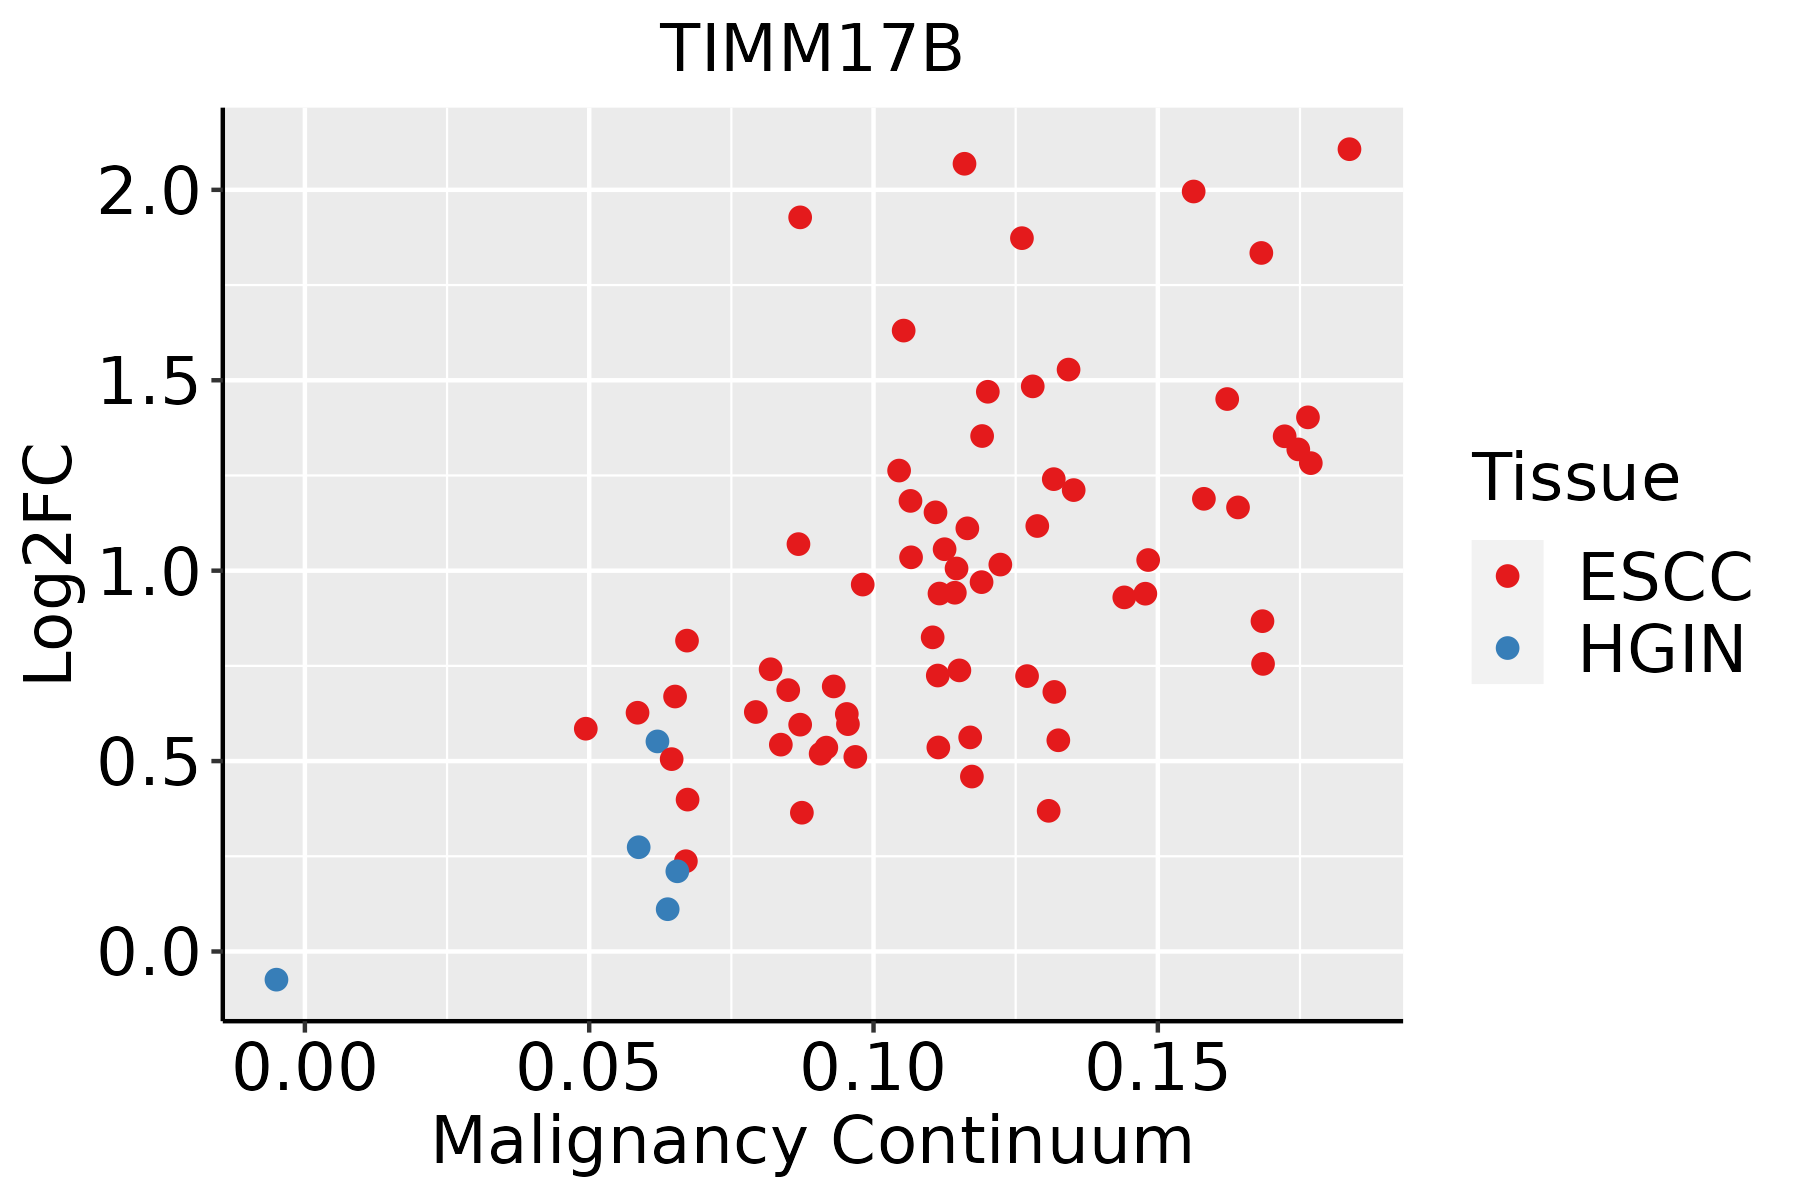
ESCC: Esophageal squamous cell carcinoma
HGIN: High-grade intraepithelial neoplasias
LGIN: Low-grade intraepithelial neoplasias
LiverThe image shows the transcriptomic changes along malignancy continuum.log2FC in expression of this searched gene in stem-like cells from each diseased tissue sample relative to stem-like cells in normal samples in each tissue plotted against the malignancy continuum. Samples are colored based on if they are from different disease stage.HCC: Hepatocellular carcinoma
NAFLD: Non-alcoholic fatty liver disease
Oral CavityThe image shows the transcriptomic changes along malignancy continuum.log2FC in expression of this searched gene in stem-like cells from each diseased tissue sample relative to stem-like cells in normal samples in each tissue plotted against the malignancy continuum. Samples are colored based on if they are from different disease stage.
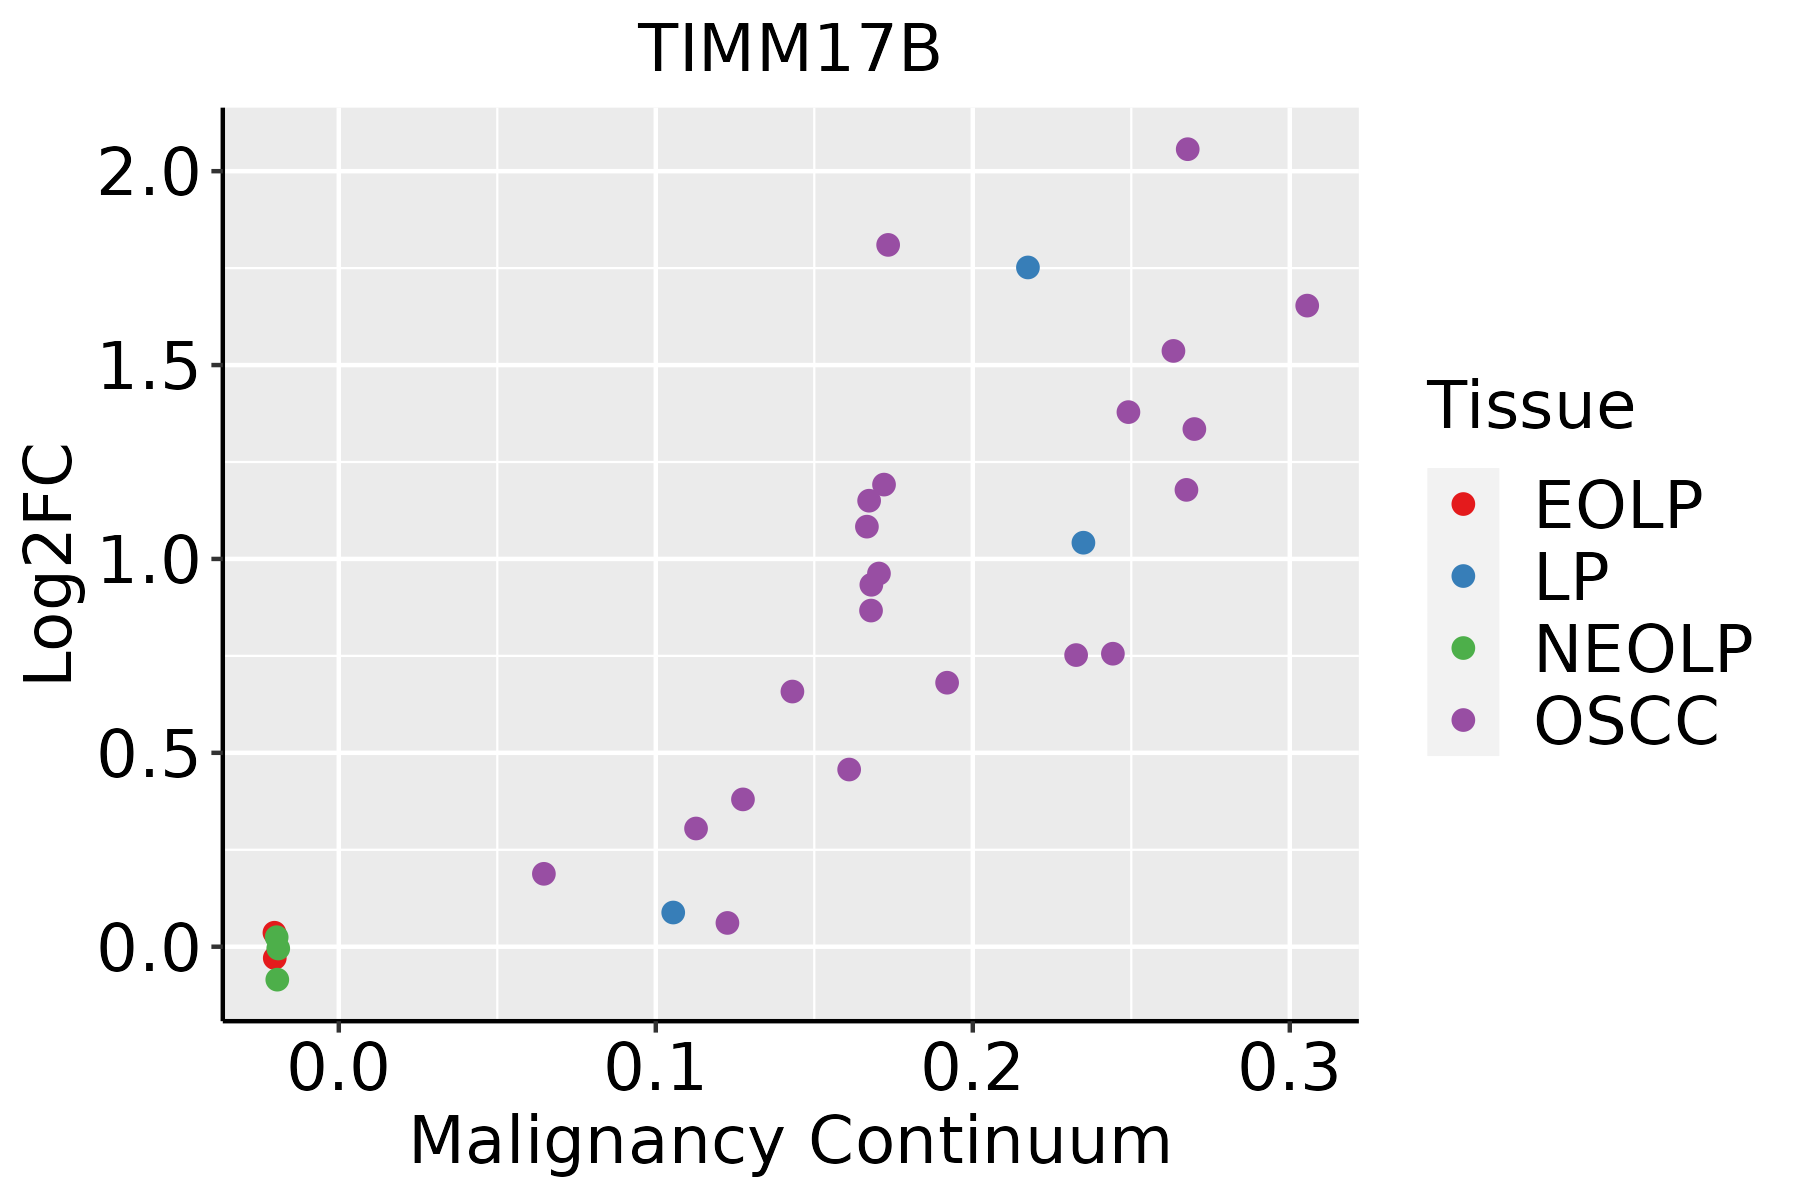
EOLP: Erosive Oral lichen planus
LP: leukoplakia
NEOLP: Non-erosive oral lichen planus
OSCC: Oral squamous cell carcinoma
ProstateThe image shows the transcriptomic changes along malignancy continuum.log2FC in expression of this searched gene in stem-like cells from each diseased tissue sample relative to stem-like cells in normal samples in each tissue plotted against the malignancy continuum. Samples are colored based on if they are from different disease stage.BPH: Benign Prostatic Hyperplasia
SkinThe image shows the transcriptomic changes along malignancy continuum.log2FC in expression of this searched gene in stem-like cells from each diseased tissue sample relative to stem-like cells in normal samples in each tissue plotted against the malignancy continuum. Samples are colored based on if they are from different disease stage.
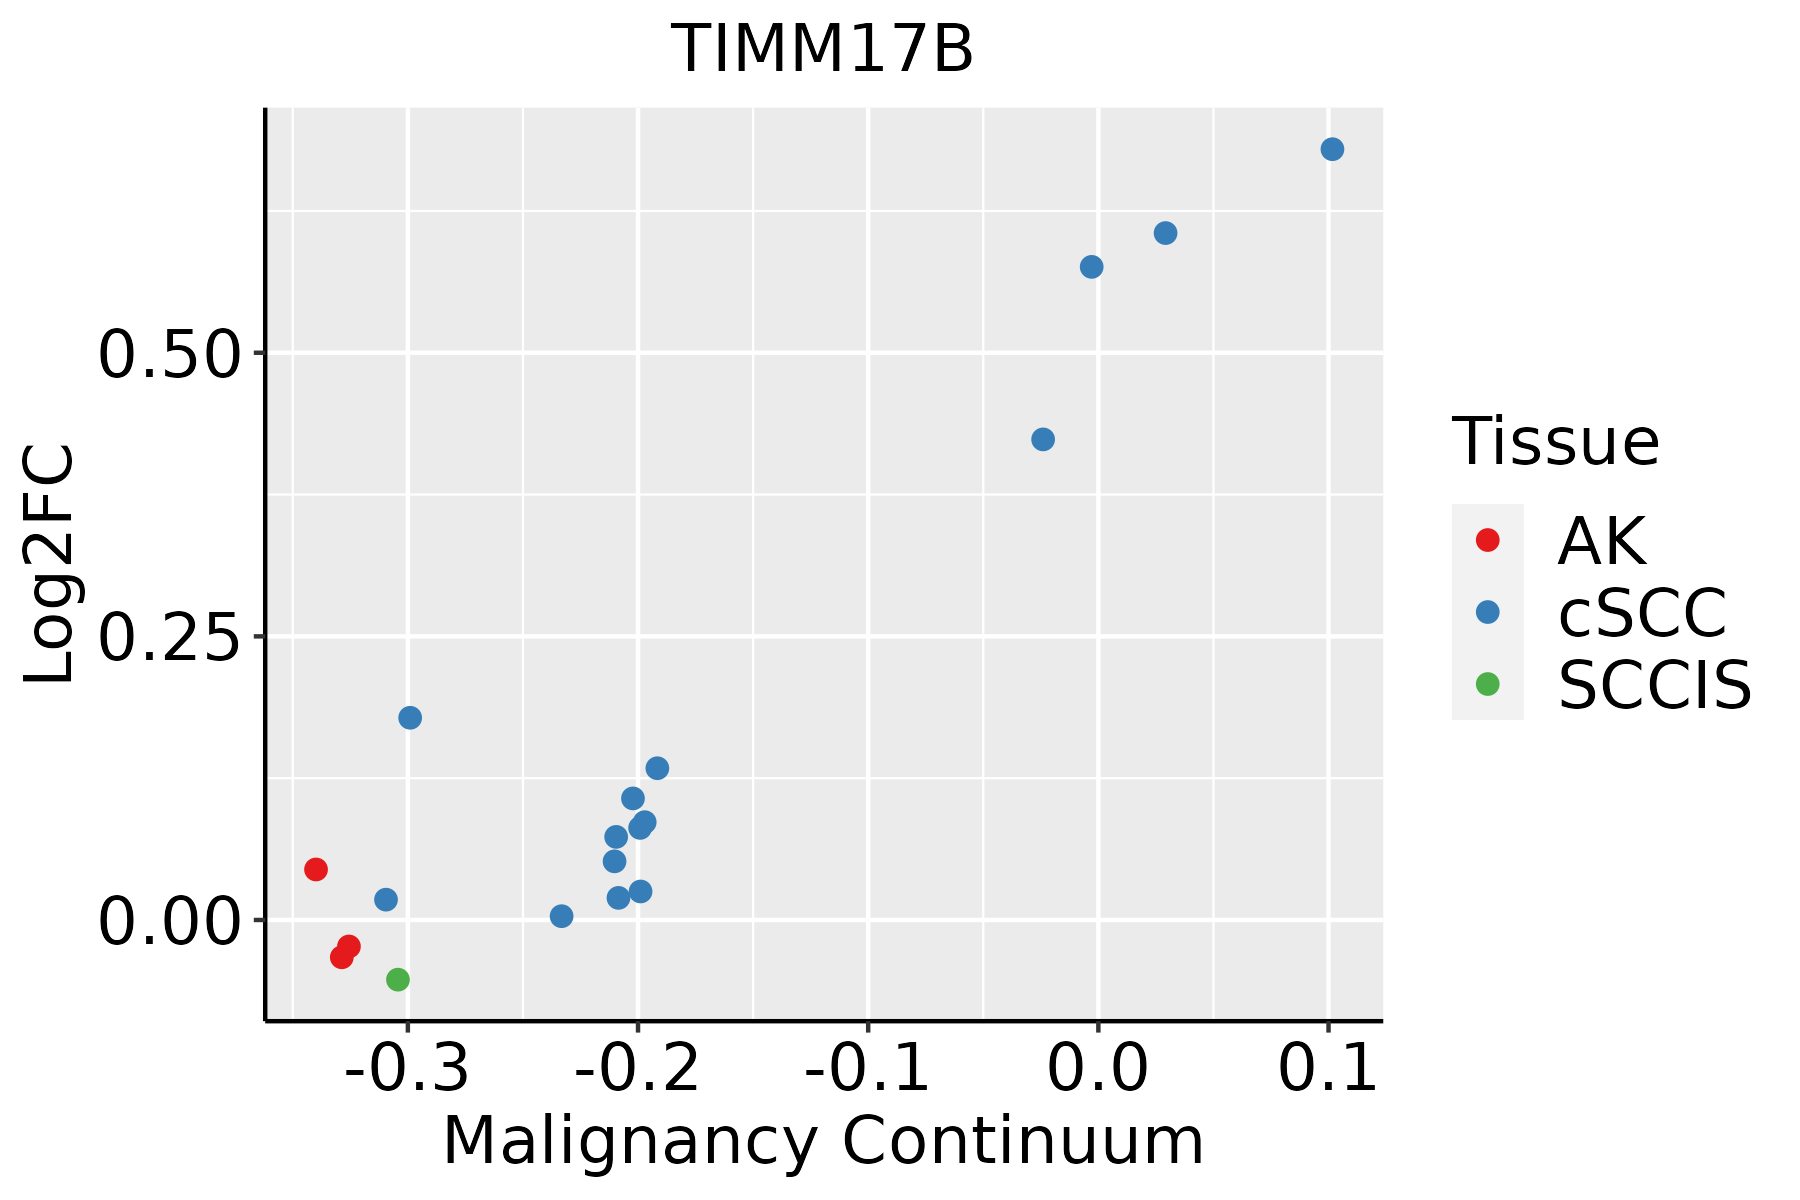
AK: Actinic keratosis
cSCC: Cutaneous squamous cell carcinoma
SCCIS:squamous cell carcinoma in situ
∗log2FC in expression of this searched gene in stem-like cells from each diseased tissue sample relative to stem-like cells in normal samples in each tissue plotted against the malignancy continuum. Samples are colored based on if they are from different disease stage.

Top

Malignant transformation related pathway analysis

check buttonFind out the enriched GO biological processes and KEGG pathways involved in transition from healthy to precancer to cancer
check button Figure of enriched GO biological processes.
TissueDisease StageEnriched GO biological Processes
ColorectumADGO analysis - Figure of enriched GO biological processes: Top 15 enriched GO BP terms are showed in the bar plot of each disease state in each tissue. Each row represents a significant GO biological process which is colored according to the -log10(p.adjust).
ColorectumSERGO analysis - Figure of enriched GO biological processes: Top 15 enriched GO BP terms are showed in the bar plot of each disease state in each tissue. Each row represents a significant GO biological process which is colored according to the -log10(p.adjust).
ColorectumMSSGO analysis - Figure of enriched GO biological processes: Top 15 enriched GO BP terms are showed in the bar plot of each disease state in each tissue. Each row represents a significant GO biological process which is colored according to the -log10(p.adjust).
ColorectumMSI-HGO analysis - Figure of enriched GO biological processes: Top 15 enriched GO BP terms are showed in the bar plot of each disease state in each tissue. Each row represents a significant GO biological process which is colored according to the -log10(p.adjust).
ColorectumFAPGO analysis - Figure of enriched GO biological processes: Top 15 enriched GO BP terms are showed in the bar plot of each disease state in each tissue. Each row represents a significant GO biological process which is colored according to the -log10(p.adjust).
∗Top 15 enriched GO BP terms are showed in the bar plot of each disease state in each tissue. Each row represents a significant GO biological process which is colored according to the -log10(p.adjust).
Page: 1 2 3 4 5 6 7 8 9 

check button Enriched GO biological processes.
GO IDTissueDisease StageDescriptionGene RatioBg Ratiopvaluep.adjustCount
GO:0006839ColorectumADmitochondrial transport102/3918254/187231.87e-123.08e-10102
GO:0072594ColorectumADestablishment of protein localization to organelle148/3918422/187237.95e-121.04e-09148
GO:1990542ColorectumADmitochondrial transmembrane transport47/3918102/187231.09e-086.52e-0747
GO:0006605ColorectumADprotein targeting105/3918314/187231.39e-076.44e-06105
GO:0070585ColorectumADprotein localization to mitochondrion51/3918125/187233.40e-071.33e-0551
GO:0072655ColorectumADestablishment of protein localization to mitochondrion47/3918120/187233.76e-061.04e-0447
GO:0017038ColorectumADprotein import67/3918206/187236.34e-051.05e-0367
GO:0006626ColorectumADprotein targeting to mitochondrion37/3918100/187231.58e-042.20e-0337
GO:0071806ColorectumADprotein transmembrane transport21/391859/187236.58e-034.08e-0221
GO:00068391ColorectumSERmitochondrial transport87/2897254/187237.91e-143.03e-1187
GO:19905421ColorectumSERmitochondrial transmembrane transport42/2897102/187233.65e-104.77e-0842
GO:00725941ColorectumSERestablishment of protein localization to organelle111/2897422/187234.98e-094.49e-07111
GO:00705851ColorectumSERprotein localization to mitochondrion42/2897125/187233.75e-071.98e-0542
GO:00726551ColorectumSERestablishment of protein localization to mitochondrion38/2897120/187236.60e-062.33e-0438
GO:00066051ColorectumSERprotein targeting76/2897314/187233.19e-058.47e-0476
GO:00066261ColorectumSERprotein targeting to mitochondrion31/2897100/187237.09e-051.61e-0331
GO:00170381ColorectumSERprotein import49/2897206/187231.12e-031.29e-0249
GO:00718061ColorectumSERprotein transmembrane transport17/289759/187236.64e-034.69e-0217
GO:00725942ColorectumMSSestablishment of protein localization to organelle139/3467422/187235.75e-131.12e-10139
GO:00068392ColorectumMSSmitochondrial transport93/3467254/187236.14e-129.82e-1093
Page: 1 2 3 4 5 6 7 

check button Enriched KEGG pathways.
Pathway IDTissueDisease StageDescriptionGene RatioBg Ratiopvaluep.adjustqvalueCount
Page: 1 

Top

Cell-cell communication analysis

check buttonIdentification of potential cell-cell interactions between two cell types and their ligand-receptor pairs for different disease states
LigandReceptorLRpairPathwayTissueDisease Stage
Page: 1 

Top

Single-cell gene regulatory network inference analysis

check buttonFind out the significant the regulons (TFs) and the target genes of each regulon across cell types for different disease states
TFCell TypeTissueDisease StageTarget GeneRSSRegulon Activity
∗The dot plots of a searched regulon are shown for all cell subpopulations in each disease state of each tissue based on the regulon specific score inferred using pySCENIC and by calculating the average expression.
Page: 1 

Top

Somatic mutation of malignant transformation related genes

check buttonAnnotation of somatic variants for genes involved in malignant transformation
Hugo SymbolVariant ClassVariant ClassificationdbSNP RSHGVScHGVSpHGVSp ShortSWISSPROTBIOTYPESIFTPolyPhenTumor Sample BarcodeTissueHistologySexAgeStageTherapy TypesDrugsOutcome
TIMM17BSNVMissense_Mutationc.542N>Cp.Ile181Thrp.I181TO60830protein_codingdeleterious(0)probably_damaging(0.969)TCGA-A2-A0T0-01Breastbreast invasive carcinomaFemale<65I/IIChemotherapytaxotereSD
TIMM17BinsertionFrame_Shift_Insnovelc.225_226insTGTAAACATTTGTCAACTCCCCATAAAGATGAAGGGAATGTTGp.Thr76CysfsTer40p.T76Cfs*40O60830protein_codingTCGA-B6-A0IA-01Breastbreast invasive carcinomaFemale<65I/IIUnknownUnknownSD
TIMM17BinsertionIn_Frame_Insnovelc.89_97dupTCTTCCAGGp.Val30_Gln32dupp.V30_Q32dupO60830protein_codingTCGA-UL-AAZ6-01Breastbreast invasive carcinomaFemale>=65I/IIChemotherapyherceptinSD
TIMM17BSNVMissense_Mutationc.466N>Tp.Arg156Cysp.R156CO60830protein_codingdeleterious(0.02)benign(0.233)TCGA-CM-6162-01Colorectumcolon adenocarcinomaFemale<65III/IVChemotherapyoxaliplatinSD
TIMM17BSNVMissense_Mutationnovelc.13G>Ap.Ala5Thrp.A5TO60830protein_codingtolerated(0.39)possibly_damaging(0.578)TCGA-A5-A0G1-01Endometriumuterine corpus endometrioid carcinomaFemale>=65I/IIUnknownUnknownSD
TIMM17BSNVMissense_Mutationnovelc.112N>Tp.Arg38Cysp.R38CO60830protein_codingdeleterious(0)benign(0.104)TCGA-A5-A0G2-01Endometriumuterine corpus endometrioid carcinomaFemale<65III/IVUnknownUnknownSD
TIMM17BSNVMissense_Mutationnovelc.58G>Ap.Ala20Thrp.A20TO60830protein_codingdeleterious(0)probably_damaging(0.947)TCGA-A5-A1OF-01Endometriumuterine corpus endometrioid carcinomaFemale<65I/IIUnknownUnknownSD
TIMM17BSNVMissense_Mutationnovelc.586C>Ap.Pro196Thrp.P196TO60830protein_codingtolerated(0.06)possibly_damaging(0.844)TCGA-AP-A1DK-01Endometriumuterine corpus endometrioid carcinomaFemale<65I/IIUnknownUnknownSD
TIMM17BSNVMissense_Mutationnovelc.113N>Ap.Arg38Hisp.R38HO60830protein_codingdeleterious(0.01)benign(0.33)TCGA-AP-A1DV-01Endometriumuterine corpus endometrioid carcinomaFemale<65I/IIUnknownUnknownSD
TIMM17BSNVMissense_Mutationnovelc.400N>Tp.Arg134Trpp.R134WO60830protein_codingdeleterious(0)probably_damaging(0.994)TCGA-AP-A1E0-01Endometriumuterine corpus endometrioid carcinomaFemale<65III/IVChemotherapypaclitaxelSD
Page: 1 2 3 

Top

Related drugs of malignant transformation related genes

check buttonIdentification of chemicals and drugs interact with genes involved in malignant transfromation
(DGIdb 4.0)
Entrez IDSymbolCategoryInteraction TypesDrug Claim NameDrug NamePMIDs
Page: 1