
|
|||||
|
 | |
| |
| |
| |
| |
| |
|
Gene: THAP5 |
Gene summary for THAP5 |
| Gene information | Species | Human | Gene symbol | THAP5 | Gene ID | 168451 |
| Gene name | THAP domain containing 5 | |
| Gene Alias | THAP5 | |
| Cytomap | 7q31.1 | |
| Gene Type | protein-coding | GO ID | GO:0000122 | UniProtAcc | Q7Z6K1 |
Top |
Malignant transformation analysis |
| Identification of the aberrant gene expression in precancerous and cancerous lesions by comparing the gene expression of stem-like cells in diseased tissues with normal stem cells |
| Entrez ID | Symbol | Replicates | Species | Organ | Tissue | Adj P-value | Log2FC | Malignancy |
| 168451 | THAP5 | S027 | Human | Liver | HCC | 7.67e-19 | 1.75e+00 | 0.2446 |
| 168451 | THAP5 | S028 | Human | Liver | HCC | 7.40e-47 | 1.97e+00 | 0.2503 |
| 168451 | THAP5 | S029 | Human | Liver | HCC | 3.13e-34 | 1.94e+00 | 0.2581 |
| 168451 | THAP5 | P1_cSCC | Human | Skin | cSCC | 6.03e-03 | 2.64e-01 | 0.0292 |
| 168451 | THAP5 | P2_cSCC | Human | Skin | cSCC | 2.87e-07 | 2.74e-01 | -0.024 |
| 168451 | THAP5 | P4_cSCC | Human | Skin | cSCC | 1.36e-02 | 1.24e-01 | -0.00290000000000005 |
| 168451 | THAP5 | P10_cSCC | Human | Skin | cSCC | 2.91e-14 | 5.02e-01 | 0.1017 |
| 168451 | THAP5 | male-WTA | Human | Thyroid | PTC | 1.06e-10 | 1.17e-01 | 0.1037 |
| 168451 | THAP5 | PTC01 | Human | Thyroid | PTC | 4.98e-05 | 9.30e-02 | 0.1899 |
| 168451 | THAP5 | PTC03 | Human | Thyroid | PTC | 2.18e-03 | 1.42e-01 | 0.1784 |
| 168451 | THAP5 | PTC04 | Human | Thyroid | PTC | 8.59e-08 | 1.61e-01 | 0.1927 |
| 168451 | THAP5 | PTC05 | Human | Thyroid | PTC | 5.81e-10 | 4.94e-01 | 0.2065 |
| 168451 | THAP5 | PTC06 | Human | Thyroid | PTC | 7.59e-24 | 4.57e-01 | 0.2057 |
| 168451 | THAP5 | PTC07 | Human | Thyroid | PTC | 5.12e-30 | 4.32e-01 | 0.2044 |
| 168451 | THAP5 | ATC12 | Human | Thyroid | ATC | 4.67e-10 | 1.82e-01 | 0.34 |
| 168451 | THAP5 | ATC13 | Human | Thyroid | ATC | 5.01e-18 | 3.51e-01 | 0.34 |
| 168451 | THAP5 | ATC2 | Human | Thyroid | ATC | 1.37e-06 | 8.20e-01 | 0.34 |
| 168451 | THAP5 | ATC4 | Human | Thyroid | ATC | 3.48e-16 | 2.71e-01 | 0.34 |
| 168451 | THAP5 | ATC5 | Human | Thyroid | ATC | 6.85e-25 | 3.88e-01 | 0.34 |
| Page: 1 2 3 4 |
| Tissue | Expression Dynamics | Abbreviation |
| Esophagus |  | ESCC: Esophageal squamous cell carcinoma |
| HGIN: High-grade intraepithelial neoplasias | ||
| LGIN: Low-grade intraepithelial neoplasias | ||
| Liver |  | HCC: Hepatocellular carcinoma |
| NAFLD: Non-alcoholic fatty liver disease | ||
| Skin | 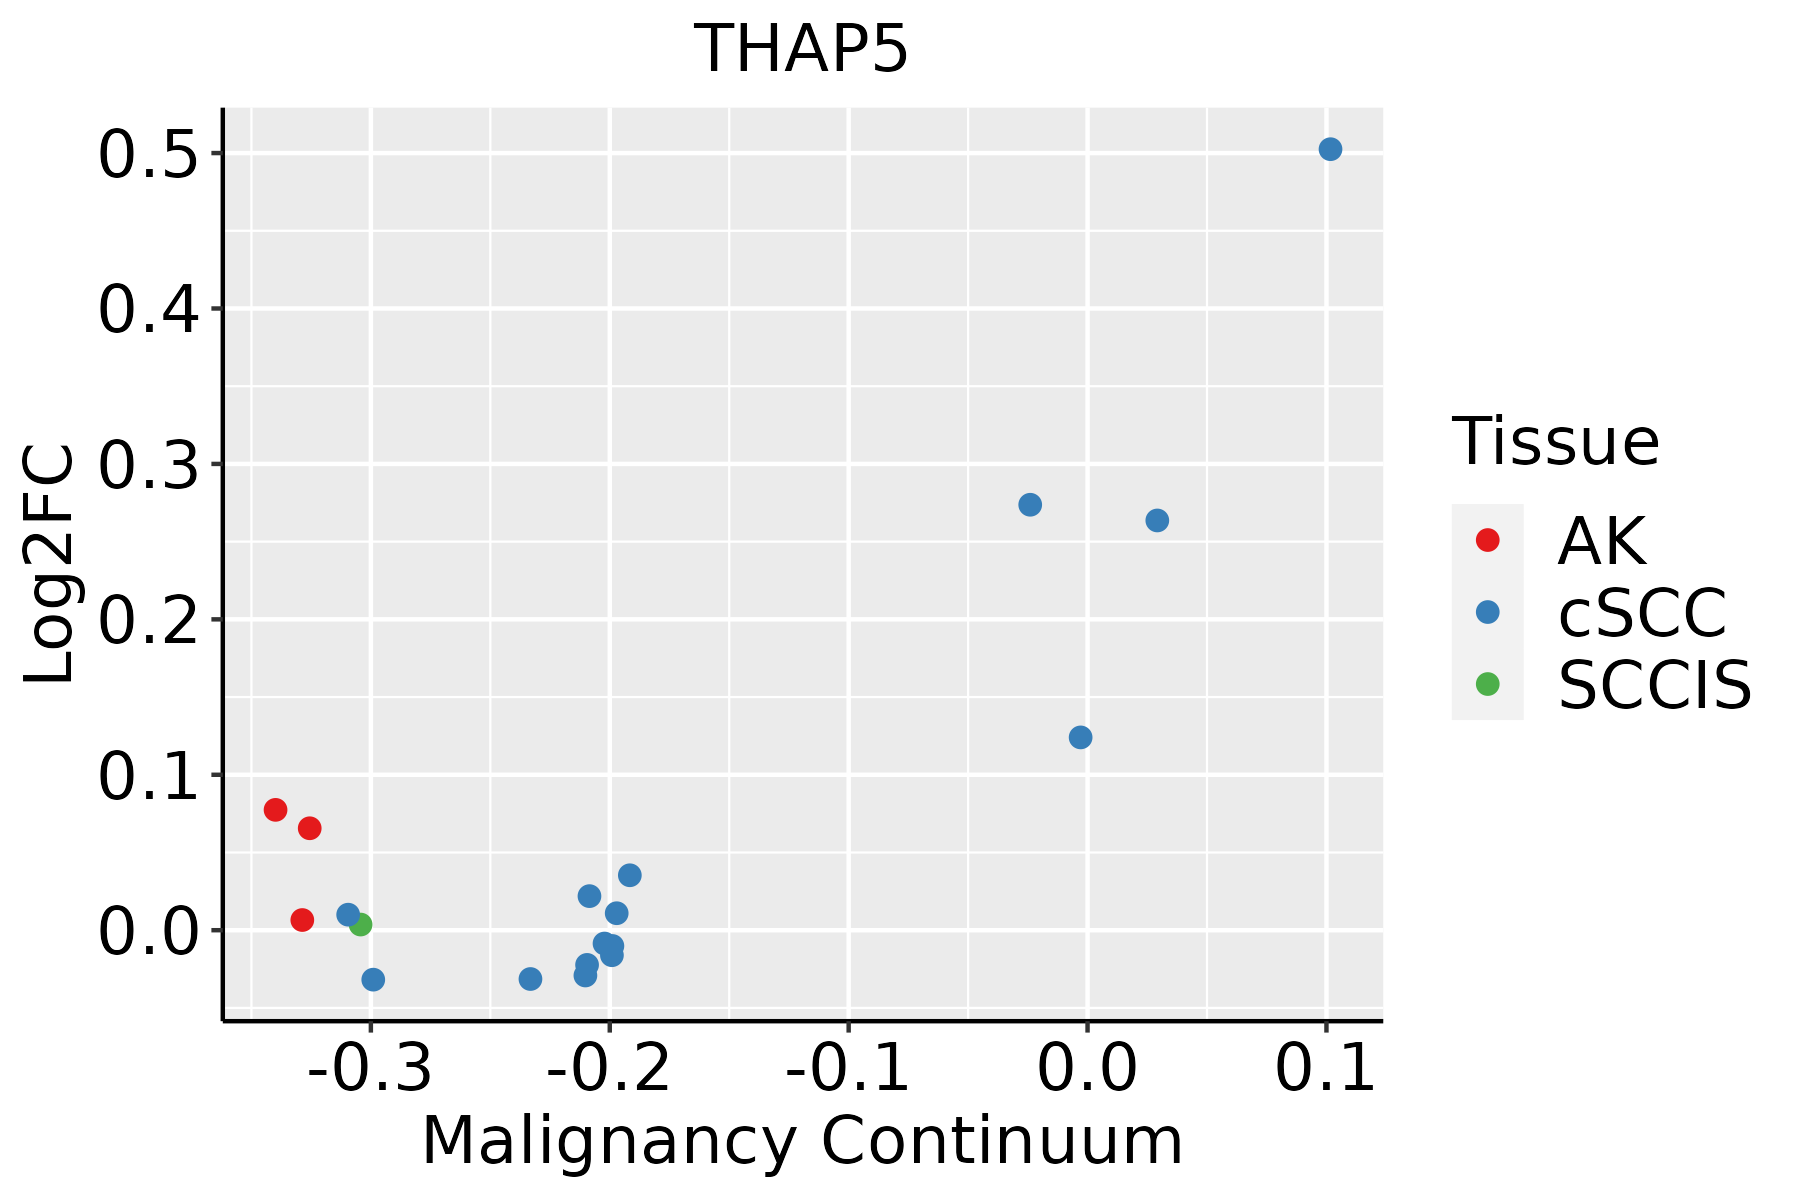 | AK: Actinic keratosis |
| cSCC: Cutaneous squamous cell carcinoma | ||
| SCCIS:squamous cell carcinoma in situ | ||
| Thyroid |  | ATC: Anaplastic thyroid cancer |
| HT: Hashimoto's thyroiditis | ||
| PTC: Papillary thyroid cancer |
| ∗log2FC in expression of this searched gene in stem-like cells from each diseased tissue sample relative to stem-like cells in normal samples in each tissue plotted against the malignancy continuum. Samples are colored based on if they are from different disease stage. |
Top |
Malignant transformation related pathway analysis |
| Find out the enriched GO biological processes and KEGG pathways involved in transition from healthy to precancer to cancer |
| Tissue | Disease Stage | Enriched GO biological Processes |
| Colorectum | AD |  |
| Colorectum | SER |  |
| Colorectum | MSS |  |
| Colorectum | MSI-H |  |
| Colorectum | FAP |  |
| ∗Top 15 enriched GO BP terms are showed in the bar plot of each disease state in each tissue. Each row represents a significant GO biological process which is colored according to the -log10(p.adjust). |
| Page: 1 2 3 4 5 6 7 8 9 |
| GO ID | Tissue | Disease Stage | Description | Gene Ratio | Bg Ratio | pvalue | p.adjust | Count |
| GO:00457865 | Esophagus | ESCC | negative regulation of cell cycle | 236/8552 | 385/18723 | 3.62e-10 | 9.93e-09 | 236 |
| GO:0045786 | Liver | HCC | negative regulation of cell cycle | 204/7958 | 385/18723 | 1.84e-05 | 1.99e-04 | 204 |
| GO:004578613 | Skin | cSCC | negative regulation of cell cycle | 140/4864 | 385/18723 | 3.64e-06 | 5.50e-05 | 140 |
| GO:00457867 | Thyroid | PTC | negative regulation of cell cycle | 166/5968 | 385/18723 | 1.93e-06 | 2.64e-05 | 166 |
| GO:004578614 | Thyroid | ATC | negative regulation of cell cycle | 181/6293 | 385/18723 | 2.64e-08 | 5.07e-07 | 181 |
| Page: 1 |
| Pathway ID | Tissue | Disease Stage | Description | Gene Ratio | Bg Ratio | pvalue | p.adjust | qvalue | Count |
| Page: 1 |
Top |
Cell-cell communication analysis |
| Identification of potential cell-cell interactions between two cell types and their ligand-receptor pairs for different disease states |
| Ligand | Receptor | LRpair | Pathway | Tissue | Disease Stage |
| Page: 1 |
Top |
Single-cell gene regulatory network inference analysis |
| Find out the significant the regulons (TFs) and the target genes of each regulon across cell types for different disease states |
| TF | Cell Type | Tissue | Disease Stage | Target Gene | RSS | Regulon Activity |
| ∗The dot plots of a searched regulon are shown for all cell subpopulations in each disease state of each tissue based on the regulon specific score inferred using pySCENIC and by calculating the average expression. |
| Page: 1 |
Top |
Somatic mutation of malignant transformation related genes |
| Annotation of somatic variants for genes involved in malignant transformation |
| Hugo Symbol | Variant Class | Variant Classification | dbSNP RS | HGVSc | HGVSp | HGVSp Short | SWISSPROT | BIOTYPE | SIFT | PolyPhen | Tumor Sample Barcode | Tissue | Histology | Sex | Age | Stage | Therapy Types | Drugs | Outcome |
| THAP5 | SNV | Missense_Mutation | novel | c.955C>G | p.Gln319Glu | p.Q319E | Q7Z6K1 | protein_coding | tolerated(0.13) | benign(0.274) | TCGA-A7-A56D-01 | Breast | breast invasive carcinoma | Female | >=65 | I/II | Hormone Therapy | arimidex | SD |
| THAP5 | SNV | Missense_Mutation | novel | c.594G>T | p.Glu198Asp | p.E198D | Q7Z6K1 | protein_coding | deleterious(0.02) | benign(0.044) | TCGA-AN-A046-01 | Breast | breast invasive carcinoma | Female | >=65 | I/II | Unknown | Unknown | SD |
| THAP5 | SNV | Missense_Mutation | c.569G>C | p.Arg190Thr | p.R190T | Q7Z6K1 | protein_coding | tolerated(0.51) | benign(0) | TCGA-C8-A12T-01 | Breast | breast invasive carcinoma | Female | <65 | I/II | Unknown | Unknown | SD | |
| THAP5 | SNV | Missense_Mutation | rs375104804 | c.887N>T | p.Thr296Met | p.T296M | Q7Z6K1 | protein_coding | tolerated(0.63) | benign(0) | TCGA-D8-A1Y1-01 | Breast | breast invasive carcinoma | Female | >=65 | III/IV | Hormone Therapy | tamoxiphen | PD |
| THAP5 | SNV | Missense_Mutation | c.937N>C | p.Tyr313His | p.Y313H | Q7Z6K1 | protein_coding | tolerated(0.59) | benign(0) | TCGA-E2-A1IH-01 | Breast | breast invasive carcinoma | Female | >=65 | I/II | Hormone Therapy | aromasin | SD | |
| THAP5 | SNV | Missense_Mutation | c.254C>T | p.Ser85Phe | p.S85F | Q7Z6K1 | protein_coding | deleterious(0.05) | probably_damaging(0.924) | TCGA-2W-A8YY-01 | Cervix | cervical & endocervical cancer | Female | <65 | I/II | Chemotherapy | cisplatin | CR | |
| THAP5 | SNV | Missense_Mutation | c.559G>A | p.Asp187Asn | p.D187N | Q7Z6K1 | protein_coding | tolerated(0.4) | benign(0.005) | TCGA-C5-A1BJ-01 | Cervix | cervical & endocervical cancer | Female | <65 | I/II | Unknown | Unknown | SD | |
| THAP5 | SNV | Missense_Mutation | c.794A>G | p.Asn265Ser | p.N265S | Q7Z6K1 | protein_coding | tolerated(0.54) | benign(0.028) | TCGA-A6-4107-01 | Colorectum | colon adenocarcinoma | Female | <65 | III/IV | Chemotherapy | 5 | SD | |
| THAP5 | SNV | Missense_Mutation | rs796158447 | c.860C>A | p.Ser287Tyr | p.S287Y | Q7Z6K1 | protein_coding | deleterious(0) | probably_damaging(0.994) | TCGA-AA-3977-01 | Colorectum | colon adenocarcinoma | Male | >=65 | I/II | Unknown | Unknown | SD |
| THAP5 | SNV | Missense_Mutation | rs796158447 | c.860C>A | p.Ser287Tyr | p.S287Y | Q7Z6K1 | protein_coding | deleterious(0) | probably_damaging(0.994) | TCGA-AA-3984-01 | Colorectum | colon adenocarcinoma | Female | <65 | I/II | Unknown | Unknown | SD |
| Page: 1 2 3 4 5 |
Top |
Related drugs of malignant transformation related genes |
| Identification of chemicals and drugs interact with genes involved in malignant transfromation |
| (DGIdb 4.0) |
| Entrez ID | Symbol | Category | Interaction Types | Drug Claim Name | Drug Name | PMIDs |
| Page: 1 |

Copyright 2023-Present -The University of Texas Health Science Center at Houston |