
|
|||||
|
 | |
| |
| |
| |
| |
| |
|
Gene: THAP11 |
Gene summary for THAP11 |
| Gene information | Species | Human | Gene symbol | THAP11 | Gene ID | 57215 |
| Gene name | THAP domain containing 11 | |
| Gene Alias | CTG-B43a | |
| Cytomap | 16q22.1 | |
| Gene Type | protein-coding | GO ID | GO:0000122 | UniProtAcc | Q96EK4 |
Top |
Malignant transformation analysis |
| Identification of the aberrant gene expression in precancerous and cancerous lesions by comparing the gene expression of stem-like cells in diseased tissues with normal stem cells |
| Entrez ID | Symbol | Replicates | Species | Organ | Tissue | Adj P-value | Log2FC | Malignancy |
| 57215 | THAP11 | LN46 | Human | Oral cavity | OSCC | 4.31e-15 | 7.05e-01 | 0.1666 |
| 57215 | THAP11 | LP17 | Human | Oral cavity | LP | 8.42e-04 | 6.12e-01 | 0.2349 |
| 57215 | THAP11 | SYSMH1 | Human | Oral cavity | OSCC | 3.04e-09 | 2.45e-01 | 0.1127 |
| 57215 | THAP11 | SYSMH2 | Human | Oral cavity | OSCC | 3.50e-09 | 3.09e-01 | 0.2326 |
| 57215 | THAP11 | SYSMH3 | Human | Oral cavity | OSCC | 6.76e-05 | 2.64e-01 | 0.2442 |
| 57215 | THAP11 | P4_S8_cSCC | Human | Skin | cSCC | 7.53e-05 | 1.39e-01 | -0.3095 |
| 57215 | THAP11 | P1_cSCC | Human | Skin | cSCC | 1.14e-17 | 5.53e-01 | 0.0292 |
| 57215 | THAP11 | P2_cSCC | Human | Skin | cSCC | 1.25e-04 | 2.19e-01 | -0.024 |
| 57215 | THAP11 | P4_cSCC | Human | Skin | cSCC | 1.04e-07 | 2.89e-01 | -0.00290000000000005 |
| 57215 | THAP11 | P10_cSCC | Human | Skin | cSCC | 3.61e-05 | 2.47e-01 | 0.1017 |
| 57215 | THAP11 | male-WTA | Human | Thyroid | PTC | 3.78e-19 | 1.17e-01 | 0.1037 |
| 57215 | THAP11 | PTC01 | Human | Thyroid | PTC | 6.07e-11 | 1.35e-01 | 0.1899 |
| 57215 | THAP11 | PTC04 | Human | Thyroid | PTC | 1.84e-03 | 1.53e-03 | 0.1927 |
| 57215 | THAP11 | PTC05 | Human | Thyroid | PTC | 2.94e-08 | 1.75e-01 | 0.2065 |
| 57215 | THAP11 | PTC06 | Human | Thyroid | PTC | 3.10e-10 | 1.35e-01 | 0.2057 |
| 57215 | THAP11 | PTC07 | Human | Thyroid | PTC | 9.50e-11 | 1.54e-01 | 0.2044 |
| 57215 | THAP11 | ATC12 | Human | Thyroid | ATC | 4.04e-14 | 1.51e-01 | 0.34 |
| 57215 | THAP11 | ATC13 | Human | Thyroid | ATC | 1.32e-24 | 5.07e-01 | 0.34 |
| 57215 | THAP11 | ATC2 | Human | Thyroid | ATC | 3.82e-05 | 3.98e-01 | 0.34 |
| 57215 | THAP11 | ATC4 | Human | Thyroid | ATC | 3.25e-11 | 2.24e-01 | 0.34 |
| Page: 1 2 3 4 5 |
| Tissue | Expression Dynamics | Abbreviation |
| Esophagus | 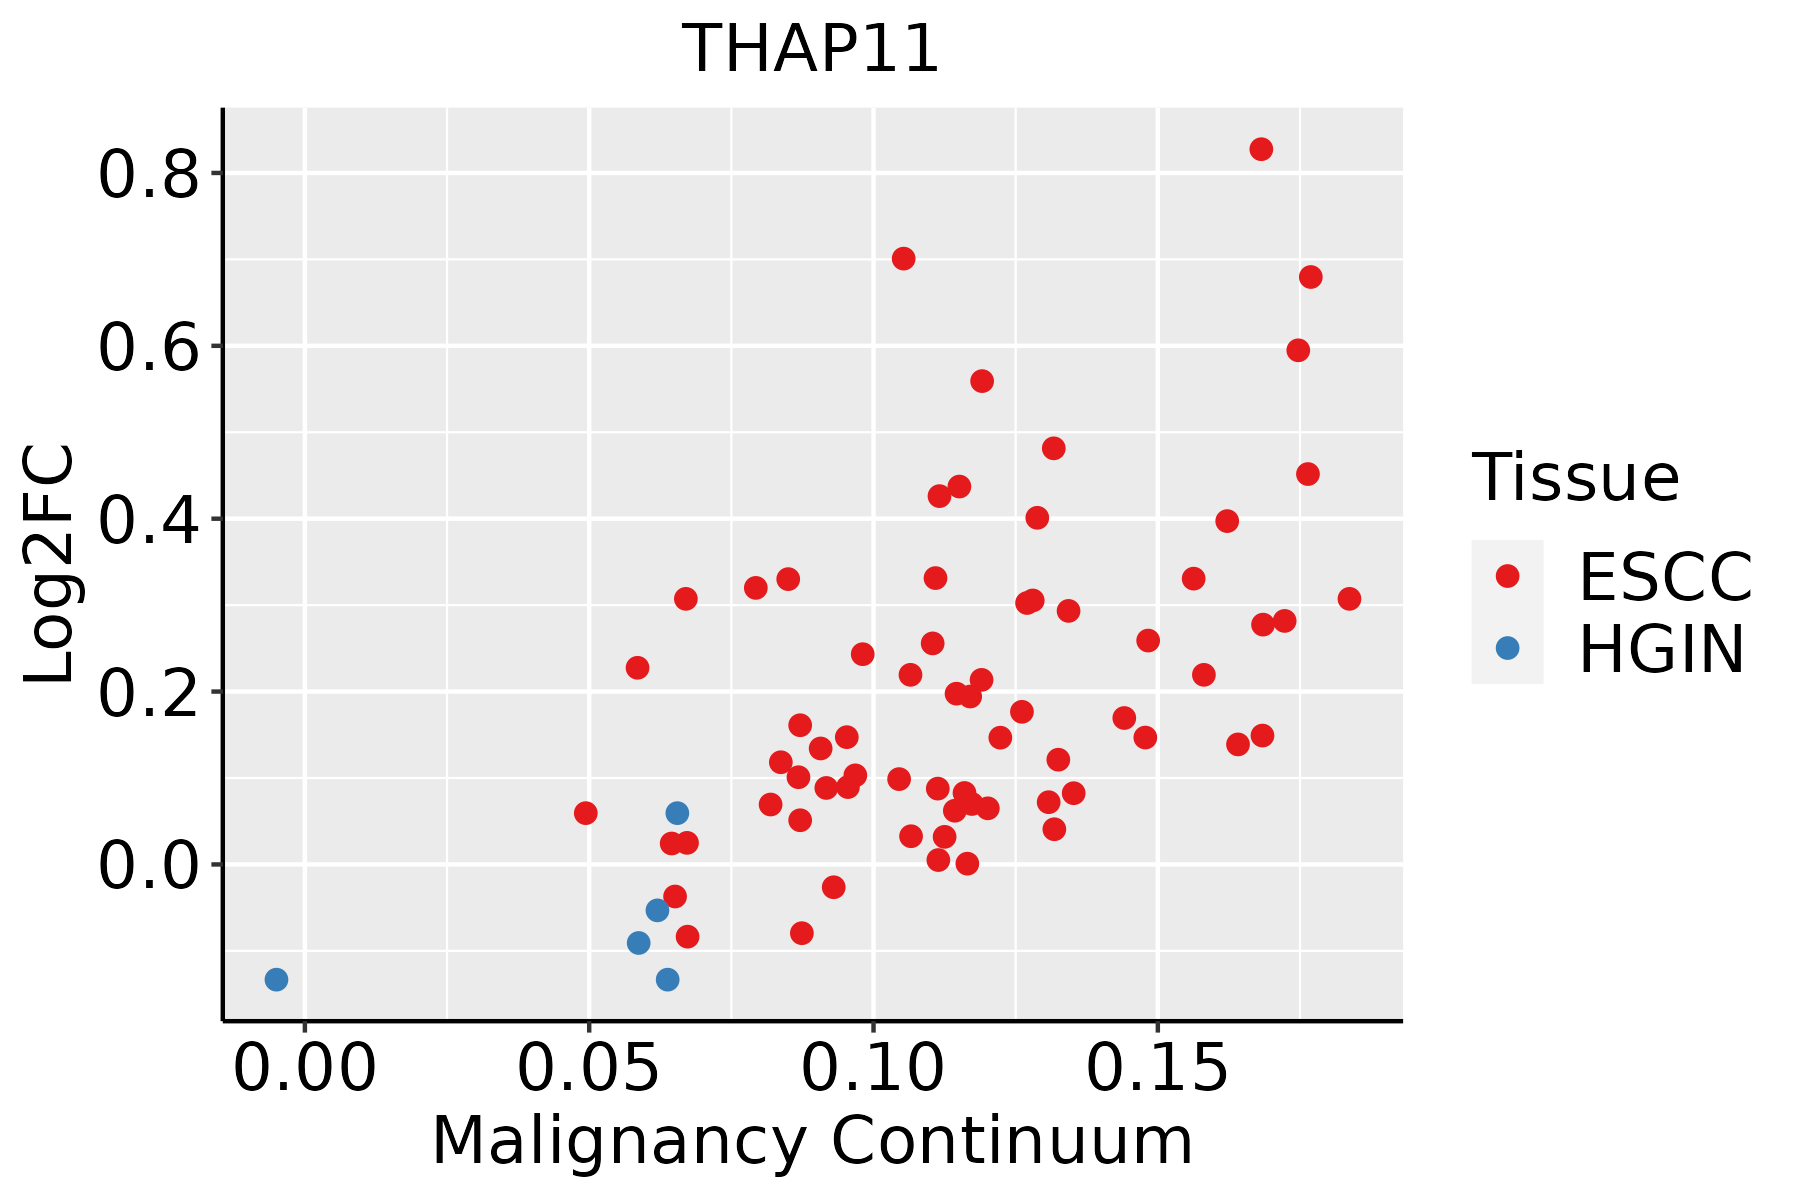 | ESCC: Esophageal squamous cell carcinoma |
| HGIN: High-grade intraepithelial neoplasias | ||
| LGIN: Low-grade intraepithelial neoplasias | ||
| Oral Cavity |  | EOLP: Erosive Oral lichen planus |
| LP: leukoplakia | ||
| NEOLP: Non-erosive oral lichen planus | ||
| OSCC: Oral squamous cell carcinoma | ||
| Skin |  | AK: Actinic keratosis |
| cSCC: Cutaneous squamous cell carcinoma | ||
| SCCIS:squamous cell carcinoma in situ | ||
| Thyroid | 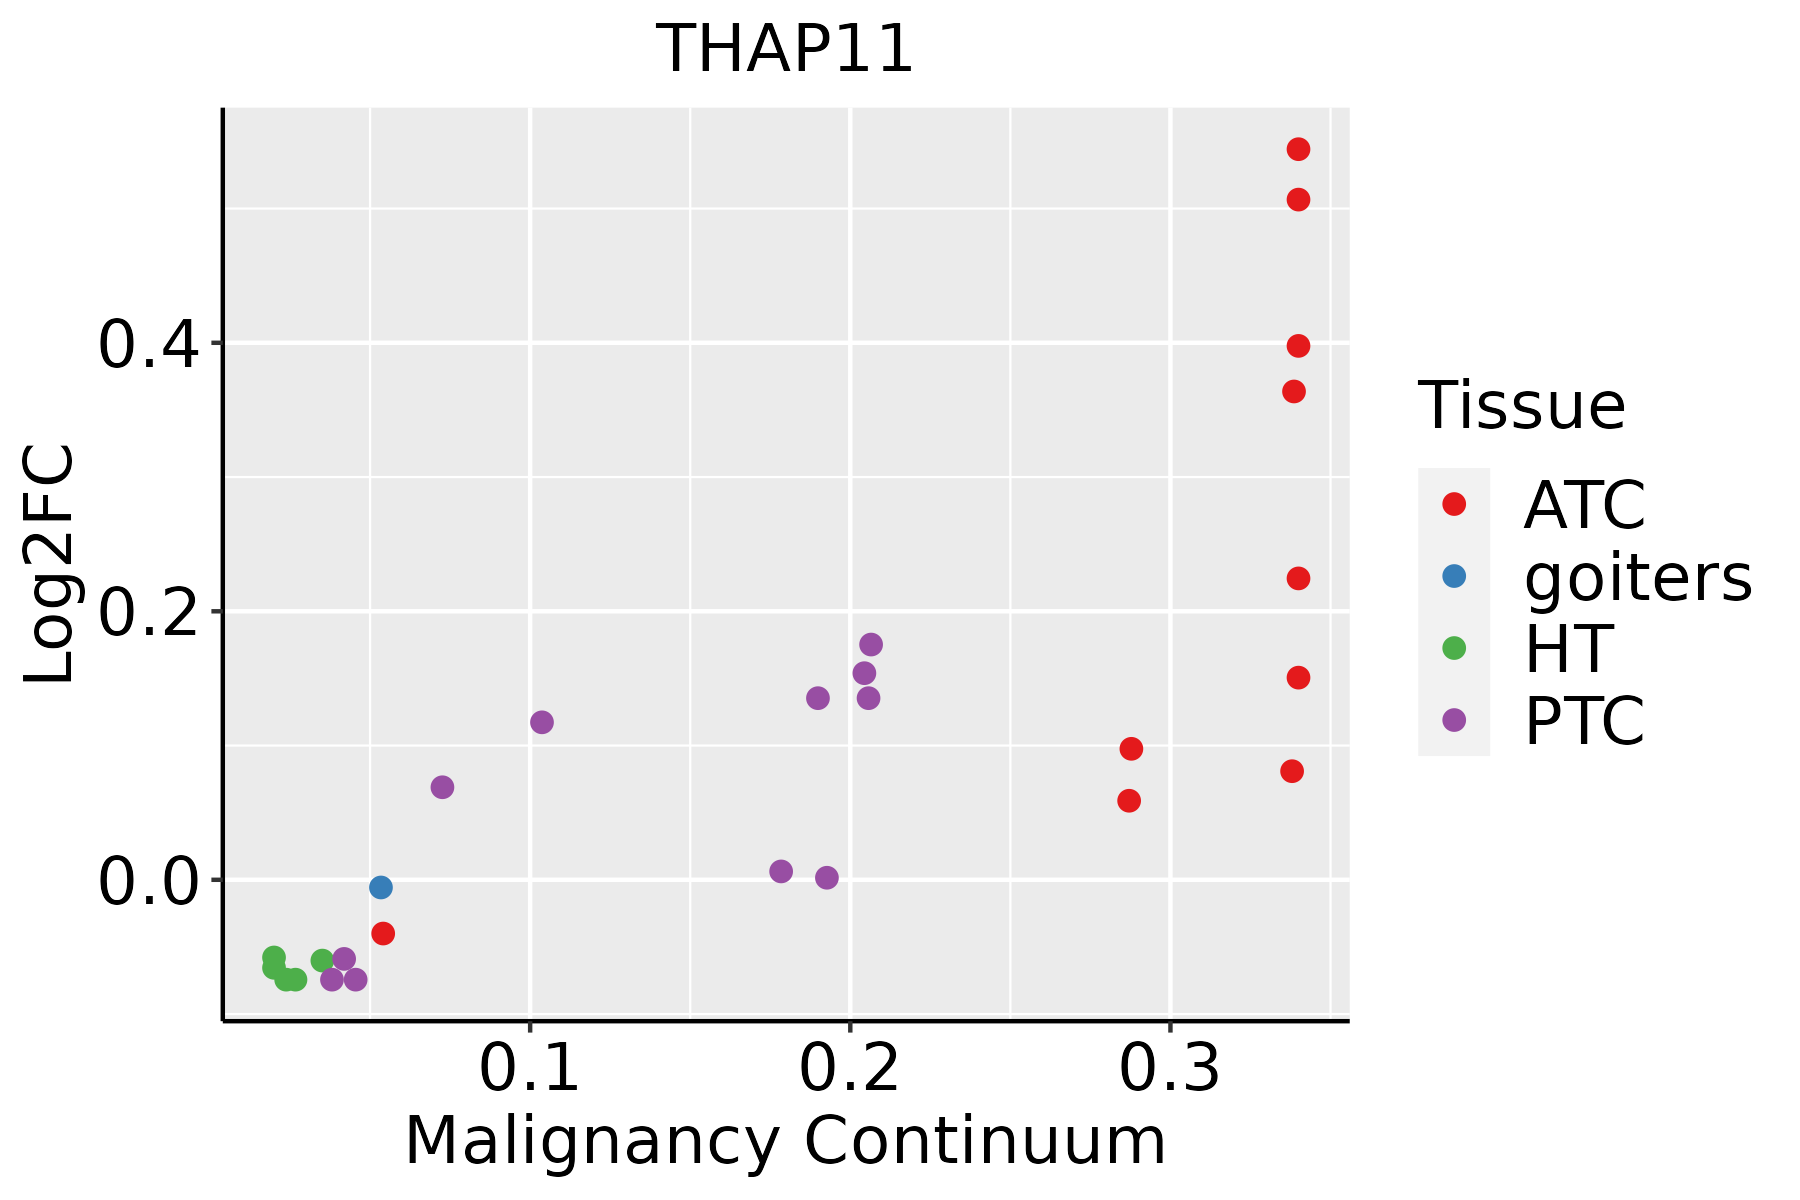 | ATC: Anaplastic thyroid cancer |
| HT: Hashimoto's thyroiditis | ||
| PTC: Papillary thyroid cancer |
| ∗log2FC in expression of this searched gene in stem-like cells from each diseased tissue sample relative to stem-like cells in normal samples in each tissue plotted against the malignancy continuum. Samples are colored based on if they are from different disease stage. |
Top |
Malignant transformation related pathway analysis |
| Find out the enriched GO biological processes and KEGG pathways involved in transition from healthy to precancer to cancer |
| Tissue | Disease Stage | Enriched GO biological Processes |
| Colorectum | AD |  |
| Colorectum | SER |  |
| Colorectum | MSS |  |
| Colorectum | MSI-H |  |
| Colorectum | FAP |  |
| ∗Top 15 enriched GO BP terms are showed in the bar plot of each disease state in each tissue. Each row represents a significant GO biological process which is colored according to the -log10(p.adjust). |
| Page: 1 2 3 4 5 6 7 8 9 |
| GO ID | Tissue | Disease Stage | Description | Gene Ratio | Bg Ratio | pvalue | p.adjust | Count |
| Page: 1 |
| Pathway ID | Tissue | Disease Stage | Description | Gene Ratio | Bg Ratio | pvalue | p.adjust | qvalue | Count |
| Page: 1 |
Top |
Cell-cell communication analysis |
| Identification of potential cell-cell interactions between two cell types and their ligand-receptor pairs for different disease states |
| Ligand | Receptor | LRpair | Pathway | Tissue | Disease Stage |
| Page: 1 |
Top |
Single-cell gene regulatory network inference analysis |
| Find out the significant the regulons (TFs) and the target genes of each regulon across cell types for different disease states |
| TF | Cell Type | Tissue | Disease Stage | Target Gene | RSS | Regulon Activity |
| THAP11 | MMC | Lung | ADJ | PIM2,CHD7,PLA2G7, etc. | 6.62e-03 |  |
| THAP11 | TH17 | Oral cavity | EOLP | IL1R2,FASTKD5,RBM15B, etc. | 1.29e-01 |  |
| THAP11 | CD8TEREX | Oral cavity | EOLP | IL1R2,FASTKD5,RBM15B, etc. | 1.22e-01 | |
| THAP11 | SMC | Pancreas | ADJ | CRTC3-AS1,PDZK1IP1,STIM1, etc. | 2.77e-02 |  |
| THAP11 | CD8TEFF | Thyroid | ATC | NMB,SEC14L2,FAH, etc. | 2.06e-01 |  |
| ∗The dot plots of a searched regulon are shown for all cell subpopulations in each disease state of each tissue based on the regulon specific score inferred using pySCENIC and by calculating the average expression. |
| Page: 1 |
Top |
Somatic mutation of malignant transformation related genes |
| Annotation of somatic variants for genes involved in malignant transformation |
| Hugo Symbol | Variant Class | Variant Classification | dbSNP RS | HGVSc | HGVSp | HGVSp Short | SWISSPROT | BIOTYPE | SIFT | PolyPhen | Tumor Sample Barcode | Tissue | Histology | Sex | Age | Stage | Therapy Types | Drugs | Outcome |
| THAP11 | SNV | Missense_Mutation | novel | c.401C>T | p.Ser134Leu | p.S134L | Q96EK4 | protein_coding | tolerated_low_confidence(0.31) | benign(0) | TCGA-BH-A0DZ-01 | Breast | breast invasive carcinoma | Female | <65 | I/II | Chemotherapy | docetaxel | SD |
| THAP11 | SNV | Missense_Mutation | c.413C>A | p.Ser138Tyr | p.S138Y | Q96EK4 | protein_coding | tolerated_low_confidence(0.06) | benign(0.085) | TCGA-DR-A0ZM-01 | Cervix | cervical & endocervical cancer | Female | <65 | III/IV | Unspecific | Cisplatin | SD | |
| THAP11 | SNV | Missense_Mutation | c.776N>A | p.Arg259His | p.R259H | Q96EK4 | protein_coding | tolerated(0.07) | probably_damaging(0.996) | TCGA-AA-A010-01 | Colorectum | colon adenocarcinoma | Female | <65 | I/II | Chemotherapy | folinic | CR | |
| THAP11 | SNV | Missense_Mutation | novel | c.390N>C | p.Gln130His | p.Q130H | Q96EK4 | protein_coding | tolerated_low_confidence(0.13) | benign(0.025) | TCGA-A5-A1OF-01 | Endometrium | uterine corpus endometrioid carcinoma | Female | <65 | I/II | Unknown | Unknown | SD |
| THAP11 | SNV | Missense_Mutation | c.821N>G | p.Lys274Arg | p.K274R | Q96EK4 | protein_coding | deleterious(0) | probably_damaging(0.991) | TCGA-AP-A0LM-01 | Endometrium | uterine corpus endometrioid carcinoma | Female | <65 | III/IV | Chemotherapy | cisplatin | SD | |
| THAP11 | SNV | Missense_Mutation | novel | c.74N>T | p.Thr25Met | p.T25M | Q96EK4 | protein_coding | deleterious(0) | probably_damaging(0.985) | TCGA-AX-A1CE-01 | Endometrium | uterine corpus endometrioid carcinoma | Female | <65 | I/II | Unspecific | Paclitaxel | SD |
| THAP11 | SNV | Missense_Mutation | novel | c.880G>A | p.Glu294Lys | p.E294K | Q96EK4 | protein_coding | deleterious(0) | possibly_damaging(0.786) | TCGA-AX-A3FT-01 | Endometrium | uterine corpus endometrioid carcinoma | Female | <65 | I/II | Unknown | Unknown | SD |
| THAP11 | SNV | Missense_Mutation | novel | c.89N>A | p.Ala30Asp | p.A30D | Q96EK4 | protein_coding | tolerated(0.45) | benign(0.344) | TCGA-B5-A5OC-01 | Endometrium | uterine corpus endometrioid carcinoma | Female | >=65 | III/IV | Chemotherapy | cisplatin | SD |
| THAP11 | SNV | Missense_Mutation | novel | c.847C>T | p.Arg283Cys | p.R283C | Q96EK4 | protein_coding | deleterious(0) | probably_damaging(0.972) | TCGA-EO-A22R-01 | Endometrium | uterine corpus endometrioid carcinoma | Female | <65 | I/II | Unknown | Unknown | SD |
| THAP11 | SNV | Missense_Mutation | novel | c.762N>T | p.Glu254Asp | p.E254D | Q96EK4 | protein_coding | deleterious(0.02) | benign(0.026) | TCGA-49-AAR4-01 | Lung | lung adenocarcinoma | Male | <65 | III/IV | Chemotherapy | taxol | PD |
| Page: 1 2 |
Top |
Related drugs of malignant transformation related genes |
| Identification of chemicals and drugs interact with genes involved in malignant transfromation |
| (DGIdb 4.0) |
| Entrez ID | Symbol | Category | Interaction Types | Drug Claim Name | Drug Name | PMIDs |
| Page: 1 |

Copyright 2023-Present -The University of Texas Health Science Center at Houston |