
|
|||||
|
 | |
| |
| |
| |
| |
| |
|
Gene: TCAF1 |
Gene summary for TCAF1 |
| Gene information | Species | Human | Gene symbol | TCAF1 | Gene ID | 9747 |
| Gene name | TRPM8 channel associated factor 1 | |
| Gene Alias | FAM115A | |
| Cytomap | 7q35 | |
| Gene Type | protein-coding | GO ID | GO:0006605 | UniProtAcc | Q9Y4C2 |
Top |
Malignant transformation analysis |
| Identification of the aberrant gene expression in precancerous and cancerous lesions by comparing the gene expression of stem-like cells in diseased tissues with normal stem cells |
| Entrez ID | Symbol | Replicates | Species | Organ | Tissue | Adj P-value | Log2FC | Malignancy |
| 9747 | TCAF1 | P80T-E | Human | Esophagus | ESCC | 1.23e-20 | 5.64e-01 | 0.155 |
| 9747 | TCAF1 | P82T-E | Human | Esophagus | ESCC | 1.62e-04 | 3.16e-01 | 0.1072 |
| 9747 | TCAF1 | P83T-E | Human | Esophagus | ESCC | 1.90e-24 | 6.67e-01 | 0.1738 |
| 9747 | TCAF1 | P84T-E | Human | Esophagus | ESCC | 1.03e-02 | 2.57e-01 | 0.0933 |
| 9747 | TCAF1 | P89T-E | Human | Esophagus | ESCC | 2.40e-12 | 7.19e-01 | 0.1752 |
| 9747 | TCAF1 | P91T-E | Human | Esophagus | ESCC | 3.99e-13 | 9.97e-01 | 0.1828 |
| 9747 | TCAF1 | P104T-E | Human | Esophagus | ESCC | 6.43e-05 | 3.16e-01 | 0.0931 |
| 9747 | TCAF1 | P107T-E | Human | Esophagus | ESCC | 4.00e-06 | 2.41e-01 | 0.171 |
| 9747 | TCAF1 | P127T-E | Human | Esophagus | ESCC | 2.32e-05 | 8.88e-02 | 0.0826 |
| 9747 | TCAF1 | P128T-E | Human | Esophagus | ESCC | 4.67e-29 | 7.97e-01 | 0.1241 |
| 9747 | TCAF1 | P130T-E | Human | Esophagus | ESCC | 3.05e-55 | 1.26e+00 | 0.1676 |
| 9747 | TCAF1 | HCC1_Meng | Human | Liver | HCC | 1.11e-67 | 2.10e-01 | 0.0246 |
| 9747 | TCAF1 | HCC2_Meng | Human | Liver | HCC | 8.15e-29 | 2.21e-01 | 0.0107 |
| 9747 | TCAF1 | HCC1 | Human | Liver | HCC | 1.61e-06 | 3.68e+00 | 0.5336 |
| 9747 | TCAF1 | HCC2 | Human | Liver | HCC | 1.86e-20 | 4.32e+00 | 0.5341 |
| 9747 | TCAF1 | Pt13.a | Human | Liver | HCC | 4.06e-02 | -1.09e-01 | 0.021 |
| 9747 | TCAF1 | Pt14.d | Human | Liver | HCC | 9.14e-03 | -1.09e-01 | 0.0143 |
| 9747 | TCAF1 | S014 | Human | Liver | HCC | 7.44e-19 | 9.17e-01 | 0.2254 |
| 9747 | TCAF1 | S015 | Human | Liver | HCC | 3.24e-18 | 9.79e-01 | 0.2375 |
| 9747 | TCAF1 | S016 | Human | Liver | HCC | 4.32e-21 | 8.80e-01 | 0.2243 |
| Page: 1 2 3 4 5 6 |
| Tissue | Expression Dynamics | Abbreviation |
| Colorectum (GSE201348) |  | FAP: Familial adenomatous polyposis |
| CRC: Colorectal cancer | ||
| Colorectum (HTA11) |  | AD: Adenomas |
| SER: Sessile serrated lesions | ||
| MSI-H: Microsatellite-high colorectal cancer | ||
| MSS: Microsatellite stable colorectal cancer | ||
| Esophagus | 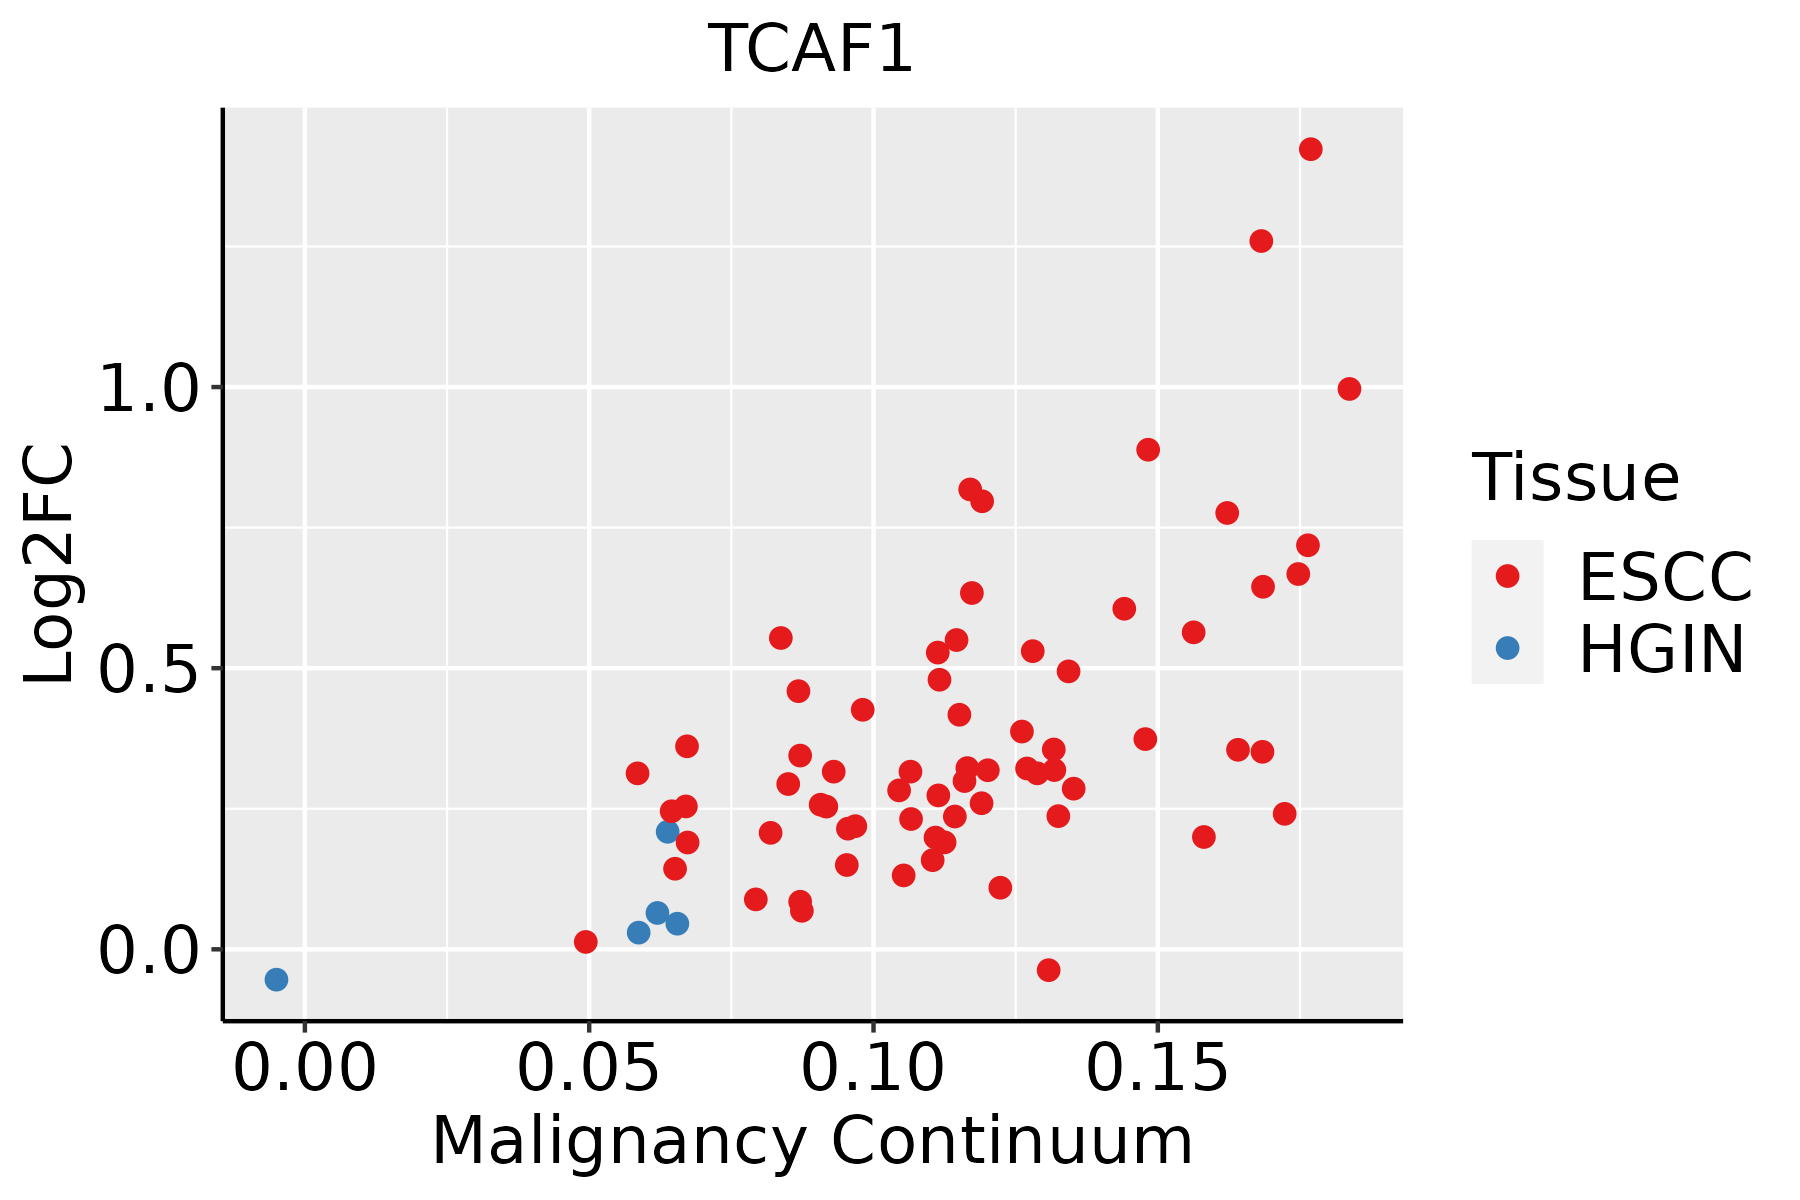 | ESCC: Esophageal squamous cell carcinoma |
| HGIN: High-grade intraepithelial neoplasias | ||
| LGIN: Low-grade intraepithelial neoplasias | ||
| Liver |  | HCC: Hepatocellular carcinoma |
| NAFLD: Non-alcoholic fatty liver disease | ||
| Oral Cavity | 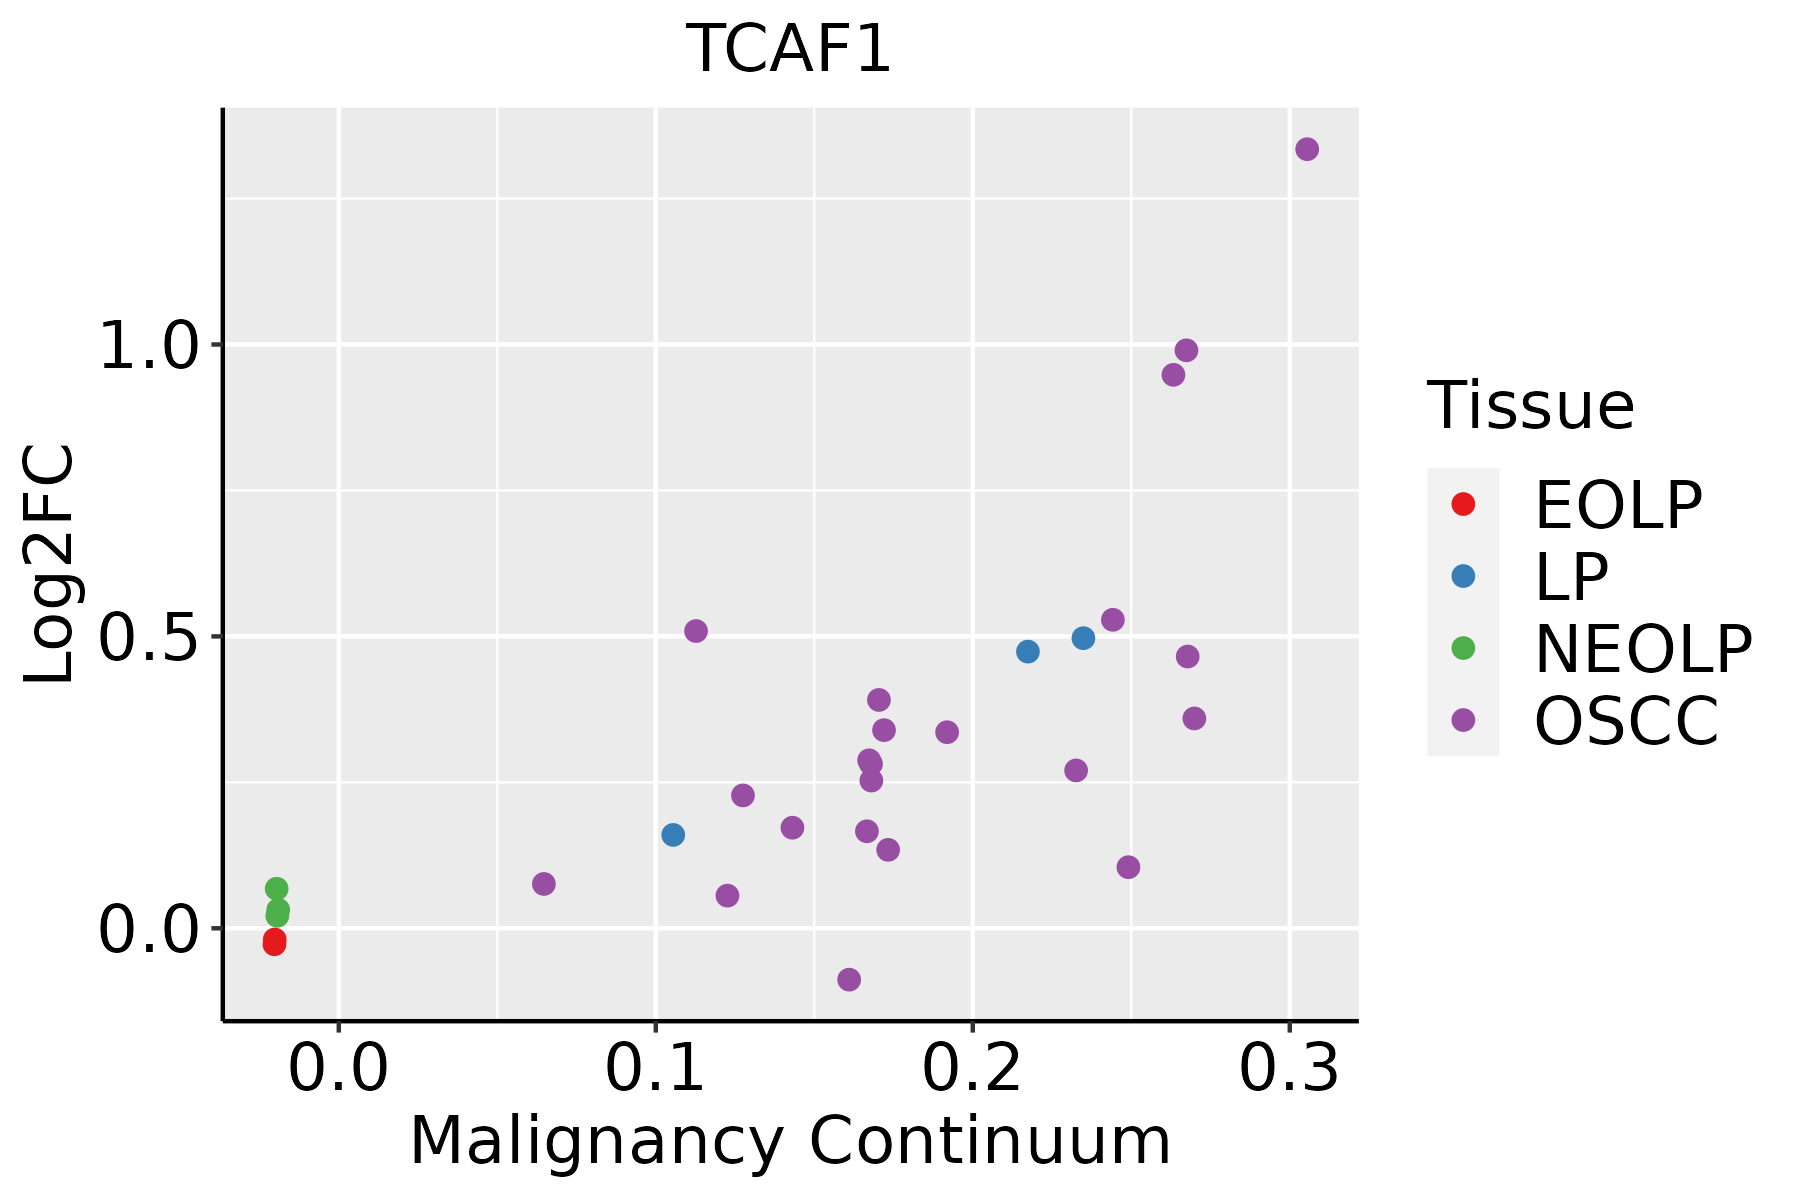 | EOLP: Erosive Oral lichen planus |
| LP: leukoplakia | ||
| NEOLP: Non-erosive oral lichen planus | ||
| OSCC: Oral squamous cell carcinoma | ||
| Prostate |  | BPH: Benign Prostatic Hyperplasia |
| Thyroid | 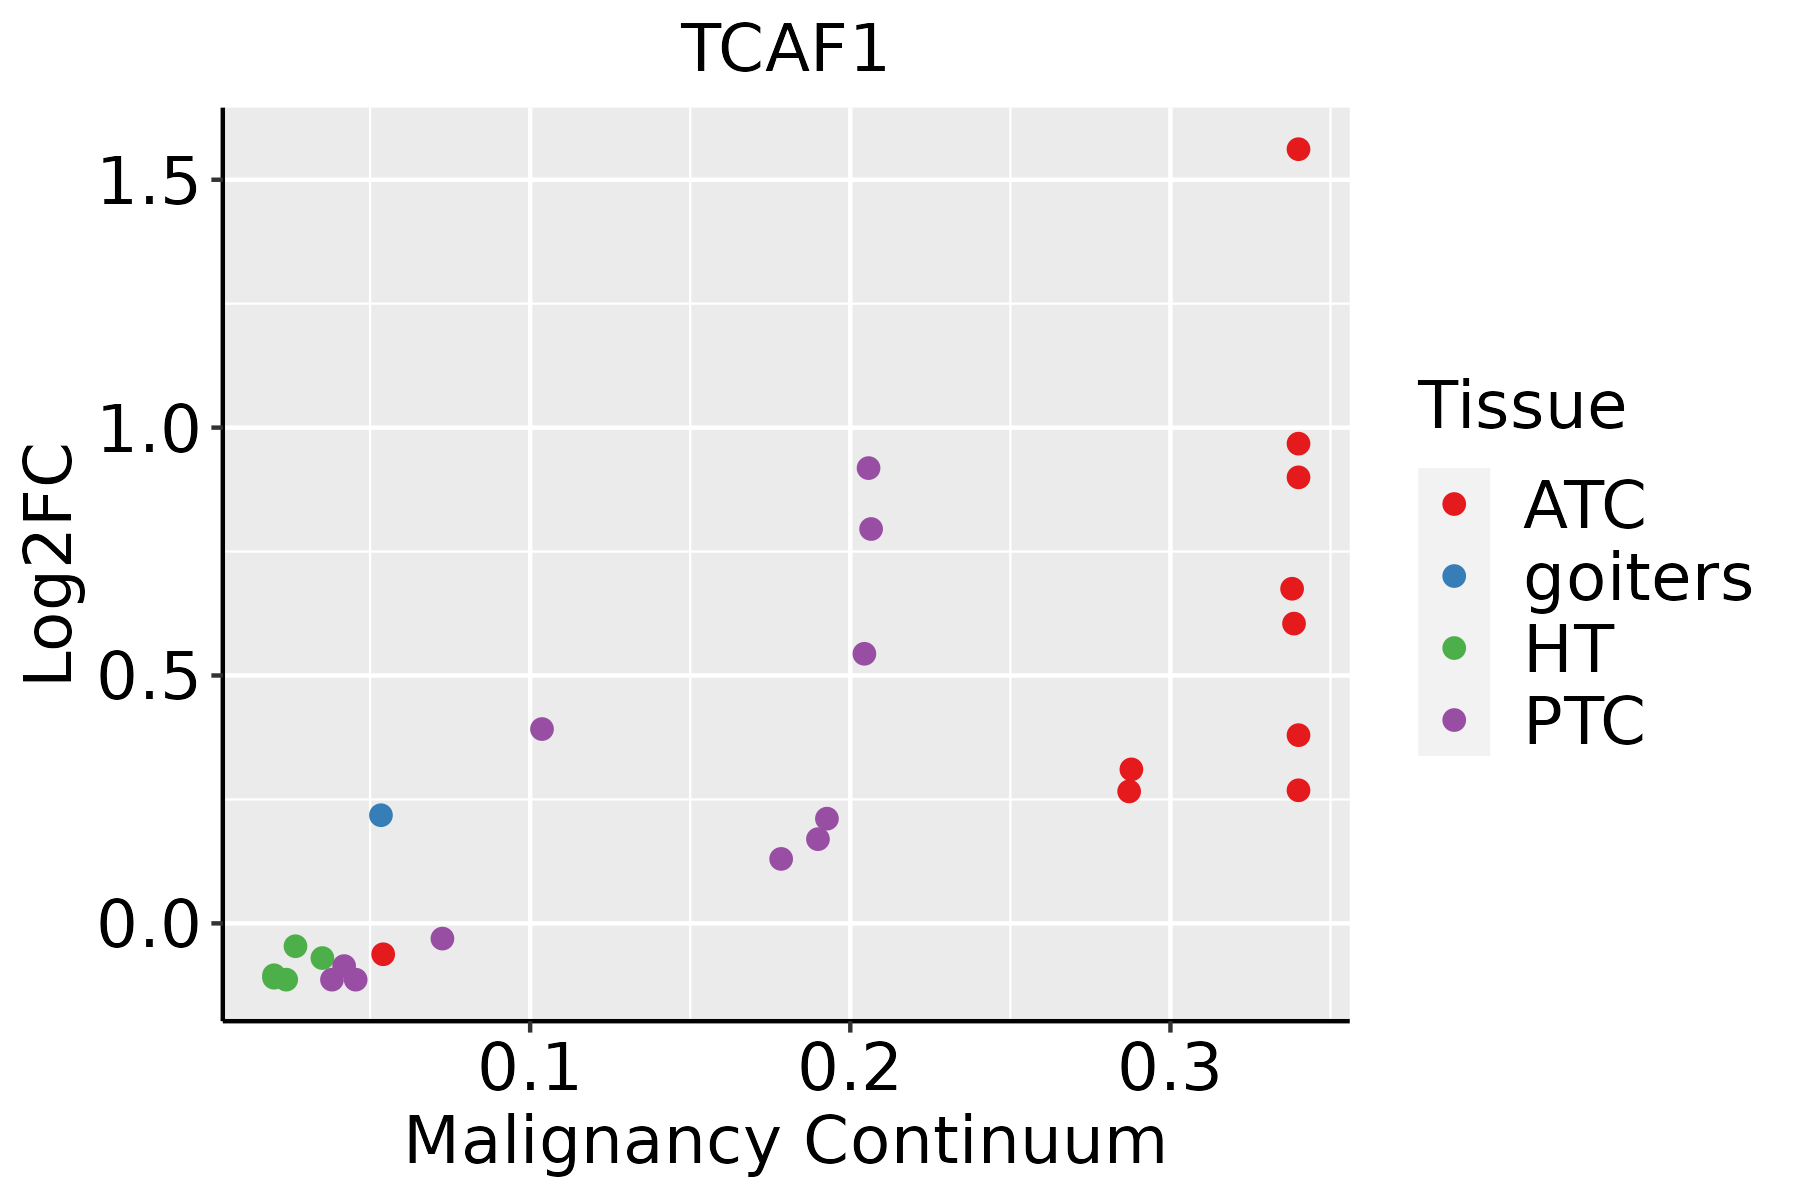 | ATC: Anaplastic thyroid cancer |
| HT: Hashimoto's thyroiditis | ||
| PTC: Papillary thyroid cancer |
| ∗log2FC in expression of this searched gene in stem-like cells from each diseased tissue sample relative to stem-like cells in normal samples in each tissue plotted against the malignancy continuum. Samples are colored based on if they are from different disease stage. |
Top |
Malignant transformation related pathway analysis |
| Find out the enriched GO biological processes and KEGG pathways involved in transition from healthy to precancer to cancer |
| Tissue | Disease Stage | Enriched GO biological Processes |
| Colorectum | AD |  |
| Colorectum | SER |  |
| Colorectum | MSS |  |
| Colorectum | MSI-H |  |
| Colorectum | FAP |  |
| ∗Top 15 enriched GO BP terms are showed in the bar plot of each disease state in each tissue. Each row represents a significant GO biological process which is colored according to the -log10(p.adjust). |
| Page: 1 2 3 4 5 6 7 8 9 |
| GO ID | Tissue | Disease Stage | Description | Gene Ratio | Bg Ratio | pvalue | p.adjust | Count |
| GO:1903829 | Colorectum | AD | positive regulation of cellular protein localization | 110/3918 | 276/18723 | 4.58e-13 | 8.44e-11 | 110 |
| GO:0090150 | Colorectum | AD | establishment of protein localization to membrane | 100/3918 | 260/18723 | 6.01e-11 | 6.33e-09 | 100 |
| GO:1905475 | Colorectum | AD | regulation of protein localization to membrane | 73/3918 | 175/18723 | 3.37e-10 | 2.93e-08 | 73 |
| GO:1904951 | Colorectum | AD | positive regulation of establishment of protein localization | 112/3918 | 319/18723 | 2.55e-09 | 1.80e-07 | 112 |
| GO:0051222 | Colorectum | AD | positive regulation of protein transport | 106/3918 | 303/18723 | 8.45e-09 | 5.08e-07 | 106 |
| GO:0006605 | Colorectum | AD | protein targeting | 105/3918 | 314/18723 | 1.39e-07 | 6.44e-06 | 105 |
| GO:1905477 | Colorectum | AD | positive regulation of protein localization to membrane | 46/3918 | 106/18723 | 1.47e-07 | 6.64e-06 | 46 |
| GO:0090316 | Colorectum | AD | positive regulation of intracellular protein transport | 62/3918 | 160/18723 | 1.82e-07 | 7.79e-06 | 62 |
| GO:0032388 | Colorectum | AD | positive regulation of intracellular transport | 74/3918 | 202/18723 | 1.83e-07 | 7.80e-06 | 74 |
| GO:0032386 | Colorectum | AD | regulation of intracellular transport | 109/3918 | 337/18723 | 5.33e-07 | 1.95e-05 | 109 |
| GO:0033157 | Colorectum | AD | regulation of intracellular protein transport | 80/3918 | 229/18723 | 5.81e-07 | 2.09e-05 | 80 |
| GO:1903533 | Colorectum | AD | regulation of protein targeting | 31/3918 | 81/18723 | 2.61e-04 | 3.25e-03 | 31 |
| GO:0032411 | Colorectum | AD | positive regulation of transporter activity | 37/3918 | 120/18723 | 6.82e-03 | 4.22e-02 | 37 |
| GO:19038292 | Colorectum | MSS | positive regulation of cellular protein localization | 103/3467 | 276/18723 | 1.12e-13 | 2.67e-11 | 103 |
| GO:19049512 | Colorectum | MSS | positive regulation of establishment of protein localization | 110/3467 | 319/18723 | 6.30e-12 | 9.83e-10 | 110 |
| GO:00512222 | Colorectum | MSS | positive regulation of protein transport | 104/3467 | 303/18723 | 3.23e-11 | 4.11e-09 | 104 |
| GO:19054752 | Colorectum | MSS | regulation of protein localization to membrane | 68/3467 | 175/18723 | 2.16e-10 | 2.09e-08 | 68 |
| GO:00901502 | Colorectum | MSS | establishment of protein localization to membrane | 90/3467 | 260/18723 | 4.11e-10 | 3.49e-08 | 90 |
| GO:00903162 | Colorectum | MSS | positive regulation of intracellular protein transport | 60/3467 | 160/18723 | 1.18e-08 | 7.08e-07 | 60 |
| GO:00323882 | Colorectum | MSS | positive regulation of intracellular transport | 70/3467 | 202/18723 | 3.32e-08 | 1.82e-06 | 70 |
| Page: 1 2 3 4 5 6 7 8 9 10 |
| Pathway ID | Tissue | Disease Stage | Description | Gene Ratio | Bg Ratio | pvalue | p.adjust | qvalue | Count |
| Page: 1 |
Top |
Cell-cell communication analysis |
| Identification of potential cell-cell interactions between two cell types and their ligand-receptor pairs for different disease states |
| Ligand | Receptor | LRpair | Pathway | Tissue | Disease Stage |
| Page: 1 |
Top |
Single-cell gene regulatory network inference analysis |
| Find out the significant the regulons (TFs) and the target genes of each regulon across cell types for different disease states |
| TF | Cell Type | Tissue | Disease Stage | Target Gene | RSS | Regulon Activity |
| ∗The dot plots of a searched regulon are shown for all cell subpopulations in each disease state of each tissue based on the regulon specific score inferred using pySCENIC and by calculating the average expression. |
| Page: 1 |
Top |
Somatic mutation of malignant transformation related genes |
| Annotation of somatic variants for genes involved in malignant transformation |
| Hugo Symbol | Variant Class | Variant Classification | dbSNP RS | HGVSc | HGVSp | HGVSp Short | SWISSPROT | BIOTYPE | SIFT | PolyPhen | Tumor Sample Barcode | Tissue | Histology | Sex | Age | Stage | Therapy Types | Drugs | Outcome |
| TCAF1 | SNV | Missense_Mutation | novel | c.82N>A | p.Glu28Lys | p.E28K | Q9Y4C2 | protein_coding | tolerated(0.14) | benign(0.348) | TCGA-E2-A2P6-01 | Breast | breast invasive carcinoma | Female | >=65 | I/II | Hormone Therapy | anastrozole | SD |
| TCAF1 | SNV | Missense_Mutation | novel | c.2299G>A | p.Glu767Lys | p.E767K | Q9Y4C2 | protein_coding | tolerated(0.17) | benign(0.028) | TCGA-EA-A3HS-01 | Cervix | cervical & endocervical cancer | Female | <65 | I/II | Unknown | Unknown | SD |
| TCAF1 | SNV | Missense_Mutation | c.276N>G | p.Ile92Met | p.I92M | Q9Y4C2 | protein_coding | deleterious(0.02) | benign(0.271) | TCGA-CA-6718-01 | Colorectum | colon adenocarcinoma | Male | <65 | I/II | Unknown | Unknown | PD | |
| TCAF1 | SNV | Missense_Mutation | rs149141329 | c.167N>A | p.Arg56His | p.R56H | Q9Y4C2 | protein_coding | tolerated(0.07) | benign(0.006) | TCGA-CM-4746-01 | Colorectum | colon adenocarcinoma | Male | <65 | I/II | Unknown | Unknown | SD |
| TCAF1 | SNV | Missense_Mutation | novel | c.316G>A | p.Glu106Lys | p.E106K | Q9Y4C2 | protein_coding | tolerated(0.93) | benign(0.005) | TCGA-F5-6814-01 | Colorectum | rectum adenocarcinoma | Male | <65 | I/II | Unknown | Unknown | SD |
| TCAF1 | SNV | Missense_Mutation | rs373629994 | c.25G>A | p.Glu9Lys | p.E9K | Q9Y4C2 | protein_coding | tolerated(0.1) | benign(0.117) | TCGA-A5-A2K5-01 | Endometrium | uterine corpus endometrioid carcinoma | Female | >=65 | I/II | Unknown | Unknown | SD |
| TCAF1 | SNV | Missense_Mutation | novel | c.295N>A | p.Ala99Thr | p.A99T | Q9Y4C2 | protein_coding | tolerated(0.55) | benign(0.003) | TCGA-AJ-A3EK-01 | Endometrium | uterine corpus endometrioid carcinoma | Female | <65 | I/II | Chemotherapy | carboplatin | CR |
| TCAF1 | SNV | Missense_Mutation | novel | c.2613N>T | p.Lys871Asn | p.K871N | Q9Y4C2 | protein_coding | deleterious(0.01) | possibly_damaging(0.701) | TCGA-AP-A059-01 | Endometrium | uterine corpus endometrioid carcinoma | Female | >=65 | I/II | Unknown | Unknown | SD |
| TCAF1 | SNV | Missense_Mutation | novel | c.2312C>T | p.Pro771Leu | p.P771L | Q9Y4C2 | protein_coding | deleterious(0.02) | probably_damaging(0.976) | TCGA-AP-A1DH-01 | Endometrium | uterine corpus endometrioid carcinoma | Female | <65 | I/II | Unknown | Unknown | SD |
| TCAF1 | SNV | Missense_Mutation | novel | c.2701N>A | p.Ala901Thr | p.A901T | Q9Y4C2 | protein_coding | deleterious(0.04) | possibly_damaging(0.758) | TCGA-AP-A1DV-01 | Endometrium | uterine corpus endometrioid carcinoma | Female | <65 | I/II | Unknown | Unknown | SD |
| Page: 1 2 3 4 5 |
Top |
Related drugs of malignant transformation related genes |
| Identification of chemicals and drugs interact with genes involved in malignant transfromation |
| (DGIdb 4.0) |
| Entrez ID | Symbol | Category | Interaction Types | Drug Claim Name | Drug Name | PMIDs |
| Page: 1 |

Copyright 2023-Present -The University of Texas Health Science Center at Houston |