
|
|||||
|
 | |
| |
| |
| |
| |
| |
|
Gene: STX3 |
Gene summary for STX3 |
| Gene information | Species | Human | Gene symbol | STX3 | Gene ID | 6809 |
| Gene name | syntaxin 3 | |
| Gene Alias | DIAR12 | |
| Cytomap | 11q12.1 | |
| Gene Type | protein-coding | GO ID | GO:0001505 | UniProtAcc | Q13277 |
Top |
Malignant transformation analysis |
| Identification of the aberrant gene expression in precancerous and cancerous lesions by comparing the gene expression of stem-like cells in diseased tissues with normal stem cells |
| Entrez ID | Symbol | Replicates | Species | Organ | Tissue | Adj P-value | Log2FC | Malignancy |
| 6809 | STX3 | P40T-E | Human | Esophagus | ESCC | 1.43e-10 | 1.66e-01 | 0.109 |
| 6809 | STX3 | P42T-E | Human | Esophagus | ESCC | 9.51e-06 | 1.30e-01 | 0.1175 |
| 6809 | STX3 | P44T-E | Human | Esophagus | ESCC | 1.57e-04 | 1.37e-01 | 0.1096 |
| 6809 | STX3 | P47T-E | Human | Esophagus | ESCC | 2.56e-24 | 6.54e-01 | 0.1067 |
| 6809 | STX3 | P48T-E | Human | Esophagus | ESCC | 3.37e-14 | 1.92e-01 | 0.0959 |
| 6809 | STX3 | P49T-E | Human | Esophagus | ESCC | 2.85e-12 | 1.58e+00 | 0.1768 |
| 6809 | STX3 | P52T-E | Human | Esophagus | ESCC | 1.41e-10 | 3.38e-01 | 0.1555 |
| 6809 | STX3 | P54T-E | Human | Esophagus | ESCC | 6.09e-09 | 2.88e-01 | 0.0975 |
| 6809 | STX3 | P56T-E | Human | Esophagus | ESCC | 4.45e-05 | 3.03e-01 | 0.1613 |
| 6809 | STX3 | P57T-E | Human | Esophagus | ESCC | 7.32e-14 | 3.08e-01 | 0.0926 |
| 6809 | STX3 | P61T-E | Human | Esophagus | ESCC | 7.19e-11 | 3.19e-01 | 0.099 |
| 6809 | STX3 | P62T-E | Human | Esophagus | ESCC | 3.18e-31 | 5.42e-01 | 0.1302 |
| 6809 | STX3 | P65T-E | Human | Esophagus | ESCC | 2.72e-18 | 2.34e-01 | 0.0978 |
| 6809 | STX3 | P74T-E | Human | Esophagus | ESCC | 1.94e-09 | 1.97e-01 | 0.1479 |
| 6809 | STX3 | P75T-E | Human | Esophagus | ESCC | 5.80e-25 | 7.25e-01 | 0.1125 |
| 6809 | STX3 | P76T-E | Human | Esophagus | ESCC | 5.98e-07 | 1.16e-01 | 0.1207 |
| 6809 | STX3 | P79T-E | Human | Esophagus | ESCC | 5.65e-07 | 2.06e-01 | 0.1154 |
| 6809 | STX3 | P80T-E | Human | Esophagus | ESCC | 3.63e-24 | 7.32e-01 | 0.155 |
| 6809 | STX3 | P82T-E | Human | Esophagus | ESCC | 2.27e-07 | 5.27e-01 | 0.1072 |
| 6809 | STX3 | P83T-E | Human | Esophagus | ESCC | 1.06e-09 | 1.99e-01 | 0.1738 |
| Page: 1 2 3 4 5 6 7 |
| Tissue | Expression Dynamics | Abbreviation |
| Colorectum (GSE201348) |  | FAP: Familial adenomatous polyposis |
| CRC: Colorectal cancer | ||
| Colorectum (HTA11) |  | AD: Adenomas |
| SER: Sessile serrated lesions | ||
| MSI-H: Microsatellite-high colorectal cancer | ||
| MSS: Microsatellite stable colorectal cancer | ||
| Esophagus | 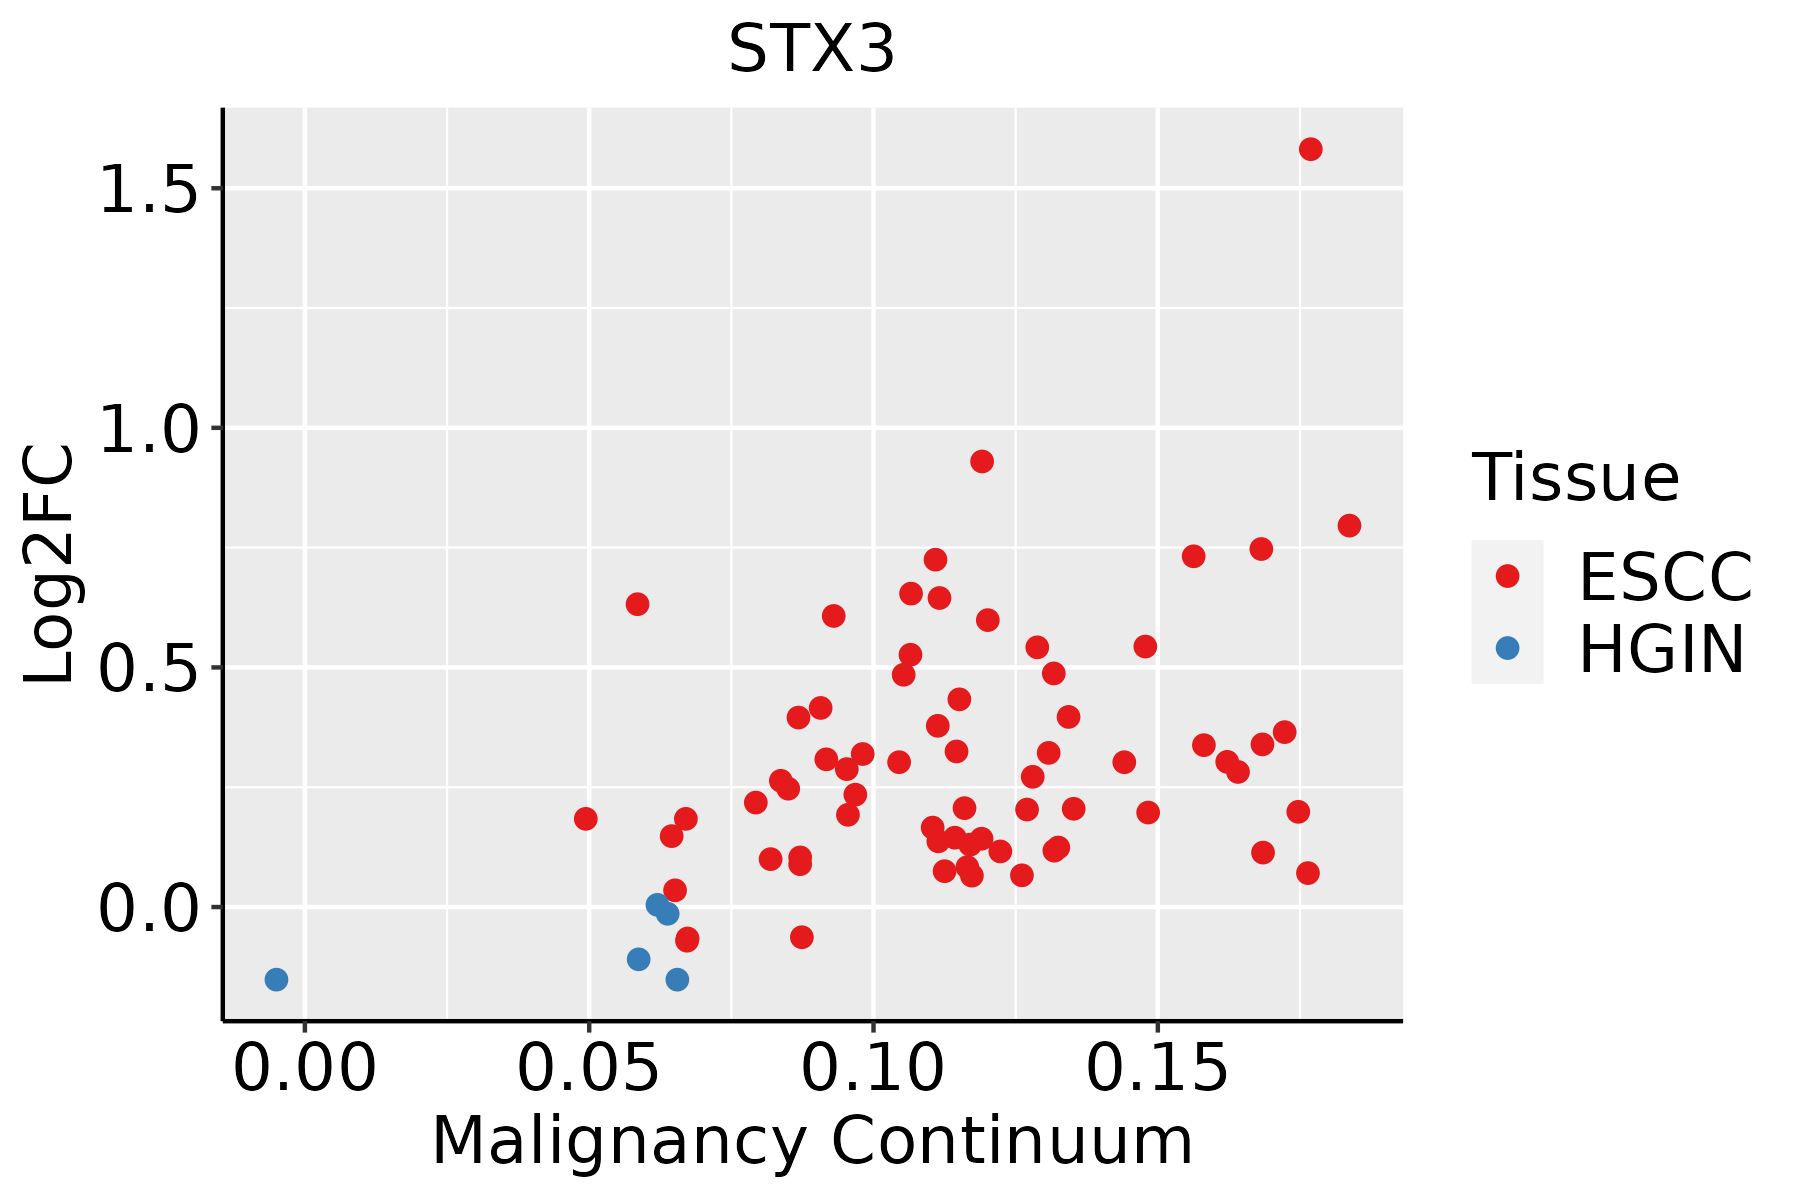 | ESCC: Esophageal squamous cell carcinoma |
| HGIN: High-grade intraepithelial neoplasias | ||
| LGIN: Low-grade intraepithelial neoplasias | ||
| Liver | 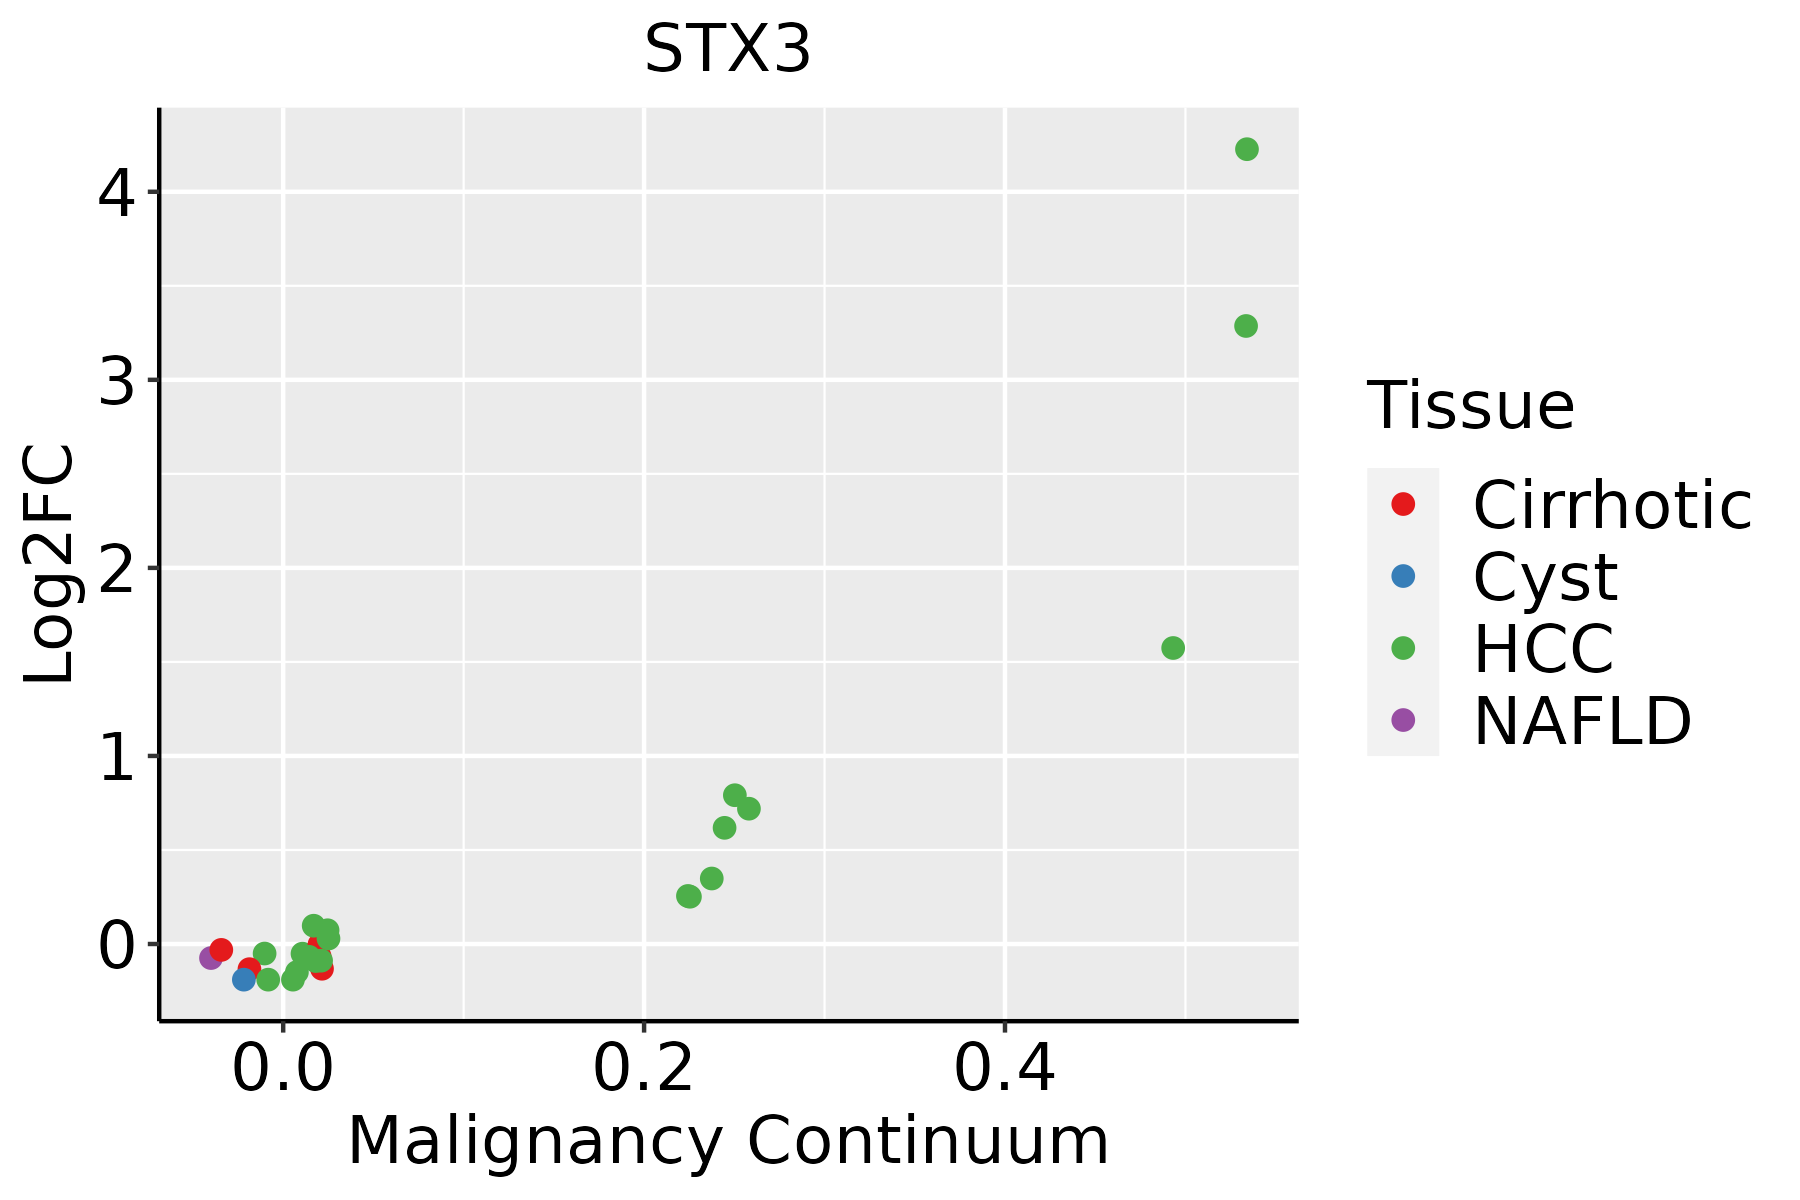 | HCC: Hepatocellular carcinoma |
| NAFLD: Non-alcoholic fatty liver disease | ||
| Oral Cavity | 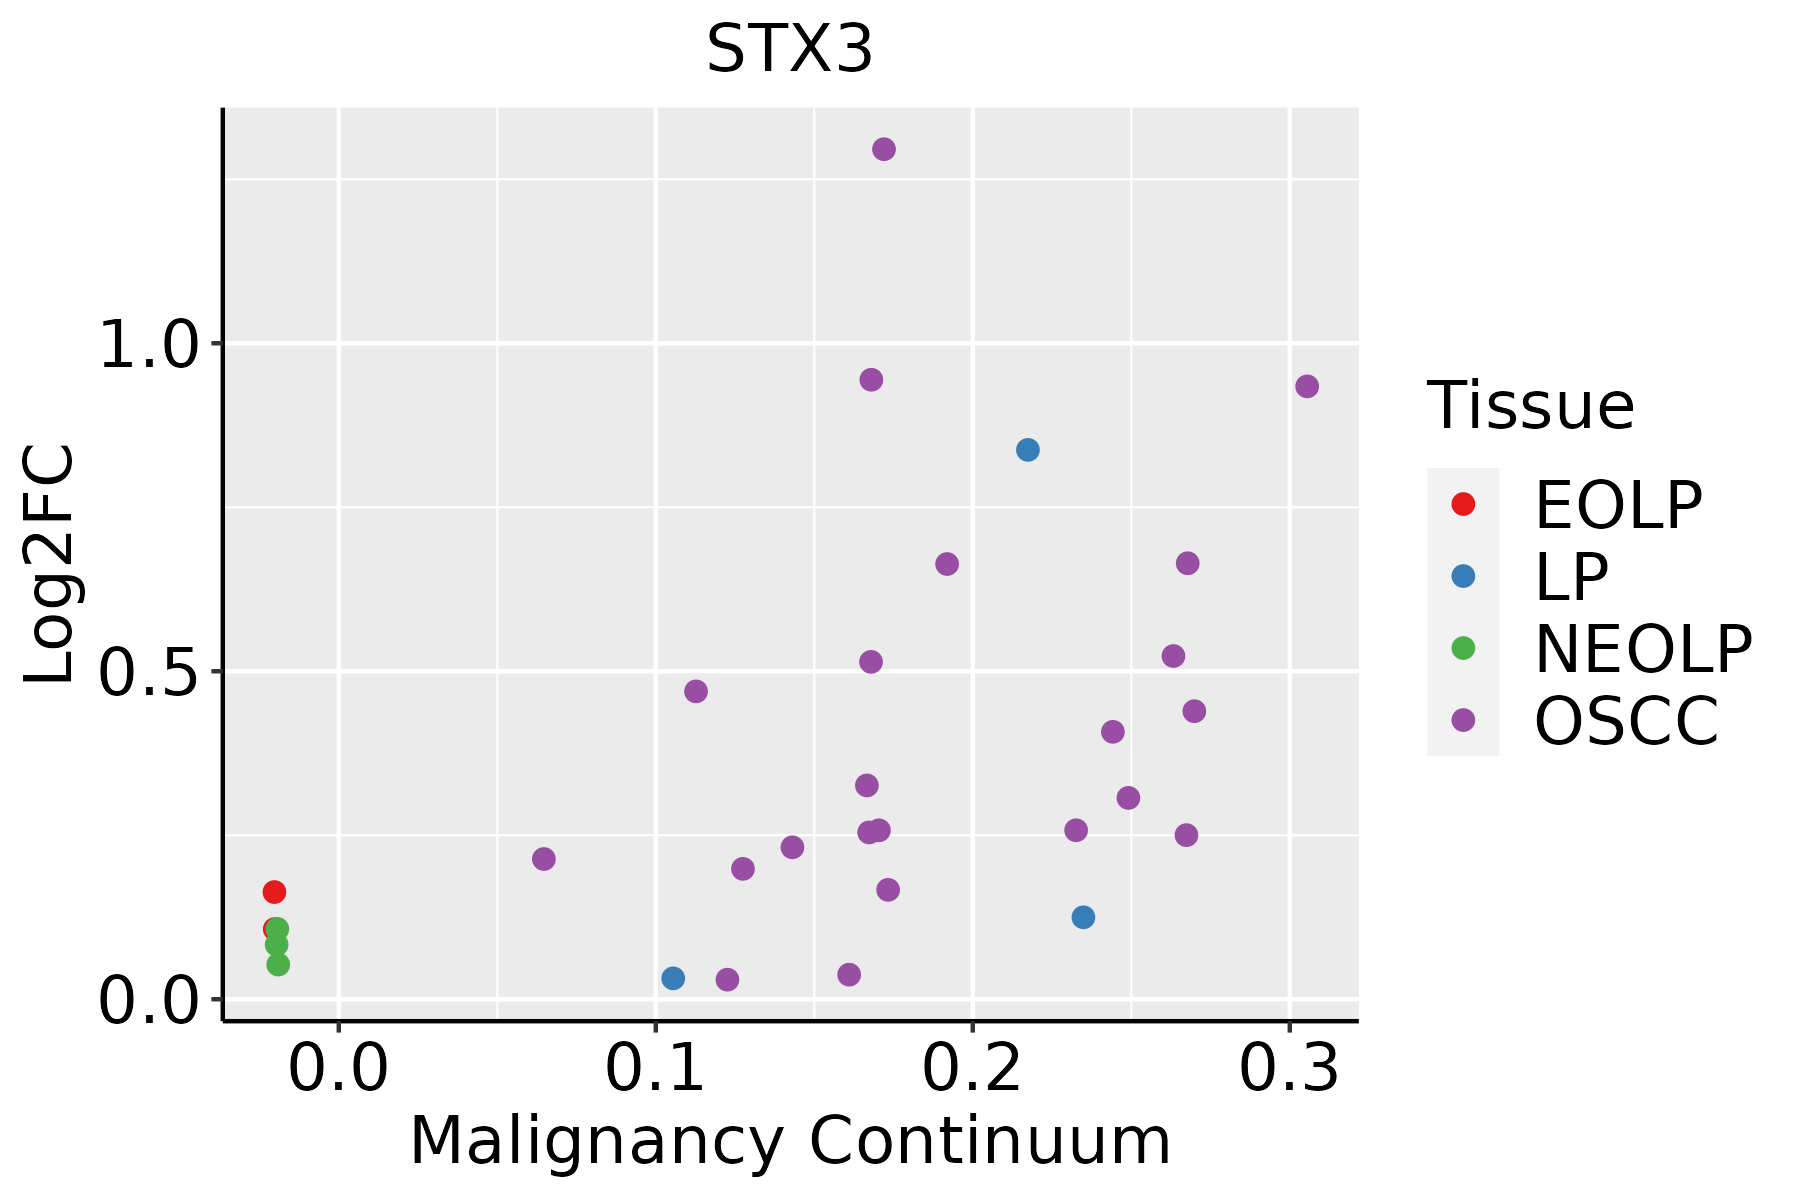 | EOLP: Erosive Oral lichen planus |
| LP: leukoplakia | ||
| NEOLP: Non-erosive oral lichen planus | ||
| OSCC: Oral squamous cell carcinoma | ||
| Prostate | 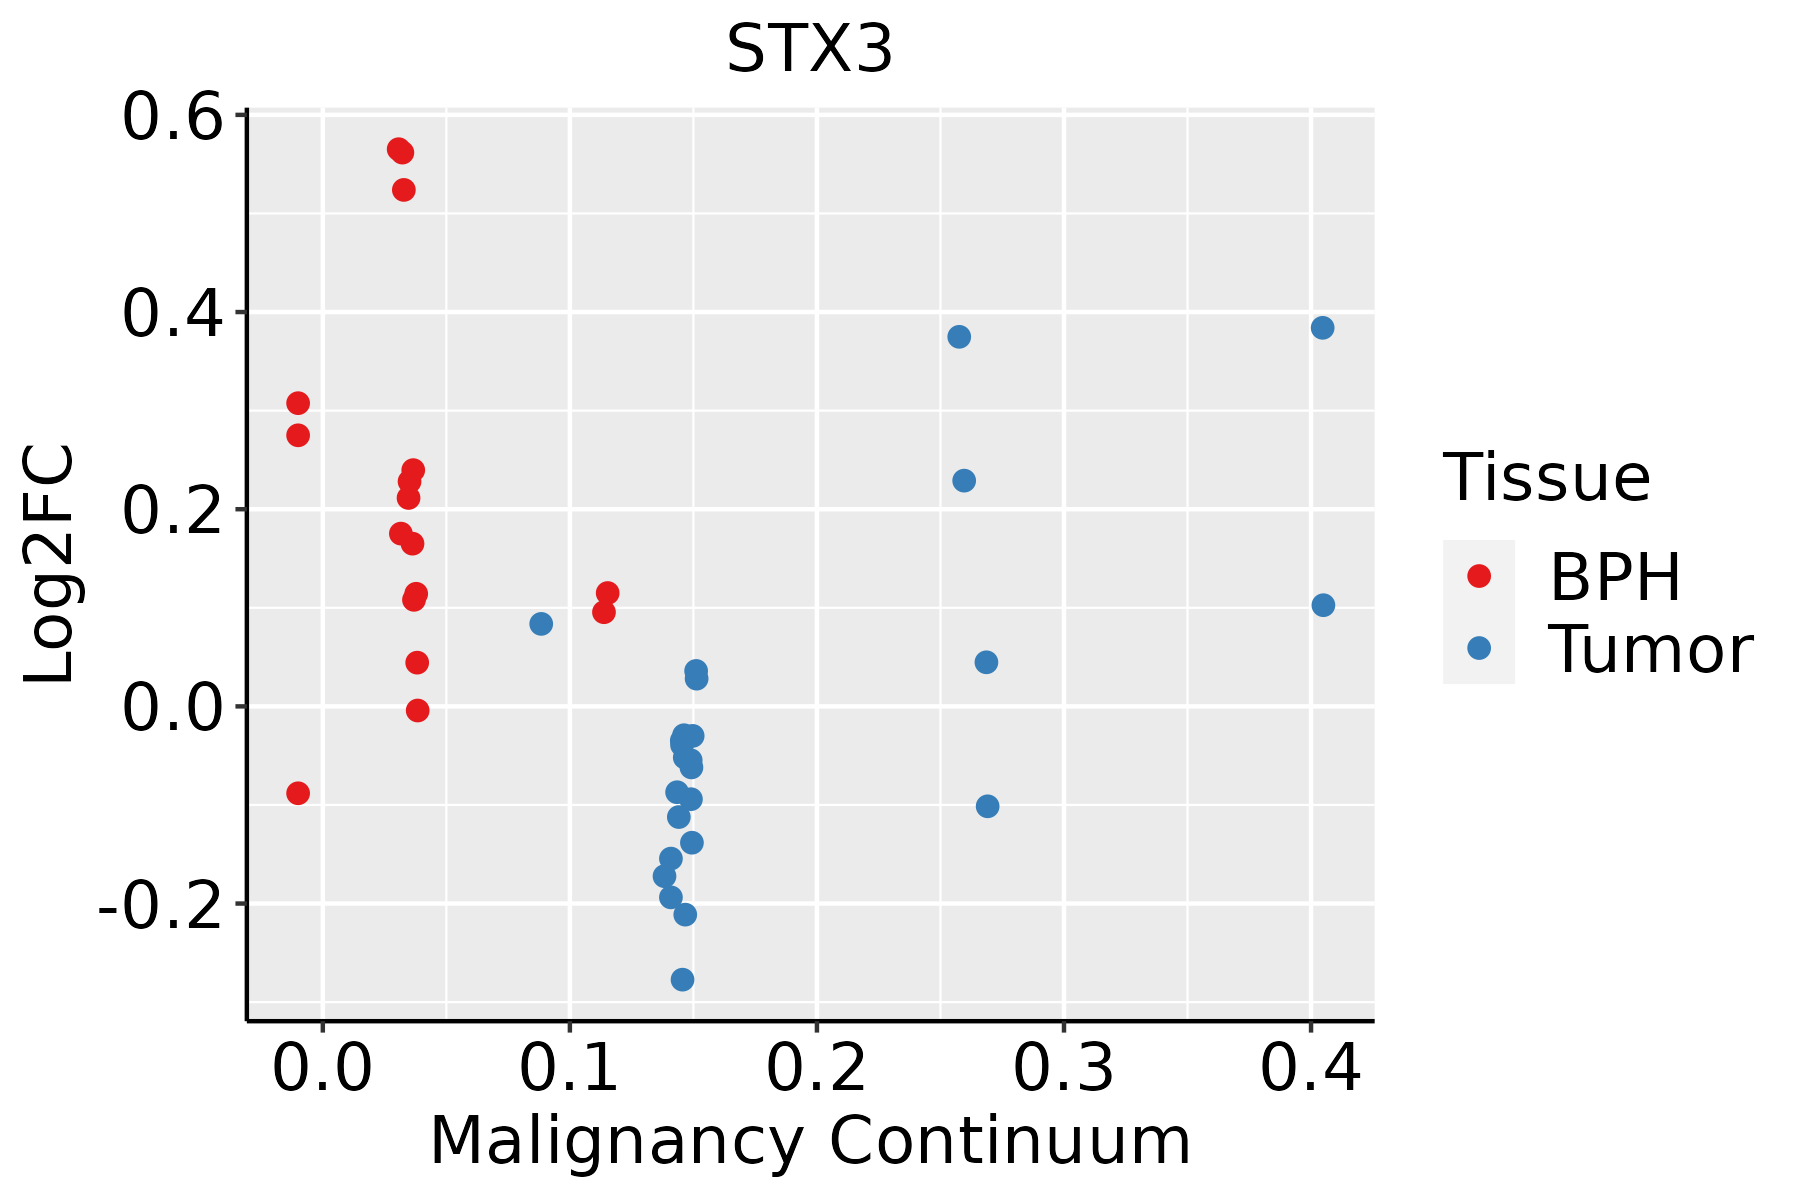 | BPH: Benign Prostatic Hyperplasia |
| ∗log2FC in expression of this searched gene in stem-like cells from each diseased tissue sample relative to stem-like cells in normal samples in each tissue plotted against the malignancy continuum. Samples are colored based on if they are from different disease stage. |
Top |
Malignant transformation related pathway analysis |
| Find out the enriched GO biological processes and KEGG pathways involved in transition from healthy to precancer to cancer |
| Tissue | Disease Stage | Enriched GO biological Processes |
| Colorectum | AD |  |
| Colorectum | SER |  |
| Colorectum | MSS |  |
| Colorectum | MSI-H |  |
| Colorectum | FAP |  |
| ∗Top 15 enriched GO BP terms are showed in the bar plot of each disease state in each tissue. Each row represents a significant GO biological process which is colored according to the -log10(p.adjust). |
| Page: 1 2 3 4 5 6 7 8 9 |
| GO ID | Tissue | Disease Stage | Description | Gene Ratio | Bg Ratio | pvalue | p.adjust | Count |
| GO:0072659 | Colorectum | AD | protein localization to plasma membrane | 122/3918 | 284/18723 | 2.86e-17 | 1.49e-14 | 122 |
| GO:1990778 | Colorectum | AD | protein localization to cell periphery | 129/3918 | 333/18723 | 5.51e-14 | 1.15e-11 | 129 |
| GO:1903829 | Colorectum | AD | positive regulation of cellular protein localization | 110/3918 | 276/18723 | 4.58e-13 | 8.44e-11 | 110 |
| GO:0090150 | Colorectum | AD | establishment of protein localization to membrane | 100/3918 | 260/18723 | 6.01e-11 | 6.33e-09 | 100 |
| GO:1905475 | Colorectum | AD | regulation of protein localization to membrane | 73/3918 | 175/18723 | 3.37e-10 | 2.93e-08 | 73 |
| GO:1903076 | Colorectum | AD | regulation of protein localization to plasma membrane | 48/3918 | 104/18723 | 7.17e-09 | 4.36e-07 | 48 |
| GO:1904375 | Colorectum | AD | regulation of protein localization to cell periphery | 54/3918 | 125/18723 | 1.52e-08 | 9.00e-07 | 54 |
| GO:0098876 | Colorectum | AD | vesicle-mediated transport to the plasma membrane | 57/3918 | 136/18723 | 2.30e-08 | 1.27e-06 | 57 |
| GO:1905477 | Colorectum | AD | positive regulation of protein localization to membrane | 46/3918 | 106/18723 | 1.47e-07 | 6.64e-06 | 46 |
| GO:0016050 | Colorectum | AD | vesicle organization | 101/3918 | 300/18723 | 1.65e-07 | 7.17e-06 | 101 |
| GO:1903078 | Colorectum | AD | positive regulation of protein localization to plasma membrane | 28/3918 | 62/18723 | 1.57e-05 | 3.34e-04 | 28 |
| GO:1904377 | Colorectum | AD | positive regulation of protein localization to cell periphery | 30/3918 | 69/18723 | 1.98e-05 | 4.05e-04 | 30 |
| GO:0045785 | Colorectum | AD | positive regulation of cell adhesion | 122/3918 | 437/18723 | 2.65e-04 | 3.28e-03 | 122 |
| GO:0022406 | Colorectum | AD | membrane docking | 31/3918 | 86/18723 | 8.67e-04 | 8.45e-03 | 31 |
| GO:0140056 | Colorectum | AD | organelle localization by membrane tethering | 28/3918 | 77/18723 | 1.29e-03 | 1.14e-02 | 28 |
| GO:0006887 | Colorectum | AD | exocytosis | 96/3918 | 352/18723 | 2.48e-03 | 1.90e-02 | 96 |
| GO:1902414 | Colorectum | AD | protein localization to cell junction | 31/3918 | 94/18723 | 4.30e-03 | 2.95e-02 | 31 |
| GO:0034394 | Colorectum | AD | protein localization to cell surface | 24/3918 | 68/18723 | 4.33e-03 | 2.97e-02 | 24 |
| GO:0099072 | Colorectum | AD | regulation of postsynaptic membrane neurotransmitter receptor levels | 22/3918 | 62/18723 | 5.72e-03 | 3.64e-02 | 22 |
| GO:0098877 | Colorectum | AD | neurotransmitter receptor transport to plasma membrane | 9/3918 | 18/18723 | 5.82e-03 | 3.67e-02 | 9 |
| Page: 1 2 3 4 5 6 7 8 9 10 11 |
| Pathway ID | Tissue | Disease Stage | Description | Gene Ratio | Bg Ratio | pvalue | p.adjust | qvalue | Count |
| hsa041305 | Esophagus | ESCC | SNARE interactions in vesicular transport | 28/4205 | 33/8465 | 2.75e-05 | 1.32e-04 | 6.75e-05 | 28 |
| hsa0413012 | Esophagus | ESCC | SNARE interactions in vesicular transport | 28/4205 | 33/8465 | 2.75e-05 | 1.32e-04 | 6.75e-05 | 28 |
| hsa04130 | Liver | Cirrhotic | SNARE interactions in vesicular transport | 18/2530 | 33/8465 | 2.64e-03 | 1.10e-02 | 6.76e-03 | 18 |
| hsa041301 | Liver | Cirrhotic | SNARE interactions in vesicular transport | 18/2530 | 33/8465 | 2.64e-03 | 1.10e-02 | 6.76e-03 | 18 |
| hsa041302 | Liver | HCC | SNARE interactions in vesicular transport | 25/4020 | 33/8465 | 8.78e-04 | 3.38e-03 | 1.88e-03 | 25 |
| hsa041303 | Liver | HCC | SNARE interactions in vesicular transport | 25/4020 | 33/8465 | 8.78e-04 | 3.38e-03 | 1.88e-03 | 25 |
| hsa041304 | Oral cavity | OSCC | SNARE interactions in vesicular transport | 28/3704 | 33/8465 | 1.31e-06 | 7.18e-06 | 3.66e-06 | 28 |
| hsa0413011 | Oral cavity | OSCC | SNARE interactions in vesicular transport | 28/3704 | 33/8465 | 1.31e-06 | 7.18e-06 | 3.66e-06 | 28 |
| hsa0413021 | Oral cavity | LP | SNARE interactions in vesicular transport | 22/2418 | 33/8465 | 6.00e-06 | 4.76e-05 | 3.07e-05 | 22 |
| hsa0413031 | Oral cavity | LP | SNARE interactions in vesicular transport | 22/2418 | 33/8465 | 6.00e-06 | 4.76e-05 | 3.07e-05 | 22 |
| Page: 1 |
Top |
Cell-cell communication analysis |
| Identification of potential cell-cell interactions between two cell types and their ligand-receptor pairs for different disease states |
| Ligand | Receptor | LRpair | Pathway | Tissue | Disease Stage |
| Page: 1 |
Top |
Single-cell gene regulatory network inference analysis |
| Find out the significant the regulons (TFs) and the target genes of each regulon across cell types for different disease states |
| TF | Cell Type | Tissue | Disease Stage | Target Gene | RSS | Regulon Activity |
| ∗The dot plots of a searched regulon are shown for all cell subpopulations in each disease state of each tissue based on the regulon specific score inferred using pySCENIC and by calculating the average expression. |
| Page: 1 |
Top |
Somatic mutation of malignant transformation related genes |
| Annotation of somatic variants for genes involved in malignant transformation |
| Hugo Symbol | Variant Class | Variant Classification | dbSNP RS | HGVSc | HGVSp | HGVSp Short | SWISSPROT | BIOTYPE | SIFT | PolyPhen | Tumor Sample Barcode | Tissue | Histology | Sex | Age | Stage | Therapy Types | Drugs | Outcome |
| STX3 | SNV | Missense_Mutation | rs201661485 | c.460N>A | p.Glu154Lys | p.E154K | Q13277 | protein_coding | deleterious(0.03) | probably_damaging(0.998) | TCGA-D8-A1JN-01 | Breast | breast invasive carcinoma | Female | >=65 | III/IV | Hormone Therapy | anastrozolum | SD |
| STX3 | SNV | Missense_Mutation | novel | c.458T>A | p.Leu153His | p.L153H | Q13277 | protein_coding | deleterious(0) | probably_damaging(1) | TCGA-E2-A1LL-01 | Breast | breast invasive carcinoma | Female | >=65 | III/IV | Chemotherapy | docetaxel | PD |
| STX3 | SNV | Missense_Mutation | novel | c.179N>G | p.Tyr60Cys | p.Y60C | Q13277 | protein_coding | deleterious(0) | probably_damaging(0.967) | TCGA-E2-A574-01 | Breast | breast invasive carcinoma | Female | <65 | I/II | Chemotherapy | adriamycin | SD |
| STX3 | SNV | Missense_Mutation | c.334N>A | p.Asp112Asn | p.D112N | Q13277 | protein_coding | deleterious(0.02) | benign(0.254) | TCGA-2W-A8YY-01 | Cervix | cervical & endocervical cancer | Female | <65 | I/II | Chemotherapy | cisplatin | CR | |
| STX3 | SNV | Missense_Mutation | c.583N>A | p.Glu195Lys | p.E195K | Q13277 | protein_coding | deleterious(0) | probably_damaging(0.948) | TCGA-C5-A7CO-01 | Cervix | cervical & endocervical cancer | Female | >=65 | I/II | Chemotherapy | cisplatin | SD | |
| STX3 | SNV | Missense_Mutation | c.755N>C | p.Lys252Thr | p.K252T | Q13277 | protein_coding | deleterious(0) | probably_damaging(0.976) | TCGA-FU-A3HZ-01 | Cervix | cervical & endocervical cancer | Female | <65 | I/II | Chemotherapy | cisplatin | CR | |
| STX3 | SNV | Missense_Mutation | novel | c.577G>A | p.Glu193Lys | p.E193K | Q13277 | protein_coding | deleterious(0) | probably_damaging(1) | TCGA-VS-A8QC-01 | Cervix | cervical & endocervical cancer | Female | <65 | I/II | Chemotherapy | paclitaxel | PD |
| STX3 | SNV | Missense_Mutation | c.249N>C | p.Glu83Asp | p.E83D | Q13277 | protein_coding | tolerated(1) | benign(0.009) | TCGA-A6-2682-01 | Colorectum | colon adenocarcinoma | Male | >=65 | III/IV | Chemotherapy | 5 | PD | |
| STX3 | SNV | Missense_Mutation | rs767164155 | c.451N>T | p.Arg151Trp | p.R151W | Q13277 | protein_coding | deleterious(0) | probably_damaging(1) | TCGA-AA-3492-01 | Colorectum | colon adenocarcinoma | Female | >=65 | I/II | Unknown | Unknown | SD |
| STX3 | SNV | Missense_Mutation | c.281N>C | p.Lys94Thr | p.K94T | Q13277 | protein_coding | deleterious(0.02) | probably_damaging(0.926) | TCGA-AA-3984-01 | Colorectum | colon adenocarcinoma | Female | <65 | I/II | Unknown | Unknown | SD |
| Page: 1 2 3 4 5 |
Top |
Related drugs of malignant transformation related genes |
| Identification of chemicals and drugs interact with genes involved in malignant transfromation |
| (DGIdb 4.0) |
| Entrez ID | Symbol | Category | Interaction Types | Drug Claim Name | Drug Name | PMIDs |
| Page: 1 |

Copyright 2023-Present -The University of Texas Health Science Center at Houston |