
|
|||||
|
 | |
| |
| |
| |
| |
| |
|
Gene: ST6GALNAC2 |
Gene summary for ST6GALNAC2 |
| Gene information | Species | Human | Gene symbol | ST6GALNAC2 | Gene ID | 10610 |
| Gene name | ST6 N-acetylgalactosaminide alpha-2,6-sialyltransferase 2 | |
| Gene Alias | SAITL1 | |
| Cytomap | 17q25.1 | |
| Gene Type | protein-coding | GO ID | GO:0006464 | UniProtAcc | A0A024R8M1 |
Top |
Malignant transformation analysis |
| Identification of the aberrant gene expression in precancerous and cancerous lesions by comparing the gene expression of stem-like cells in diseased tissues with normal stem cells |
| Entrez ID | Symbol | Replicates | Species | Organ | Tissue | Adj P-value | Log2FC | Malignancy |
| 10610 | ST6GALNAC2 | P130T-E | Human | Esophagus | ESCC | 2.13e-33 | 8.59e-01 | 0.1676 |
| 10610 | ST6GALNAC2 | C04 | Human | Oral cavity | OSCC | 1.68e-22 | 8.75e-01 | 0.2633 |
| 10610 | ST6GALNAC2 | C21 | Human | Oral cavity | OSCC | 2.42e-48 | 1.62e+00 | 0.2678 |
| 10610 | ST6GALNAC2 | C30 | Human | Oral cavity | OSCC | 4.73e-56 | 2.28e+00 | 0.3055 |
| 10610 | ST6GALNAC2 | C38 | Human | Oral cavity | OSCC | 8.55e-19 | 1.78e+00 | 0.172 |
| 10610 | ST6GALNAC2 | C43 | Human | Oral cavity | OSCC | 2.48e-24 | 5.79e-01 | 0.1704 |
| 10610 | ST6GALNAC2 | C46 | Human | Oral cavity | OSCC | 2.10e-27 | 6.14e-01 | 0.1673 |
| 10610 | ST6GALNAC2 | C51 | Human | Oral cavity | OSCC | 2.62e-17 | 8.73e-01 | 0.2674 |
| 10610 | ST6GALNAC2 | C57 | Human | Oral cavity | OSCC | 1.38e-07 | 4.51e-01 | 0.1679 |
| 10610 | ST6GALNAC2 | C06 | Human | Oral cavity | OSCC | 4.84e-09 | 1.48e+00 | 0.2699 |
| 10610 | ST6GALNAC2 | C08 | Human | Oral cavity | OSCC | 6.28e-78 | 1.82e+00 | 0.1919 |
| 10610 | ST6GALNAC2 | C09 | Human | Oral cavity | OSCC | 1.01e-06 | 2.58e-01 | 0.1431 |
| 10610 | ST6GALNAC2 | LN22 | Human | Oral cavity | OSCC | 3.60e-09 | 6.65e-01 | 0.1733 |
| 10610 | ST6GALNAC2 | LN38 | Human | Oral cavity | OSCC | 1.89e-07 | 1.48e+00 | 0.168 |
| 10610 | ST6GALNAC2 | LN46 | Human | Oral cavity | OSCC | 9.80e-13 | 5.34e-01 | 0.1666 |
| 10610 | ST6GALNAC2 | LP15 | Human | Oral cavity | LP | 2.29e-07 | 9.27e-01 | 0.2174 |
| 10610 | ST6GALNAC2 | LP17 | Human | Oral cavity | LP | 9.48e-03 | 6.01e-01 | 0.2349 |
| 10610 | ST6GALNAC2 | SYSMH1 | Human | Oral cavity | OSCC | 1.08e-42 | 7.45e-01 | 0.1127 |
| 10610 | ST6GALNAC2 | SYSMH2 | Human | Oral cavity | OSCC | 3.12e-26 | 6.69e-01 | 0.2326 |
| 10610 | ST6GALNAC2 | SYSMH3 | Human | Oral cavity | OSCC | 1.98e-23 | 5.92e-01 | 0.2442 |
| Page: 1 2 3 4 5 |
| Tissue | Expression Dynamics | Abbreviation |
| Esophagus | 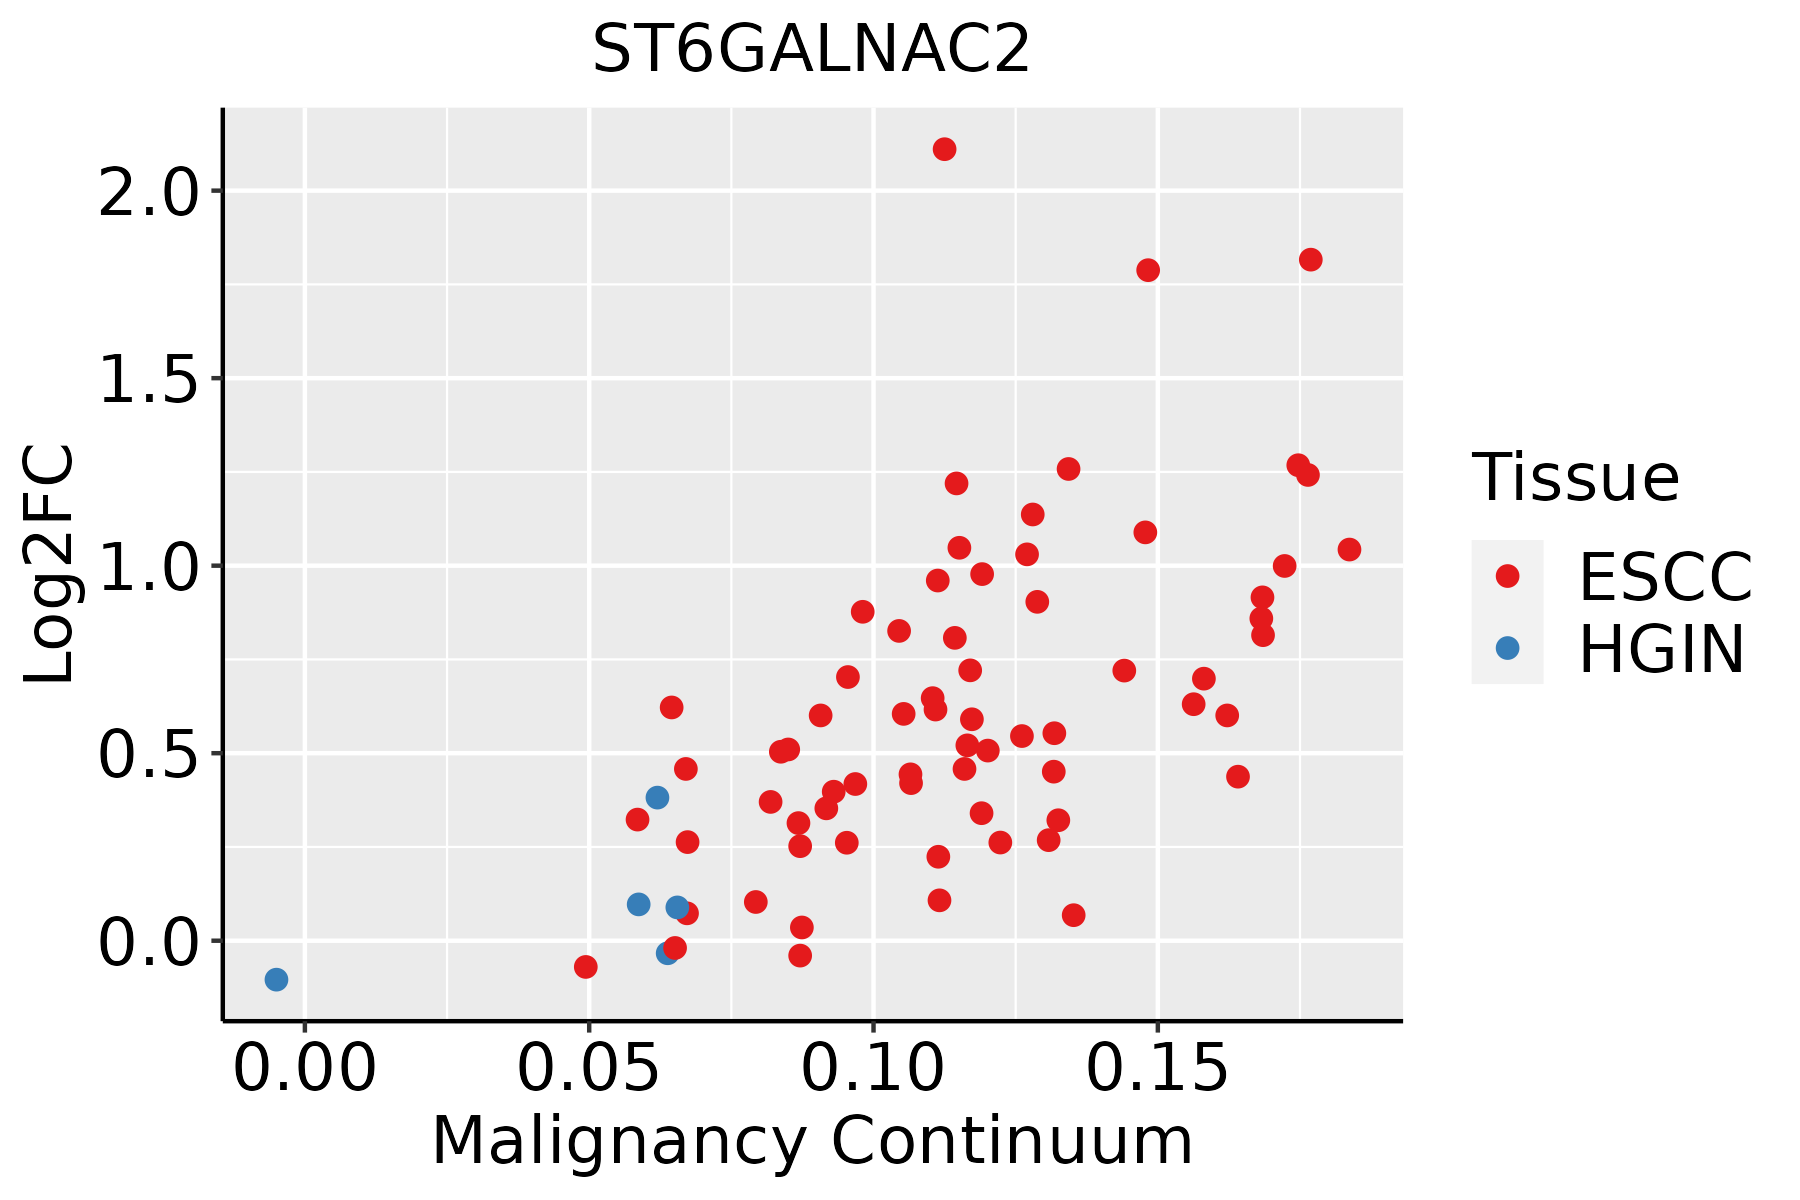 | ESCC: Esophageal squamous cell carcinoma |
| HGIN: High-grade intraepithelial neoplasias | ||
| LGIN: Low-grade intraepithelial neoplasias | ||
| Oral Cavity | 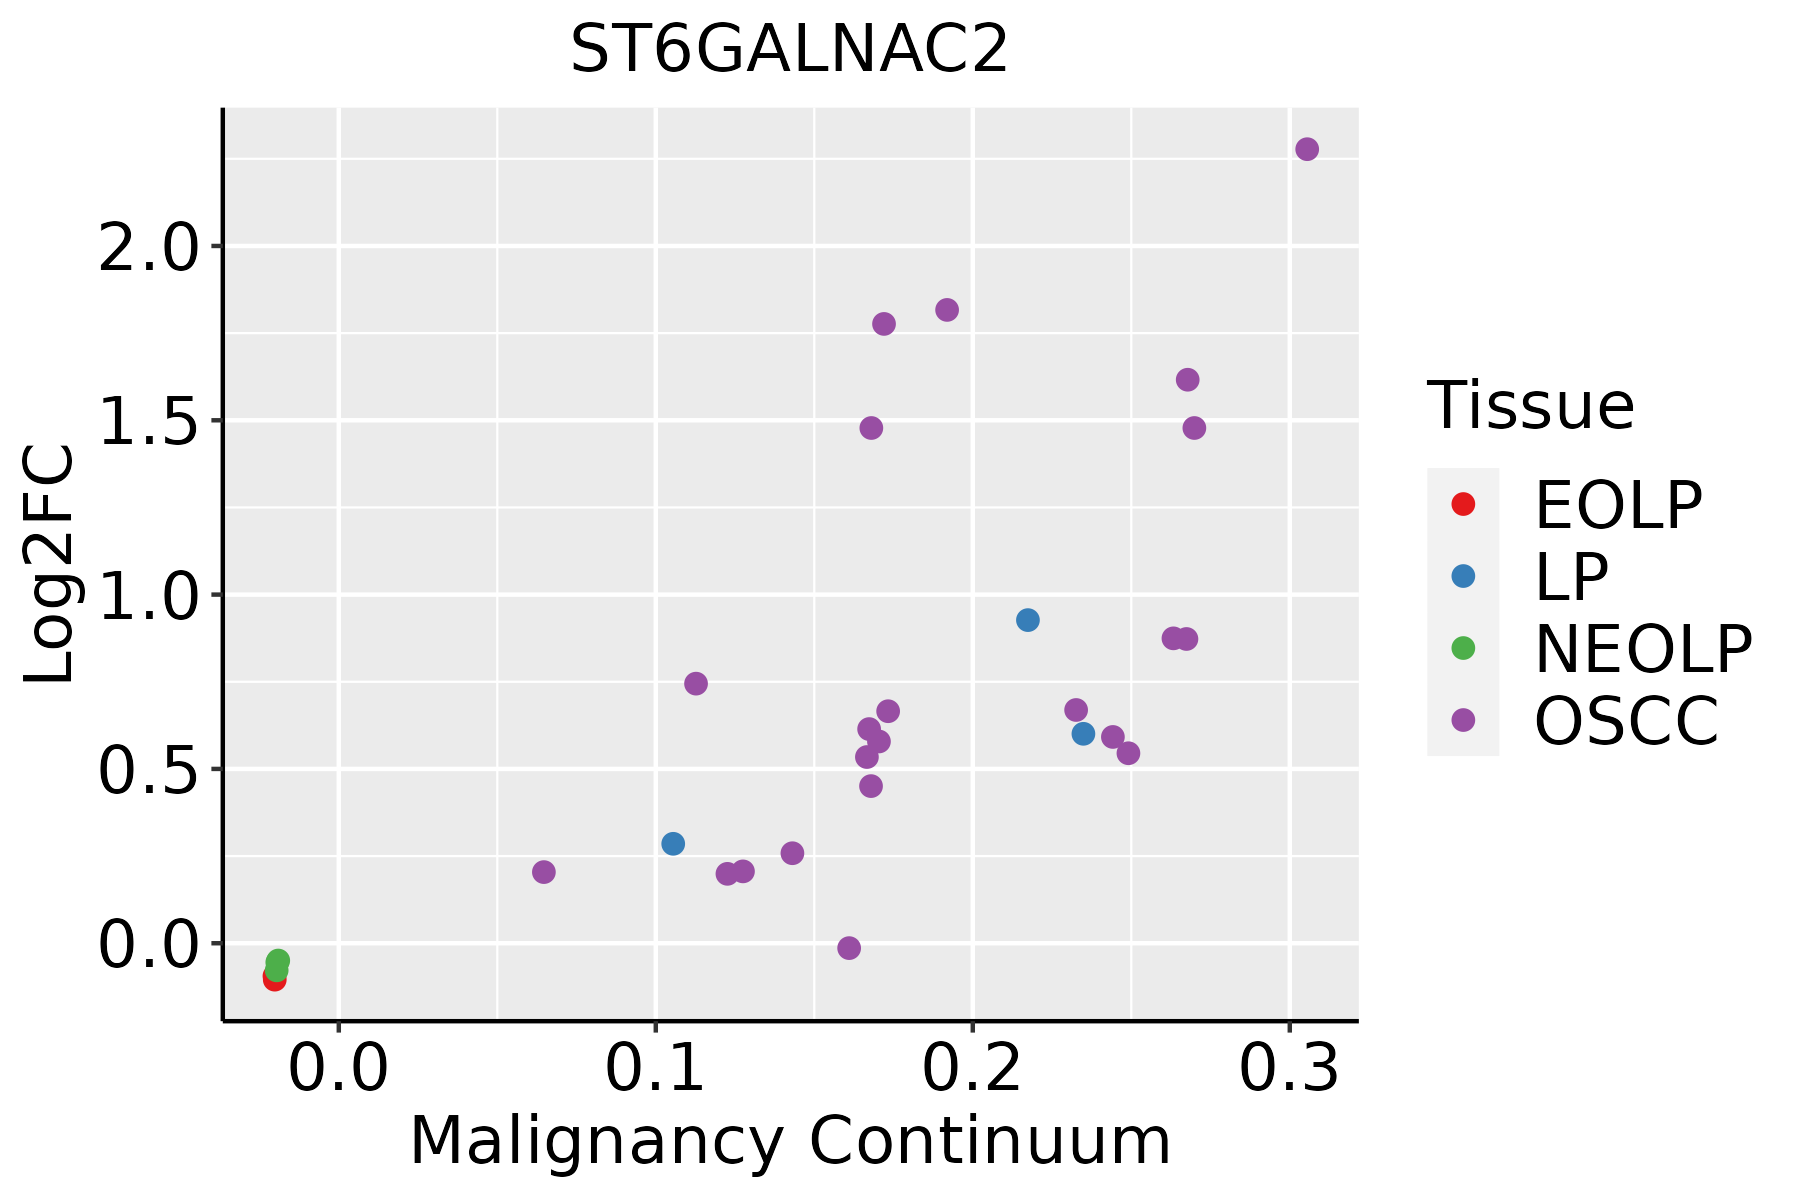 | EOLP: Erosive Oral lichen planus |
| LP: leukoplakia | ||
| NEOLP: Non-erosive oral lichen planus | ||
| OSCC: Oral squamous cell carcinoma | ||
| Skin | 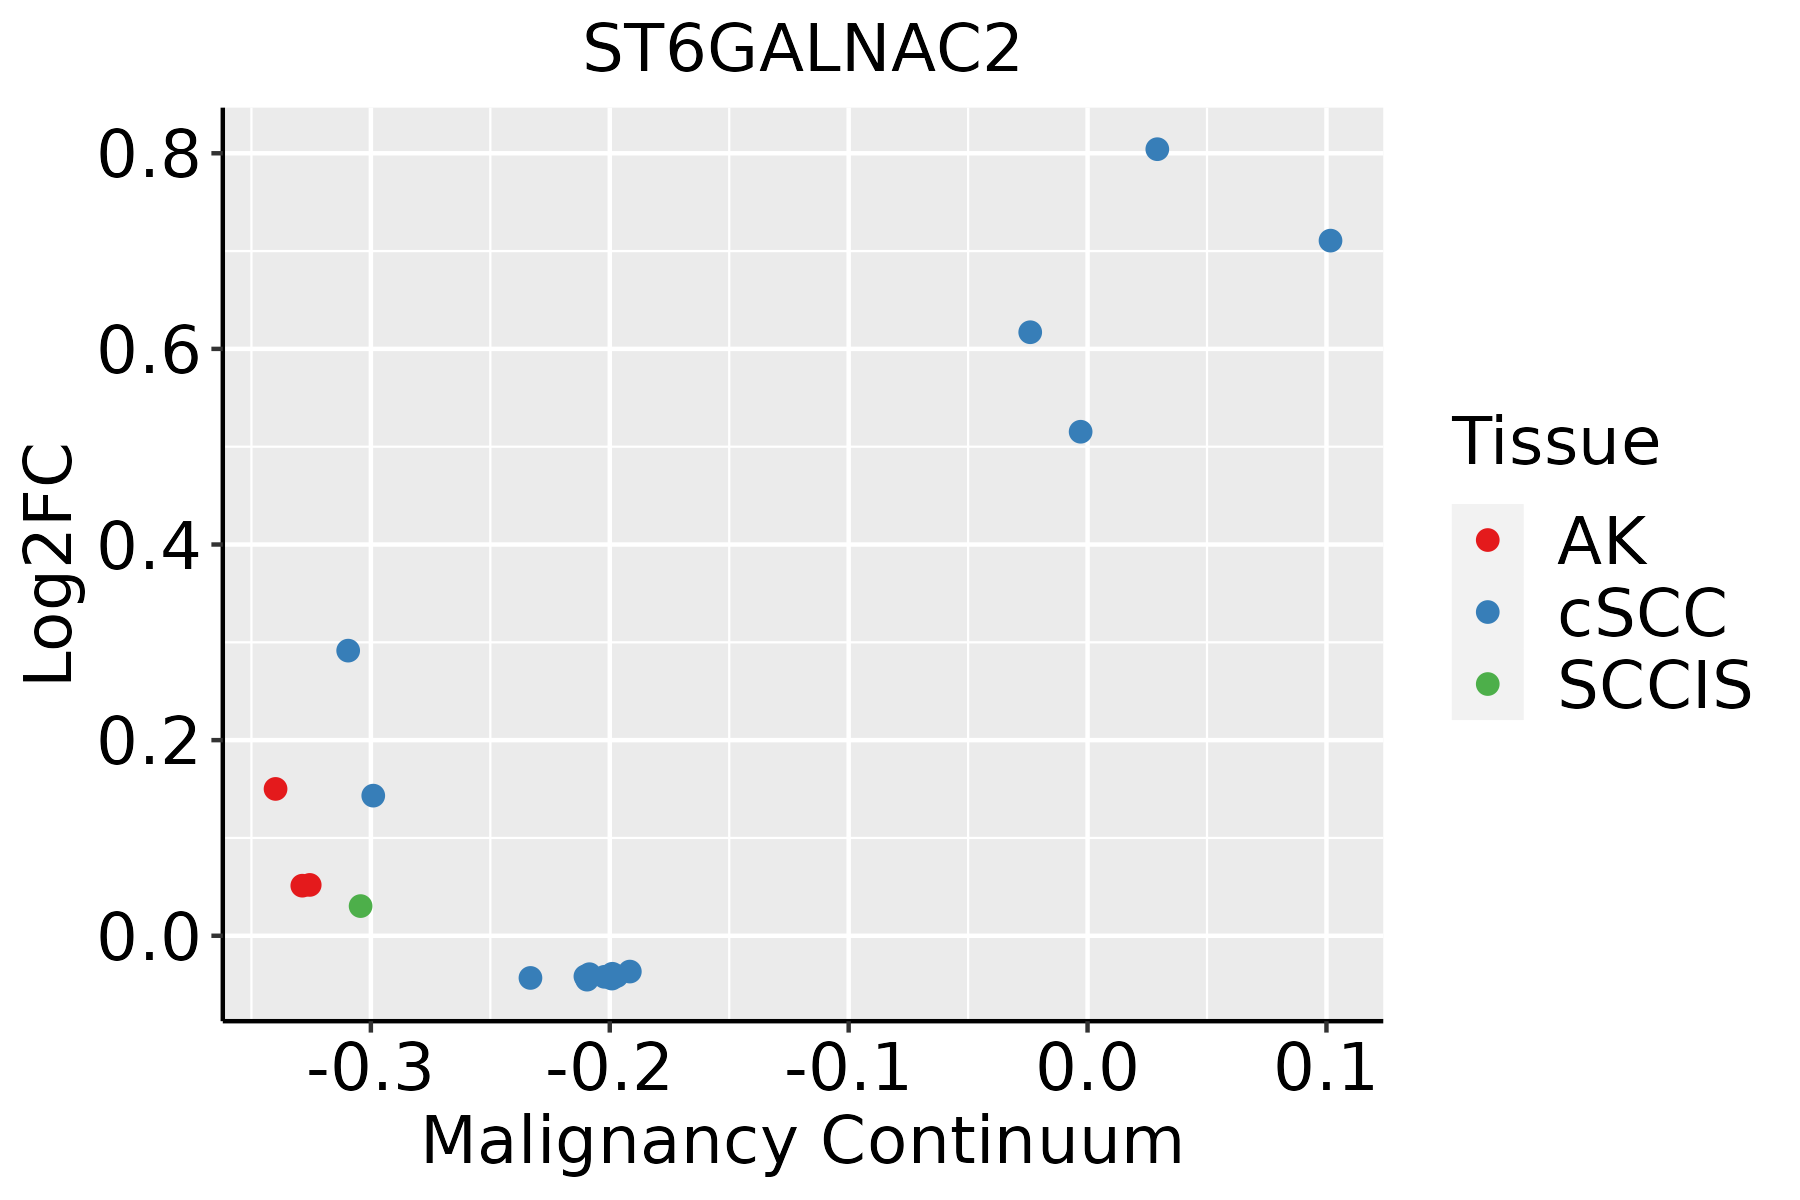 | AK: Actinic keratosis |
| cSCC: Cutaneous squamous cell carcinoma | ||
| SCCIS:squamous cell carcinoma in situ |
| ∗log2FC in expression of this searched gene in stem-like cells from each diseased tissue sample relative to stem-like cells in normal samples in each tissue plotted against the malignancy continuum. Samples are colored based on if they are from different disease stage. |
Top |
Malignant transformation related pathway analysis |
| Find out the enriched GO biological processes and KEGG pathways involved in transition from healthy to precancer to cancer |
| Tissue | Disease Stage | Enriched GO biological Processes |
| Colorectum | AD |  |
| Colorectum | SER |  |
| Colorectum | MSS |  |
| Colorectum | MSI-H |  |
| Colorectum | FAP |  |
| ∗Top 15 enriched GO BP terms are showed in the bar plot of each disease state in each tissue. Each row represents a significant GO biological process which is colored according to the -log10(p.adjust). |
| Page: 1 2 3 4 5 6 7 8 9 |
| GO ID | Tissue | Disease Stage | Description | Gene Ratio | Bg Ratio | pvalue | p.adjust | Count |
| GO:001603227 | Esophagus | HGIN | viral process | 118/2587 | 415/18723 | 3.01e-15 | 6.22e-13 | 118 |
| GO:001908016 | Esophagus | HGIN | viral gene expression | 28/2587 | 94/18723 | 4.52e-05 | 1.09e-03 | 28 |
| GO:0016032111 | Esophagus | ESCC | viral process | 301/8552 | 415/18723 | 3.34e-29 | 1.32e-26 | 301 |
| GO:001908017 | Esophagus | ESCC | viral gene expression | 80/8552 | 94/18723 | 2.04e-15 | 1.28e-13 | 80 |
| GO:00091002 | Esophagus | ESCC | glycoprotein metabolic process | 226/8552 | 387/18723 | 2.64e-07 | 3.94e-06 | 226 |
| GO:00700854 | Esophagus | ESCC | glycosylation | 144/8552 | 240/18723 | 5.12e-06 | 5.38e-05 | 144 |
| GO:00064865 | Esophagus | ESCC | protein glycosylation | 135/8552 | 226/18723 | 1.36e-05 | 1.24e-04 | 135 |
| GO:00434135 | Esophagus | ESCC | macromolecule glycosylation | 135/8552 | 226/18723 | 1.36e-05 | 1.24e-04 | 135 |
| GO:00091012 | Esophagus | ESCC | glycoprotein biosynthetic process | 181/8552 | 317/18723 | 2.54e-05 | 2.15e-04 | 181 |
| GO:00190826 | Esophagus | ESCC | viral protein processing | 24/8552 | 29/18723 | 4.50e-05 | 3.55e-04 | 24 |
| GO:00064931 | Esophagus | ESCC | protein O-linked glycosylation | 51/8552 | 86/18723 | 7.54e-03 | 2.70e-02 | 51 |
| GO:001603220 | Oral cavity | OSCC | viral process | 274/7305 | 415/18723 | 2.42e-29 | 1.70e-26 | 274 |
| GO:001908010 | Oral cavity | OSCC | viral gene expression | 69/7305 | 94/18723 | 1.26e-11 | 4.44e-10 | 69 |
| GO:00091001 | Oral cavity | OSCC | glycoprotein metabolic process | 185/7305 | 387/18723 | 2.37e-04 | 1.54e-03 | 185 |
| GO:00091011 | Oral cavity | OSCC | glycoprotein biosynthetic process | 151/7305 | 317/18723 | 1.01e-03 | 5.26e-03 | 151 |
| GO:00064864 | Oral cavity | OSCC | protein glycosylation | 111/7305 | 226/18723 | 1.22e-03 | 6.10e-03 | 111 |
| GO:00434134 | Oral cavity | OSCC | macromolecule glycosylation | 111/7305 | 226/18723 | 1.22e-03 | 6.10e-03 | 111 |
| GO:00700853 | Oral cavity | OSCC | glycosylation | 117/7305 | 240/18723 | 1.29e-03 | 6.42e-03 | 117 |
| GO:00190825 | Oral cavity | OSCC | viral protein processing | 19/7305 | 29/18723 | 3.47e-03 | 1.47e-02 | 19 |
| GO:0016032110 | Oral cavity | LP | viral process | 211/4623 | 415/18723 | 4.06e-31 | 3.18e-28 | 211 |
| Page: 1 2 |
| Pathway ID | Tissue | Disease Stage | Description | Gene Ratio | Bg Ratio | pvalue | p.adjust | qvalue | Count |
| Page: 1 |
Top |
Cell-cell communication analysis |
| Identification of potential cell-cell interactions between two cell types and their ligand-receptor pairs for different disease states |
| Ligand | Receptor | LRpair | Pathway | Tissue | Disease Stage |
| Page: 1 |
Top |
Single-cell gene regulatory network inference analysis |
| Find out the significant the regulons (TFs) and the target genes of each regulon across cell types for different disease states |
| TF | Cell Type | Tissue | Disease Stage | Target Gene | RSS | Regulon Activity |
| ∗The dot plots of a searched regulon are shown for all cell subpopulations in each disease state of each tissue based on the regulon specific score inferred using pySCENIC and by calculating the average expression. |
| Page: 1 |
Top |
Somatic mutation of malignant transformation related genes |
| Annotation of somatic variants for genes involved in malignant transformation |
| Hugo Symbol | Variant Class | Variant Classification | dbSNP RS | HGVSc | HGVSp | HGVSp Short | SWISSPROT | BIOTYPE | SIFT | PolyPhen | Tumor Sample Barcode | Tissue | Histology | Sex | Age | Stage | Therapy Types | Drugs | Outcome |
| ST6GALNAC2 | SNV | Missense_Mutation | novel | c.659N>A | p.Pro220Gln | p.P220Q | Q9UJ37 | protein_coding | probably_damaging(0.996) | TCGA-AO-A0J2-01 | Breast | breast invasive carcinoma | Female | <65 | I/II | Chemotherapy | cyclophosphamide | SD | |
| ST6GALNAC2 | SNV | Missense_Mutation | c.695C>T | p.Ser232Leu | p.S232L | Q9UJ37 | protein_coding | benign(0.399) | TCGA-AR-A1AK-01 | Breast | breast invasive carcinoma | Female | >=65 | I/II | Hormone Therapy | anastrozole | SD | ||
| ST6GALNAC2 | SNV | Missense_Mutation | novel | c.758T>C | p.Leu253Pro | p.L253P | Q9UJ37 | protein_coding | benign(0.003) | TCGA-D8-A1XK-01 | Breast | breast invasive carcinoma | Female | <65 | I/II | Chemotherapy | doxorubicine+cyclophosphamide | SD | |
| ST6GALNAC2 | SNV | Missense_Mutation | c.397G>C | p.Glu133Gln | p.E133Q | Q9UJ37 | protein_coding | possibly_damaging(0.709) | TCGA-IR-A3LK-01 | Cervix | cervical & endocervical cancer | Female | >=65 | I/II | Chemotherapy | cisplatin | PD | ||
| ST6GALNAC2 | SNV | Missense_Mutation | novel | c.142G>A | p.Glu48Lys | p.E48K | Q9UJ37 | protein_coding | benign(0.001) | TCGA-VS-A9UZ-01 | Cervix | cervical & endocervical cancer | Female | <65 | I/II | Unknown | Unknown | SD | |
| ST6GALNAC2 | SNV | Missense_Mutation | c.949N>C | p.Cys317Arg | p.C317R | Q9UJ37 | protein_coding | probably_damaging(1) | TCGA-A6-2672-01 | Colorectum | colon adenocarcinoma | Female | >=65 | III/IV | Unknown | Unknown | SD | ||
| ST6GALNAC2 | SNV | Missense_Mutation | rs548481942 | c.280N>A | p.Gly94Arg | p.G94R | Q9UJ37 | protein_coding | benign(0.025) | TCGA-AD-6895-01 | Colorectum | colon adenocarcinoma | Male | >=65 | III/IV | Unknown | Unknown | SD | |
| ST6GALNAC2 | SNV | Missense_Mutation | c.547N>G | p.Ile183Val | p.I183V | Q9UJ37 | protein_coding | benign(0.04) | TCGA-AY-6197-01 | Colorectum | colon adenocarcinoma | Male | <65 | I/II | Unknown | Unknown | SD | ||
| ST6GALNAC2 | SNV | Missense_Mutation | c.418N>T | p.Pro140Ser | p.P140S | Q9UJ37 | protein_coding | benign(0.021) | TCGA-DM-A28G-01 | Colorectum | colon adenocarcinoma | Male | >=65 | I/II | Unknown | Unknown | SD | ||
| ST6GALNAC2 | SNV | Missense_Mutation | rs763902940 | c.706N>A | p.Asp236Asn | p.D236N | Q9UJ37 | protein_coding | probably_damaging(0.98) | TCGA-G4-6302-01 | Colorectum | colon adenocarcinoma | Female | >=65 | I/II | Unknown | Unknown | SD |
| Page: 1 2 3 4 |
Top |
Related drugs of malignant transformation related genes |
| Identification of chemicals and drugs interact with genes involved in malignant transfromation |
| (DGIdb 4.0) |
| Entrez ID | Symbol | Category | Interaction Types | Drug Claim Name | Drug Name | PMIDs |
| Page: 1 |

Copyright 2023-Present -The University of Texas Health Science Center at Houston |