
|
|||||
|
 | |
| |
| |
| |
| |
| |
|
Gene: SP110 |
Gene summary for SP110 |
| Gene information | Species | Human | Gene symbol | SP110 | Gene ID | 3431 |
| Gene name | SP110 nuclear body protein | |
| Gene Alias | IFI41 | |
| Cytomap | 2q37.1 | |
| Gene Type | protein-coding | GO ID | GO:0006139 | UniProtAcc | Q9HB58 |
Top |
Malignant transformation analysis |
| Identification of the aberrant gene expression in precancerous and cancerous lesions by comparing the gene expression of stem-like cells in diseased tissues with normal stem cells |
| Entrez ID | Symbol | Replicates | Species | Organ | Tissue | Adj P-value | Log2FC | Malignancy |
| 3431 | SP110 | P91T-E | Human | Esophagus | ESCC | 1.89e-20 | 1.52e+00 | 0.1828 |
| 3431 | SP110 | P107T-E | Human | Esophagus | ESCC | 2.46e-52 | 1.13e+00 | 0.171 |
| 3431 | SP110 | P126T-E | Human | Esophagus | ESCC | 3.73e-04 | 5.81e-01 | 0.1125 |
| 3431 | SP110 | P127T-E | Human | Esophagus | ESCC | 1.78e-09 | 1.73e-01 | 0.0826 |
| 3431 | SP110 | P128T-E | Human | Esophagus | ESCC | 1.73e-07 | 3.73e-01 | 0.1241 |
| 3431 | SP110 | P130T-E | Human | Esophagus | ESCC | 1.39e-18 | 5.11e-01 | 0.1676 |
| 3431 | SP110 | HCC1_Meng | Human | Liver | HCC | 4.35e-05 | -5.73e-02 | 0.0246 |
| 3431 | SP110 | HCC2_Meng | Human | Liver | HCC | 1.45e-04 | 1.73e-03 | 0.0107 |
| 3431 | SP110 | HCC2 | Human | Liver | HCC | 2.06e-11 | 3.08e+00 | 0.5341 |
| 3431 | SP110 | HCC5 | Human | Liver | HCC | 2.49e-04 | 2.44e+00 | 0.4932 |
| 3431 | SP110 | Pt13.b | Human | Liver | HCC | 4.51e-08 | 1.30e-01 | 0.0251 |
| 3431 | SP110 | Pt14.b | Human | Liver | HCC | 1.35e-03 | 1.98e-01 | 0.018 |
| 3431 | SP110 | Pt14.d | Human | Liver | HCC | 2.28e-02 | 2.36e-01 | 0.0143 |
| 3431 | SP110 | S014 | Human | Liver | HCC | 9.93e-03 | 2.62e-01 | 0.2254 |
| 3431 | SP110 | S015 | Human | Liver | HCC | 3.29e-02 | 3.17e-01 | 0.2375 |
| 3431 | SP110 | S028 | Human | Liver | HCC | 8.60e-14 | 7.99e-01 | 0.2503 |
| 3431 | SP110 | S029 | Human | Liver | HCC | 3.21e-08 | 6.99e-01 | 0.2581 |
| 3431 | SP110 | C04 | Human | Oral cavity | OSCC | 2.98e-03 | 3.82e-01 | 0.2633 |
| 3431 | SP110 | C21 | Human | Oral cavity | OSCC | 2.27e-27 | 8.81e-01 | 0.2678 |
| 3431 | SP110 | C30 | Human | Oral cavity | OSCC | 1.26e-39 | 1.57e+00 | 0.3055 |
| Page: 1 2 3 4 5 6 |
| Tissue | Expression Dynamics | Abbreviation |
| Esophagus |  | ESCC: Esophageal squamous cell carcinoma |
| HGIN: High-grade intraepithelial neoplasias | ||
| LGIN: Low-grade intraepithelial neoplasias | ||
| Liver | 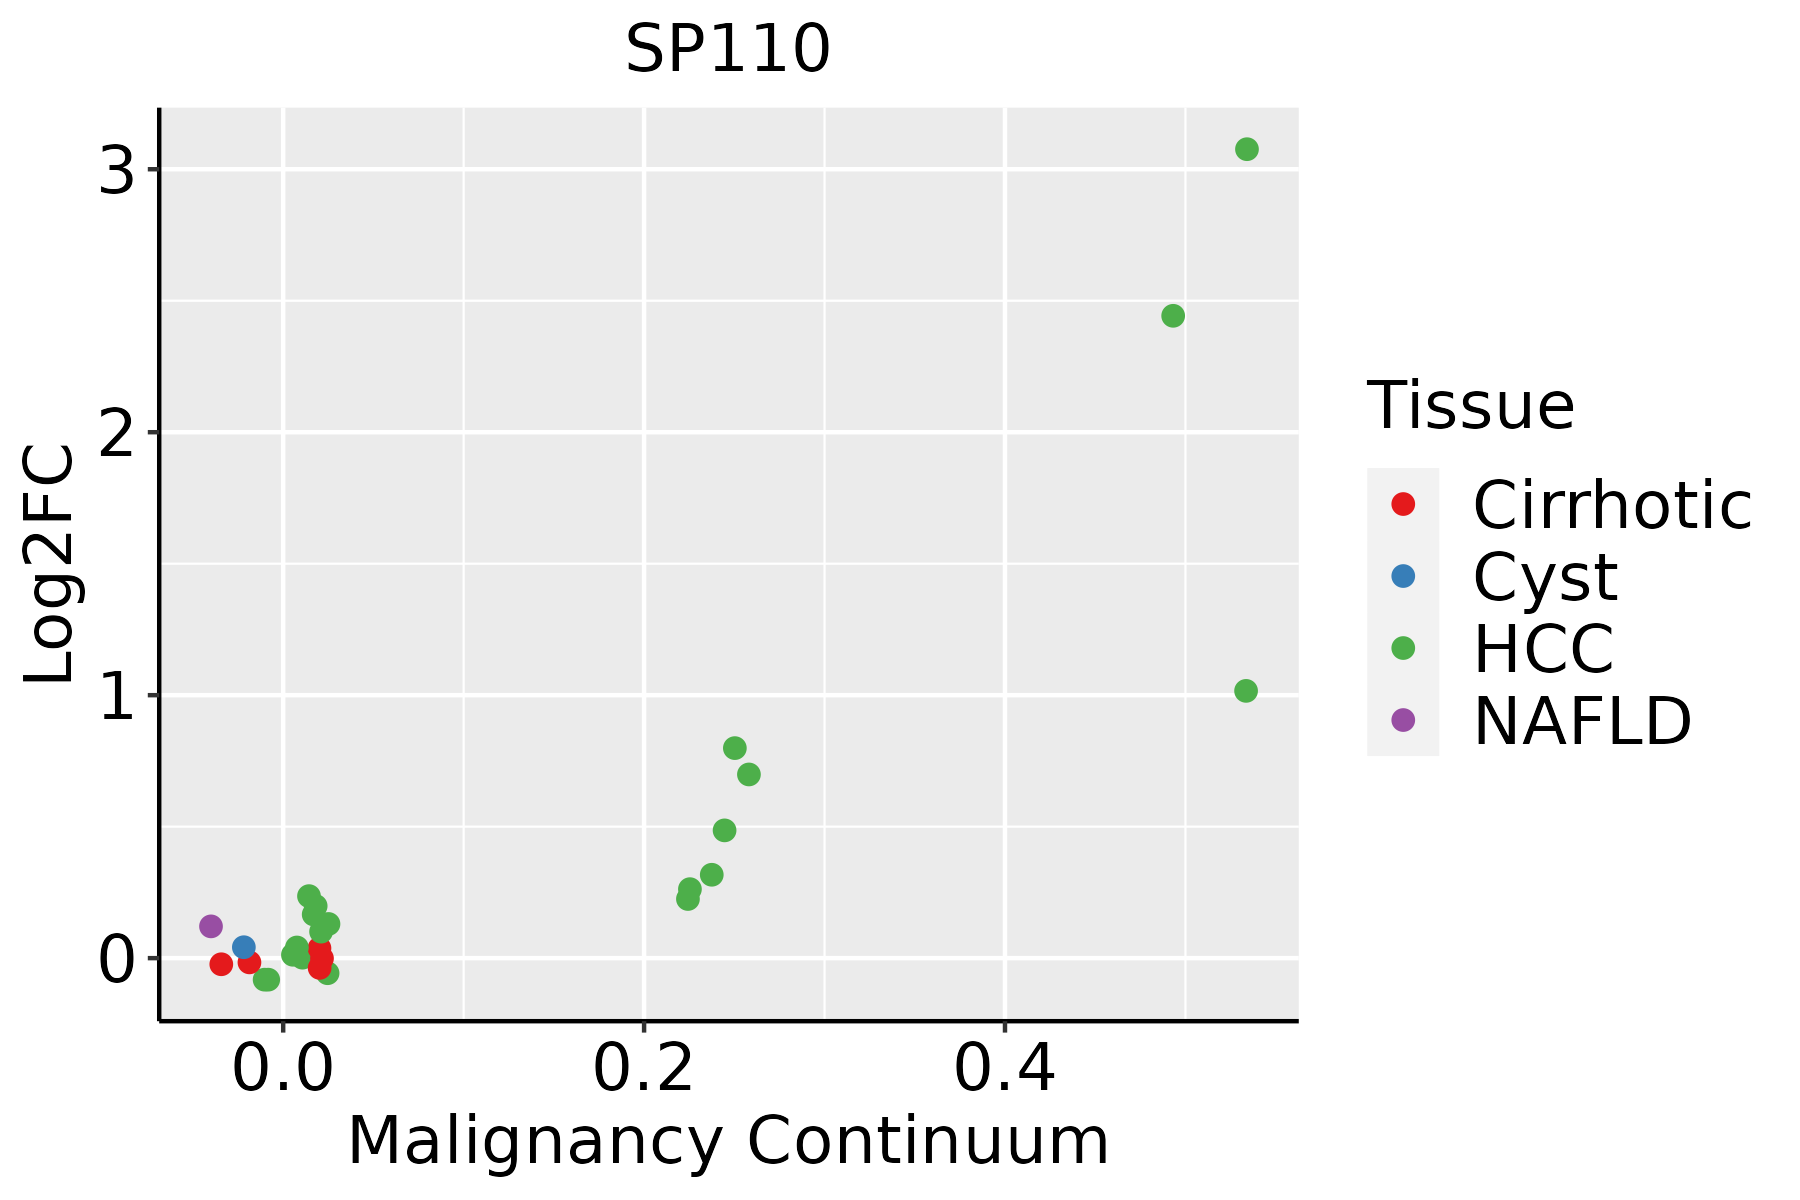 | HCC: Hepatocellular carcinoma |
| NAFLD: Non-alcoholic fatty liver disease | ||
| Oral Cavity | 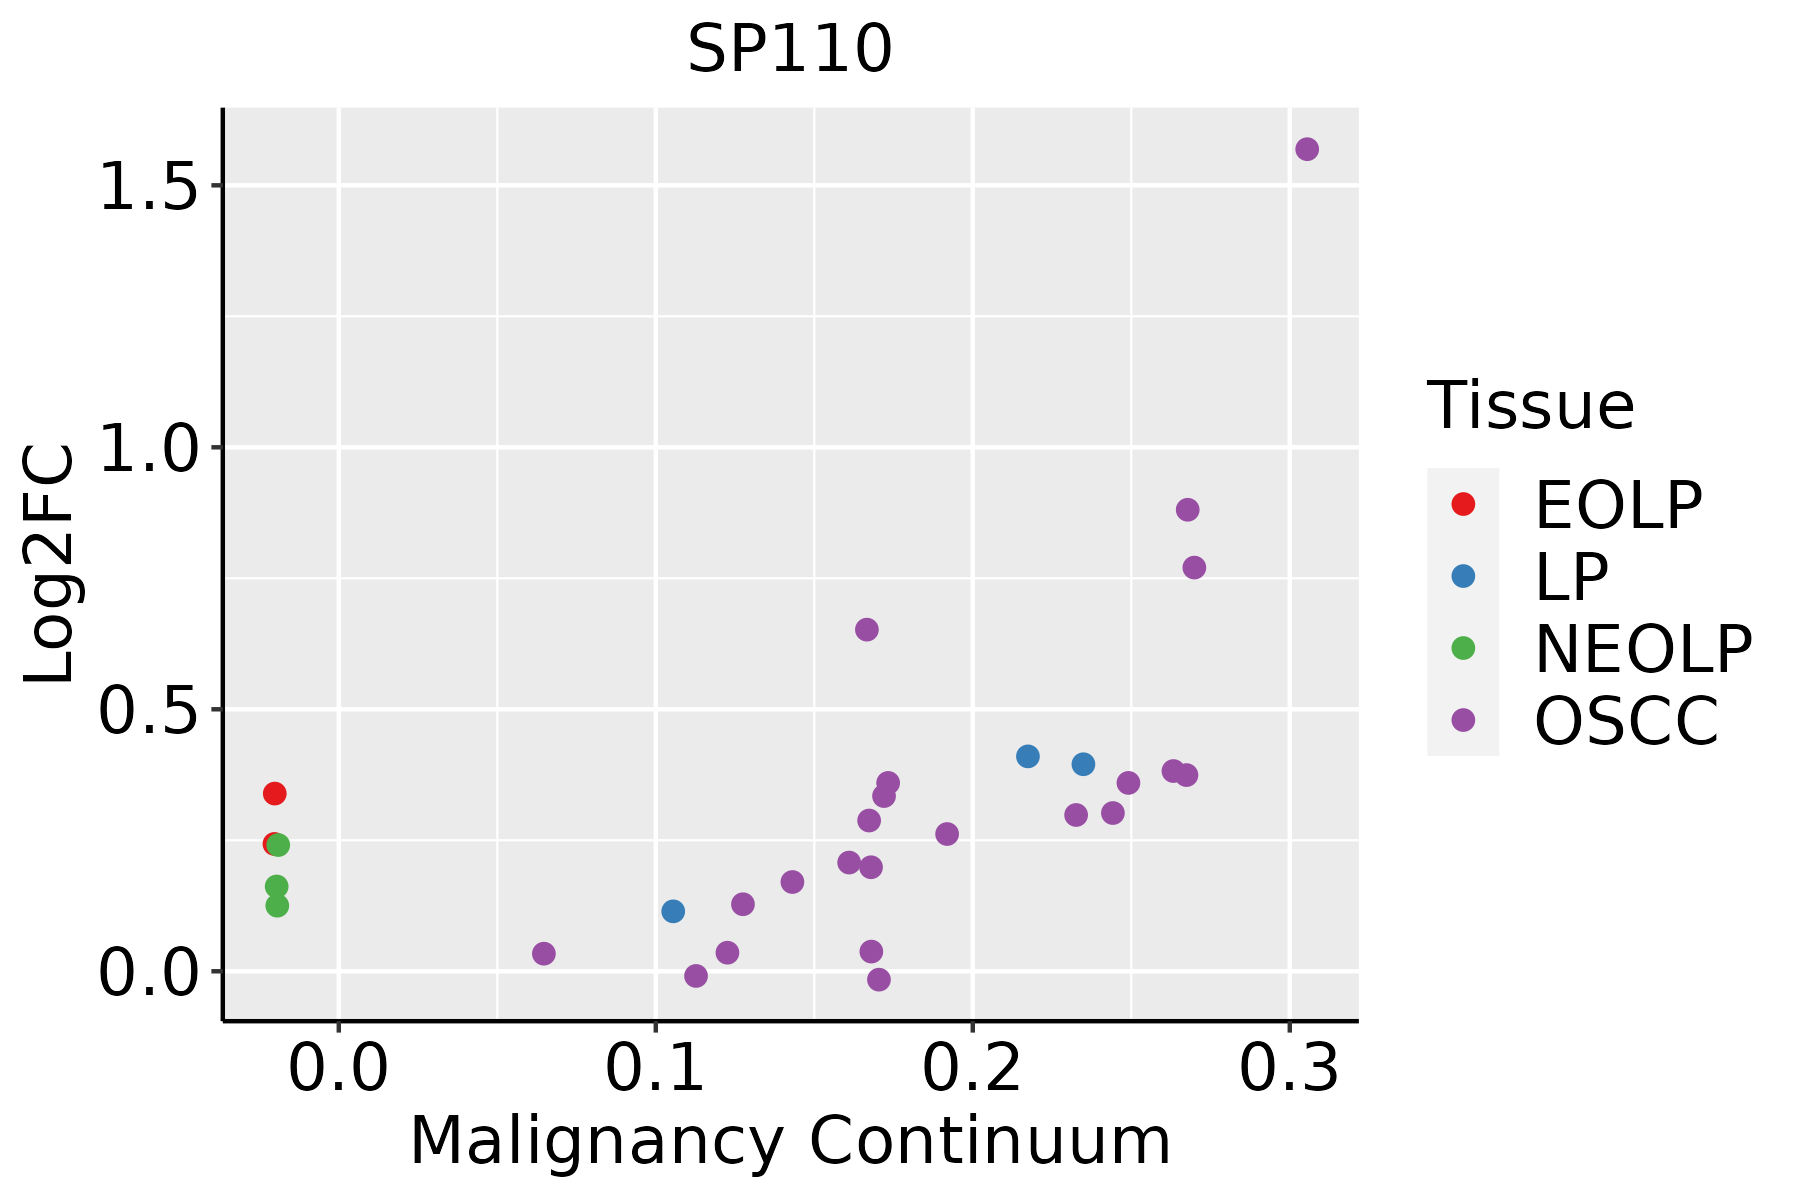 | EOLP: Erosive Oral lichen planus |
| LP: leukoplakia | ||
| NEOLP: Non-erosive oral lichen planus | ||
| OSCC: Oral squamous cell carcinoma | ||
| Skin | 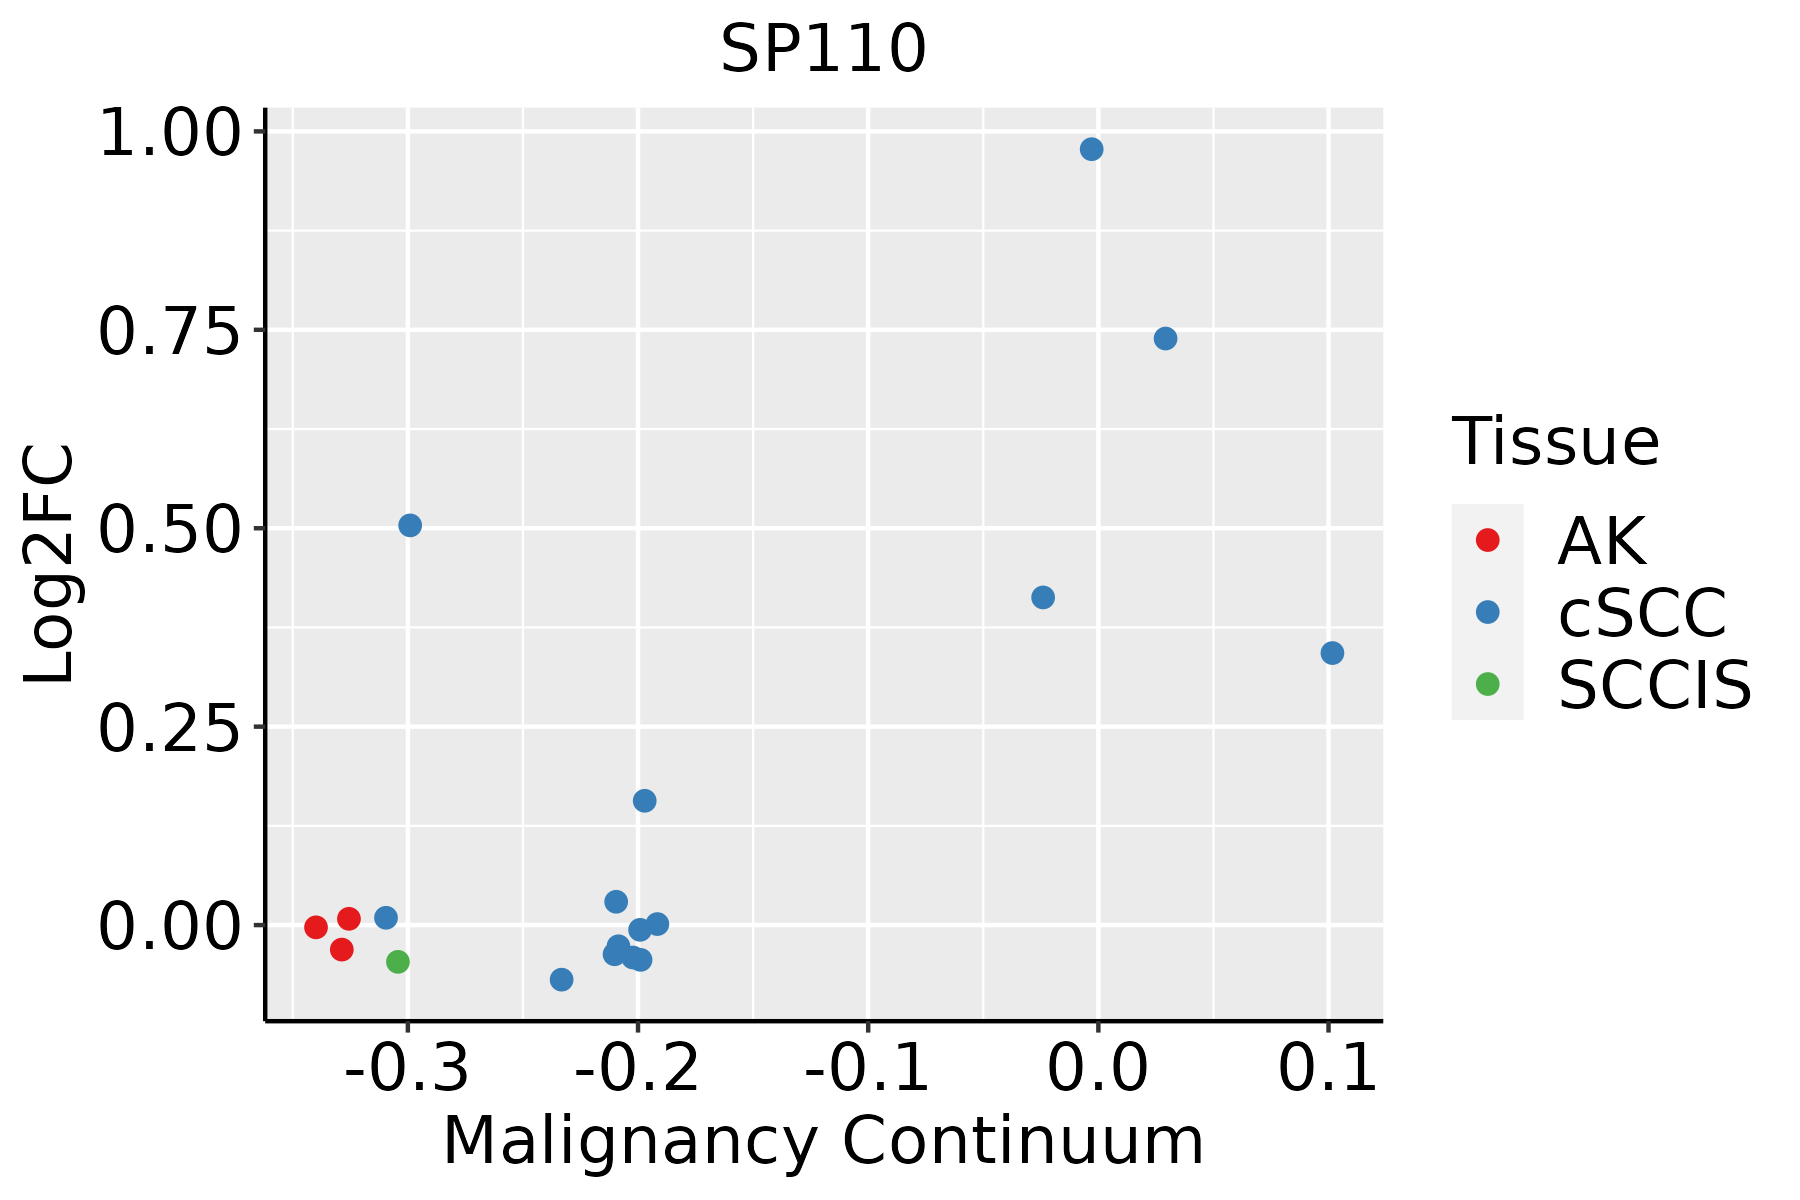 | AK: Actinic keratosis |
| cSCC: Cutaneous squamous cell carcinoma | ||
| SCCIS:squamous cell carcinoma in situ | ||
| Thyroid | 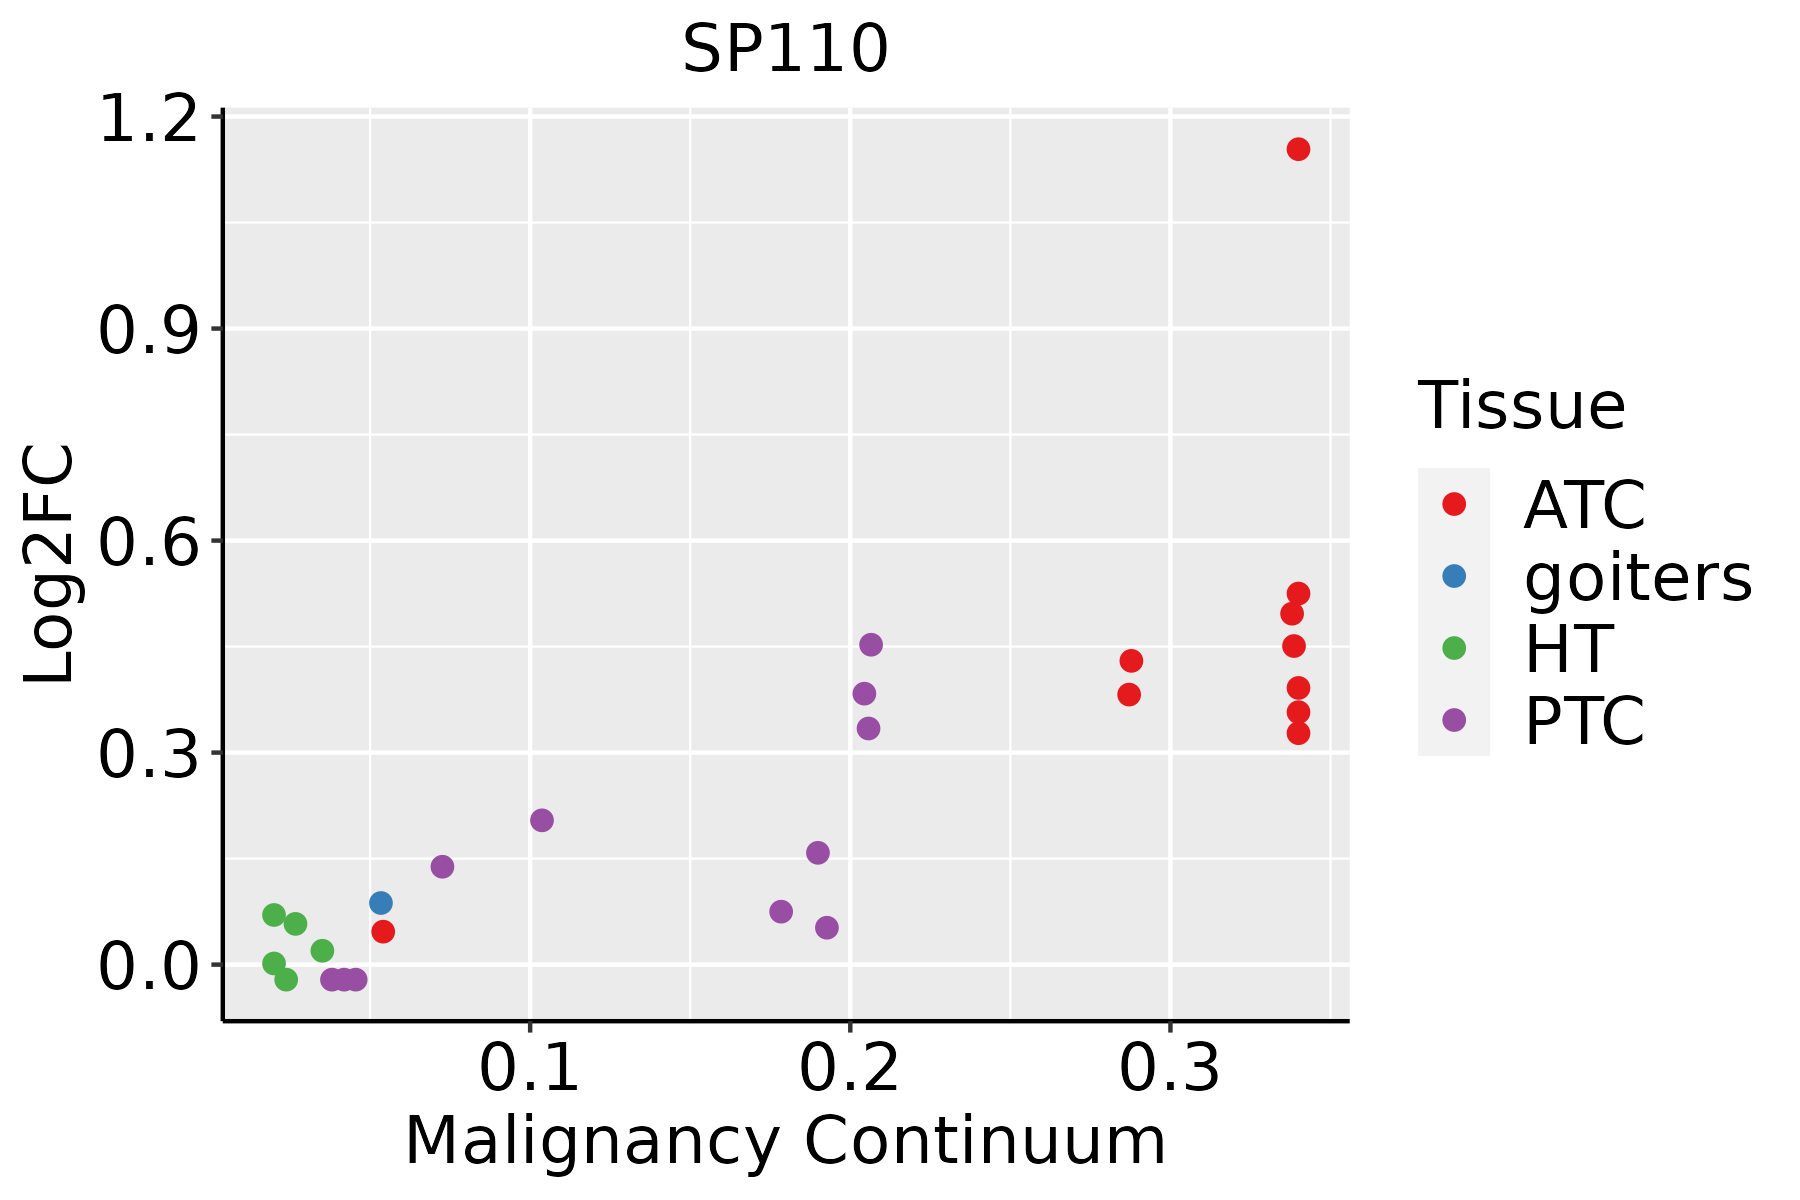 | ATC: Anaplastic thyroid cancer |
| HT: Hashimoto's thyroiditis | ||
| PTC: Papillary thyroid cancer |
| ∗log2FC in expression of this searched gene in stem-like cells from each diseased tissue sample relative to stem-like cells in normal samples in each tissue plotted against the malignancy continuum. Samples are colored based on if they are from different disease stage. |
Top |
Malignant transformation related pathway analysis |
| Find out the enriched GO biological processes and KEGG pathways involved in transition from healthy to precancer to cancer |
| Tissue | Disease Stage | Enriched GO biological Processes |
| Colorectum | AD |  |
| Colorectum | SER |  |
| Colorectum | MSS |  |
| Colorectum | MSI-H |  |
| Colorectum | FAP |  |
| ∗Top 15 enriched GO BP terms are showed in the bar plot of each disease state in each tissue. Each row represents a significant GO biological process which is colored according to the -log10(p.adjust). |
| Page: 1 2 3 4 5 6 7 8 9 |
| GO ID | Tissue | Disease Stage | Description | Gene Ratio | Bg Ratio | pvalue | p.adjust | Count |
| Page: 1 |
| Pathway ID | Tissue | Disease Stage | Description | Gene Ratio | Bg Ratio | pvalue | p.adjust | qvalue | Count |
| Page: 1 |
Top |
Cell-cell communication analysis |
| Identification of potential cell-cell interactions between two cell types and their ligand-receptor pairs for different disease states |
| Ligand | Receptor | LRpair | Pathway | Tissue | Disease Stage |
| Page: 1 |
Top |
Single-cell gene regulatory network inference analysis |
| Find out the significant the regulons (TFs) and the target genes of each regulon across cell types for different disease states |
| TF | Cell Type | Tissue | Disease Stage | Target Gene | RSS | Regulon Activity |
| ∗The dot plots of a searched regulon are shown for all cell subpopulations in each disease state of each tissue based on the regulon specific score inferred using pySCENIC and by calculating the average expression. |
| Page: 1 |
Top |
Somatic mutation of malignant transformation related genes |
| Annotation of somatic variants for genes involved in malignant transformation |
| Hugo Symbol | Variant Class | Variant Classification | dbSNP RS | HGVSc | HGVSp | HGVSp Short | SWISSPROT | BIOTYPE | SIFT | PolyPhen | Tumor Sample Barcode | Tissue | Histology | Sex | Age | Stage | Therapy Types | Drugs | Outcome |
| SP110 | SNV | Missense_Mutation | rs868540504 | c.2134N>T | p.Leu712Phe | p.L712F | Q9HB58 | protein_coding | tolerated_low_confidence(0.72) | benign(0.011) | TCGA-A2-A0YG-01 | Breast | breast invasive carcinoma | Female | <65 | III/IV | Chemotherapy | cytoxan | SD |
| SP110 | SNV | Missense_Mutation | c.406N>A | p.Pro136Thr | p.P136T | Q9HB58 | protein_coding | tolerated(0.18) | benign(0.059) | TCGA-A2-A0YG-01 | Breast | breast invasive carcinoma | Female | <65 | III/IV | Chemotherapy | cytoxan | SD | |
| SP110 | SNV | Missense_Mutation | c.958N>G | p.Gln320Glu | p.Q320E | Q9HB58 | protein_coding | tolerated(0.36) | benign(0.444) | TCGA-AC-A23H-01 | Breast | breast invasive carcinoma | Female | >=65 | I/II | Unknown | Unknown | PD | |
| SP110 | SNV | Missense_Mutation | rs200928586 | c.1579G>A | p.Glu527Lys | p.E527K | Q9HB58 | protein_coding | tolerated(1) | benign(0.013) | TCGA-AC-A2QI-01 | Breast | breast invasive carcinoma | Female | >=65 | III/IV | Chemotherapy | cytoxan | CR |
| SP110 | SNV | Missense_Mutation | c.470N>A | p.Ser157Asn | p.S157N | Q9HB58 | protein_coding | tolerated(0.18) | benign(0.011) | TCGA-E2-A1IN-01 | Breast | breast invasive carcinoma | Female | <65 | I/II | Hormone Therapy | arimidex | SD | |
| SP110 | deletion | Frame_Shift_Del | novel | c.896delN | p.Gly299GlufsTer33 | p.G299Efs*33 | Q9HB58 | protein_coding | TCGA-EW-A2FV-01 | Breast | breast invasive carcinoma | Female | <65 | III/IV | Chemotherapy | docetaxel | SD | ||
| SP110 | SNV | Missense_Mutation | c.1973C>T | p.Ala658Val | p.A658V | Q9HB58 | protein_coding | tolerated(0.09) | possibly_damaging(0.62) | TCGA-AA-3710-01 | Colorectum | colon adenocarcinoma | Female | >=65 | I/II | Unknown | Unknown | SD | |
| SP110 | SNV | Missense_Mutation | c.1013N>T | p.Ala338Val | p.A338V | Q9HB58 | protein_coding | tolerated(0.14) | possibly_damaging(0.878) | TCGA-D5-6930-01 | Colorectum | colon adenocarcinoma | Male | >=65 | I/II | Unknown | Unknown | SD | |
| SP110 | SNV | Missense_Mutation | c.850N>G | p.Ile284Val | p.I284V | Q9HB58 | protein_coding | tolerated(0.2) | benign(0.007) | TCGA-NH-A5IV-01 | Colorectum | colon adenocarcinoma | Female | >=65 | I/II | Unknown | Unknown | SD | |
| SP110 | SNV | Missense_Mutation | c.1208N>G | p.Thr403Ser | p.T403S | Q9HB58 | protein_coding | tolerated(0.14) | probably_damaging(0.986) | TCGA-RU-A8FL-01 | Colorectum | colon adenocarcinoma | Male | <65 | III/IV | Chemotherapy | folfox | PD |
| Page: 1 2 3 4 5 6 7 8 9 |
Top |
Related drugs of malignant transformation related genes |
| Identification of chemicals and drugs interact with genes involved in malignant transfromation |
| (DGIdb 4.0) |
| Entrez ID | Symbol | Category | Interaction Types | Drug Claim Name | Drug Name | PMIDs |
| Page: 1 |

Copyright 2023-Present -The University of Texas Health Science Center at Houston |