
|
|||||
|
 | |
| |
| |
| |
| |
| |
|
Gene: SMARCC2 |
Gene summary for SMARCC2 |
| Gene information | Species | Human | Gene symbol | SMARCC2 | Gene ID | 6601 |
| Gene name | SWI/SNF related, matrix associated, actin dependent regulator of chromatin subfamily c member 2 | |
| Gene Alias | BAF170 | |
| Cytomap | 12q13.2 | |
| Gene Type | protein-coding | GO ID | GO:0006139 | UniProtAcc | Q8TAQ2 |
Top |
Malignant transformation analysis |
| Identification of the aberrant gene expression in precancerous and cancerous lesions by comparing the gene expression of stem-like cells in diseased tissues with normal stem cells |
| Entrez ID | Symbol | Replicates | Species | Organ | Tissue | Adj P-value | Log2FC | Malignancy |
| 6601 | SMARCC2 | P91T-E | Human | Esophagus | ESCC | 7.13e-11 | 1.04e+00 | 0.1828 |
| 6601 | SMARCC2 | P104T-E | Human | Esophagus | ESCC | 2.58e-09 | 6.32e-01 | 0.0931 |
| 6601 | SMARCC2 | P107T-E | Human | Esophagus | ESCC | 8.86e-36 | 7.87e-01 | 0.171 |
| 6601 | SMARCC2 | P126T-E | Human | Esophagus | ESCC | 2.23e-08 | 5.23e-01 | 0.1125 |
| 6601 | SMARCC2 | P127T-E | Human | Esophagus | ESCC | 1.86e-26 | 3.66e-01 | 0.0826 |
| 6601 | SMARCC2 | P128T-E | Human | Esophagus | ESCC | 6.22e-36 | 1.15e+00 | 0.1241 |
| 6601 | SMARCC2 | P130T-E | Human | Esophagus | ESCC | 3.51e-54 | 1.13e+00 | 0.1676 |
| 6601 | SMARCC2 | S43 | Human | Liver | Cirrhotic | 1.65e-02 | -1.34e-01 | -0.0187 |
| 6601 | SMARCC2 | HCC1_Meng | Human | Liver | HCC | 2.62e-36 | -5.89e-02 | 0.0246 |
| 6601 | SMARCC2 | HCC2_Meng | Human | Liver | HCC | 2.08e-17 | 7.99e-02 | 0.0107 |
| 6601 | SMARCC2 | cirrhotic2 | Human | Liver | Cirrhotic | 2.04e-02 | 1.54e-01 | 0.0201 |
| 6601 | SMARCC2 | HCC1 | Human | Liver | HCC | 8.54e-11 | 4.42e+00 | 0.5336 |
| 6601 | SMARCC2 | HCC2 | Human | Liver | HCC | 9.48e-31 | 5.38e+00 | 0.5341 |
| 6601 | SMARCC2 | Pt13.b | Human | Liver | HCC | 1.35e-02 | -2.02e-02 | 0.0251 |
| 6601 | SMARCC2 | Pt13.c | Human | Liver | HCC | 3.88e-03 | -1.86e-01 | 0.0076 |
| 6601 | SMARCC2 | S014 | Human | Liver | HCC | 3.59e-05 | 5.66e-01 | 0.2254 |
| 6601 | SMARCC2 | S016 | Human | Liver | HCC | 3.02e-06 | 5.72e-01 | 0.2243 |
| 6601 | SMARCC2 | S027 | Human | Liver | HCC | 5.96e-04 | 8.01e-01 | 0.2446 |
| 6601 | SMARCC2 | S028 | Human | Liver | HCC | 1.12e-15 | 9.16e-01 | 0.2503 |
| 6601 | SMARCC2 | S029 | Human | Liver | HCC | 3.34e-07 | 6.88e-01 | 0.2581 |
| Page: 1 2 3 4 5 6 7 |
| Tissue | Expression Dynamics | Abbreviation |
| Esophagus |  | ESCC: Esophageal squamous cell carcinoma |
| HGIN: High-grade intraepithelial neoplasias | ||
| LGIN: Low-grade intraepithelial neoplasias | ||
| Liver | 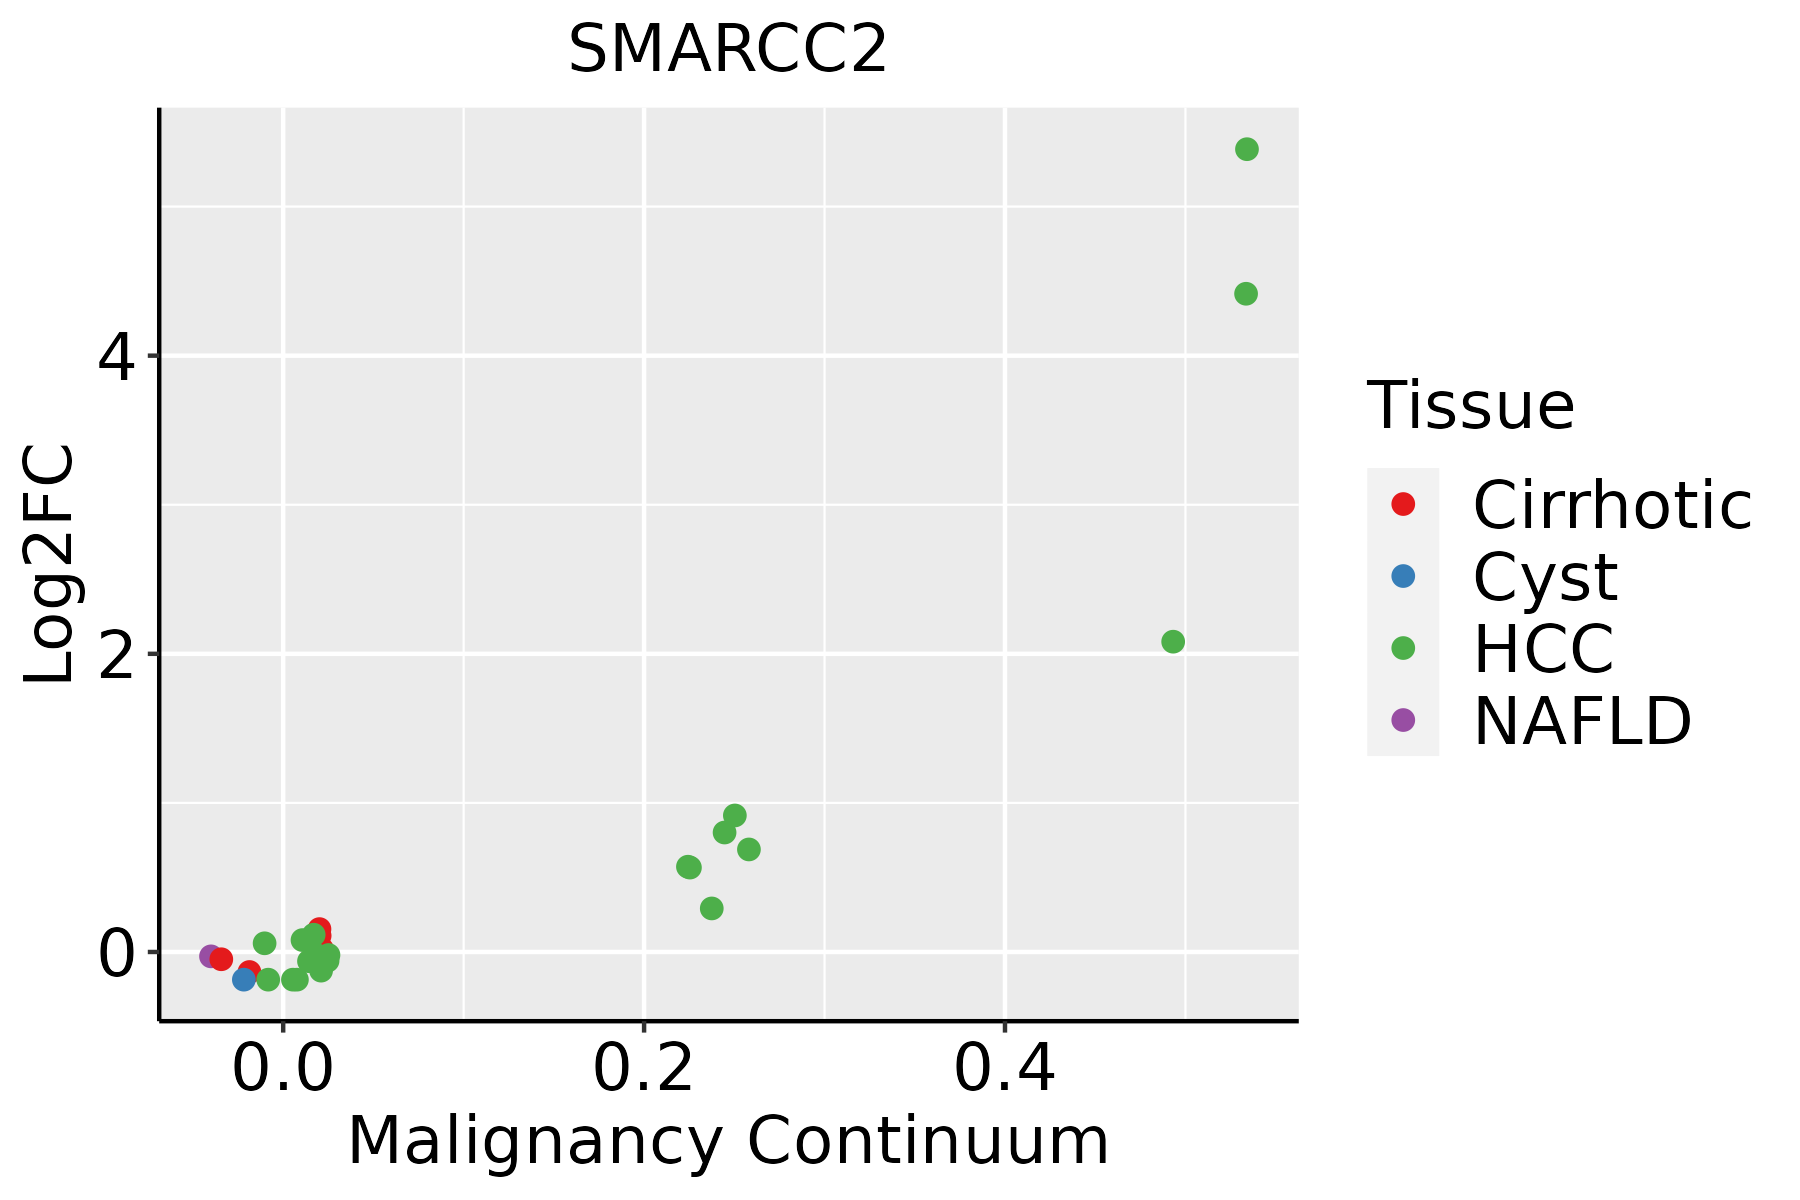 | HCC: Hepatocellular carcinoma |
| NAFLD: Non-alcoholic fatty liver disease | ||
| Oral Cavity | 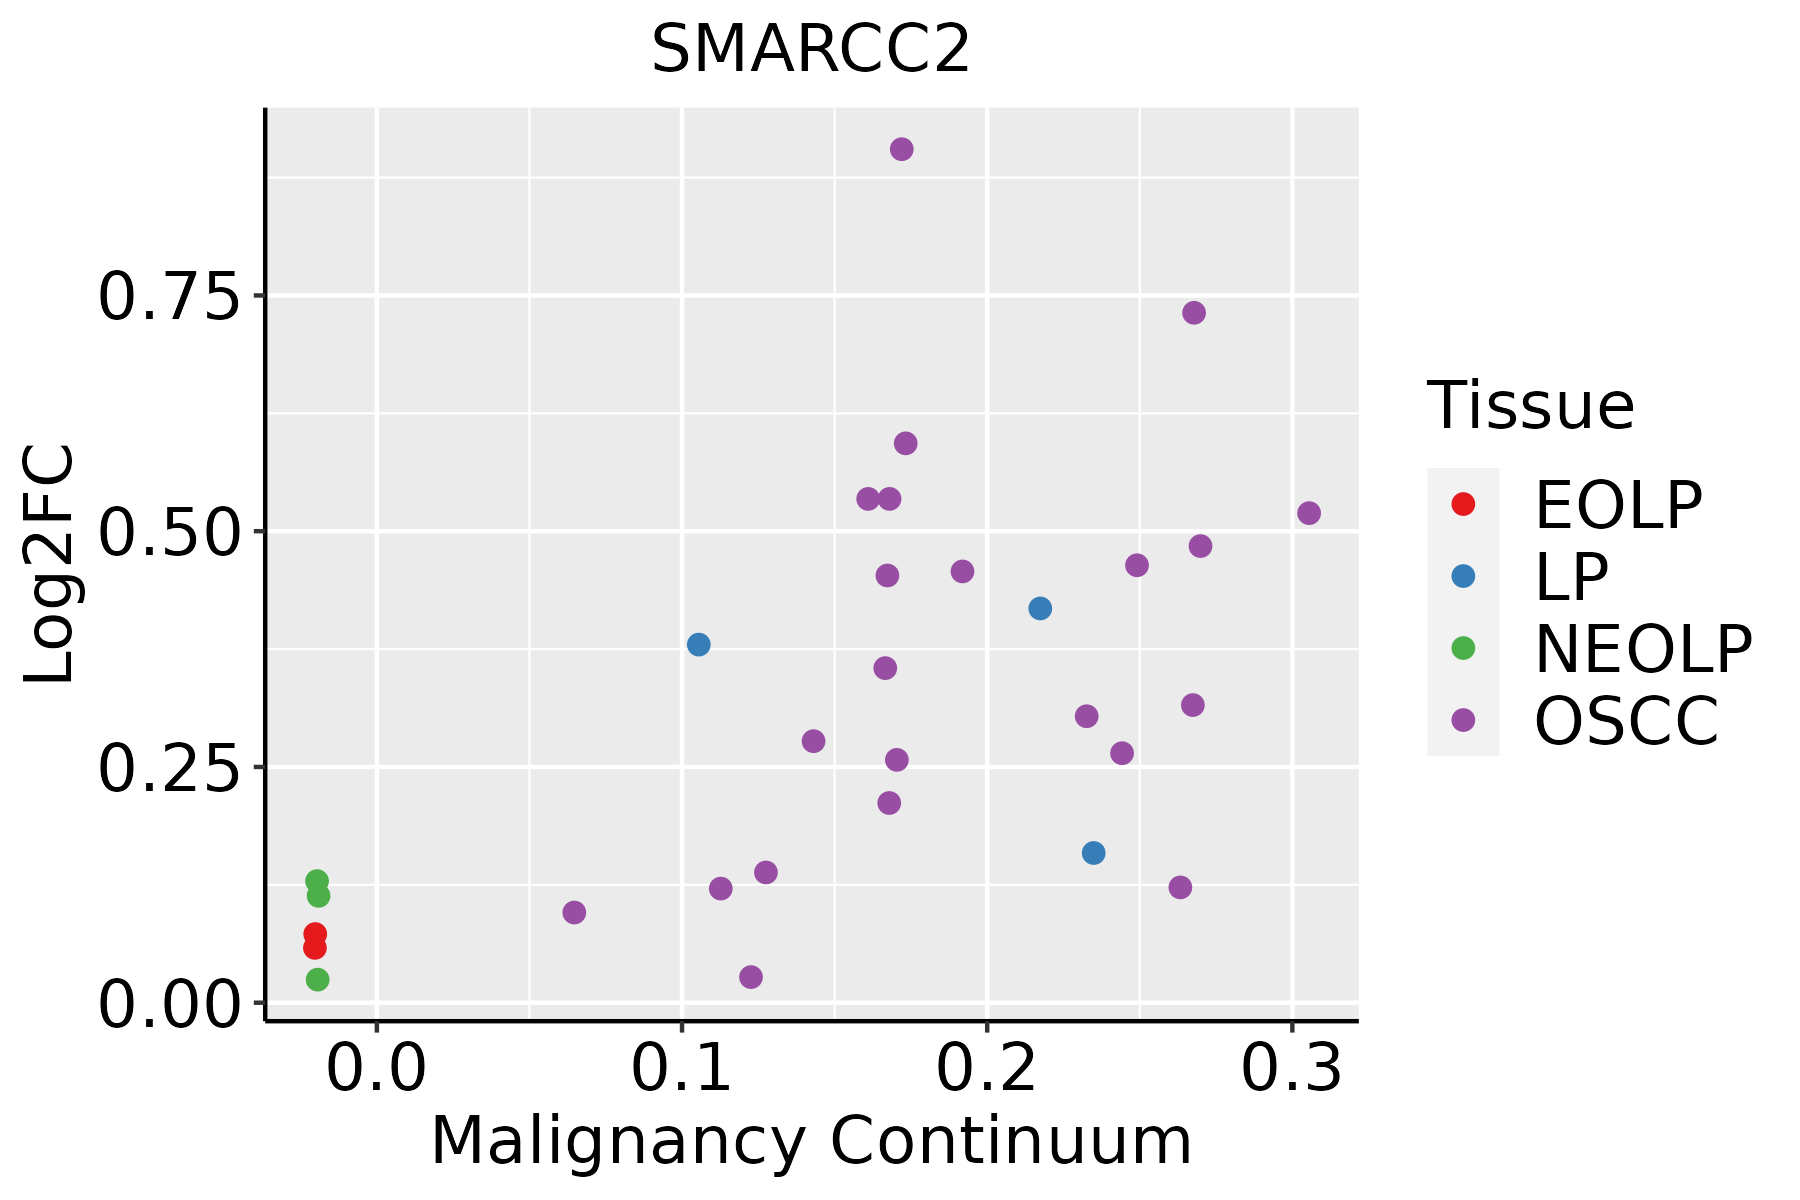 | EOLP: Erosive Oral lichen planus |
| LP: leukoplakia | ||
| NEOLP: Non-erosive oral lichen planus | ||
| OSCC: Oral squamous cell carcinoma | ||
| Prostate | 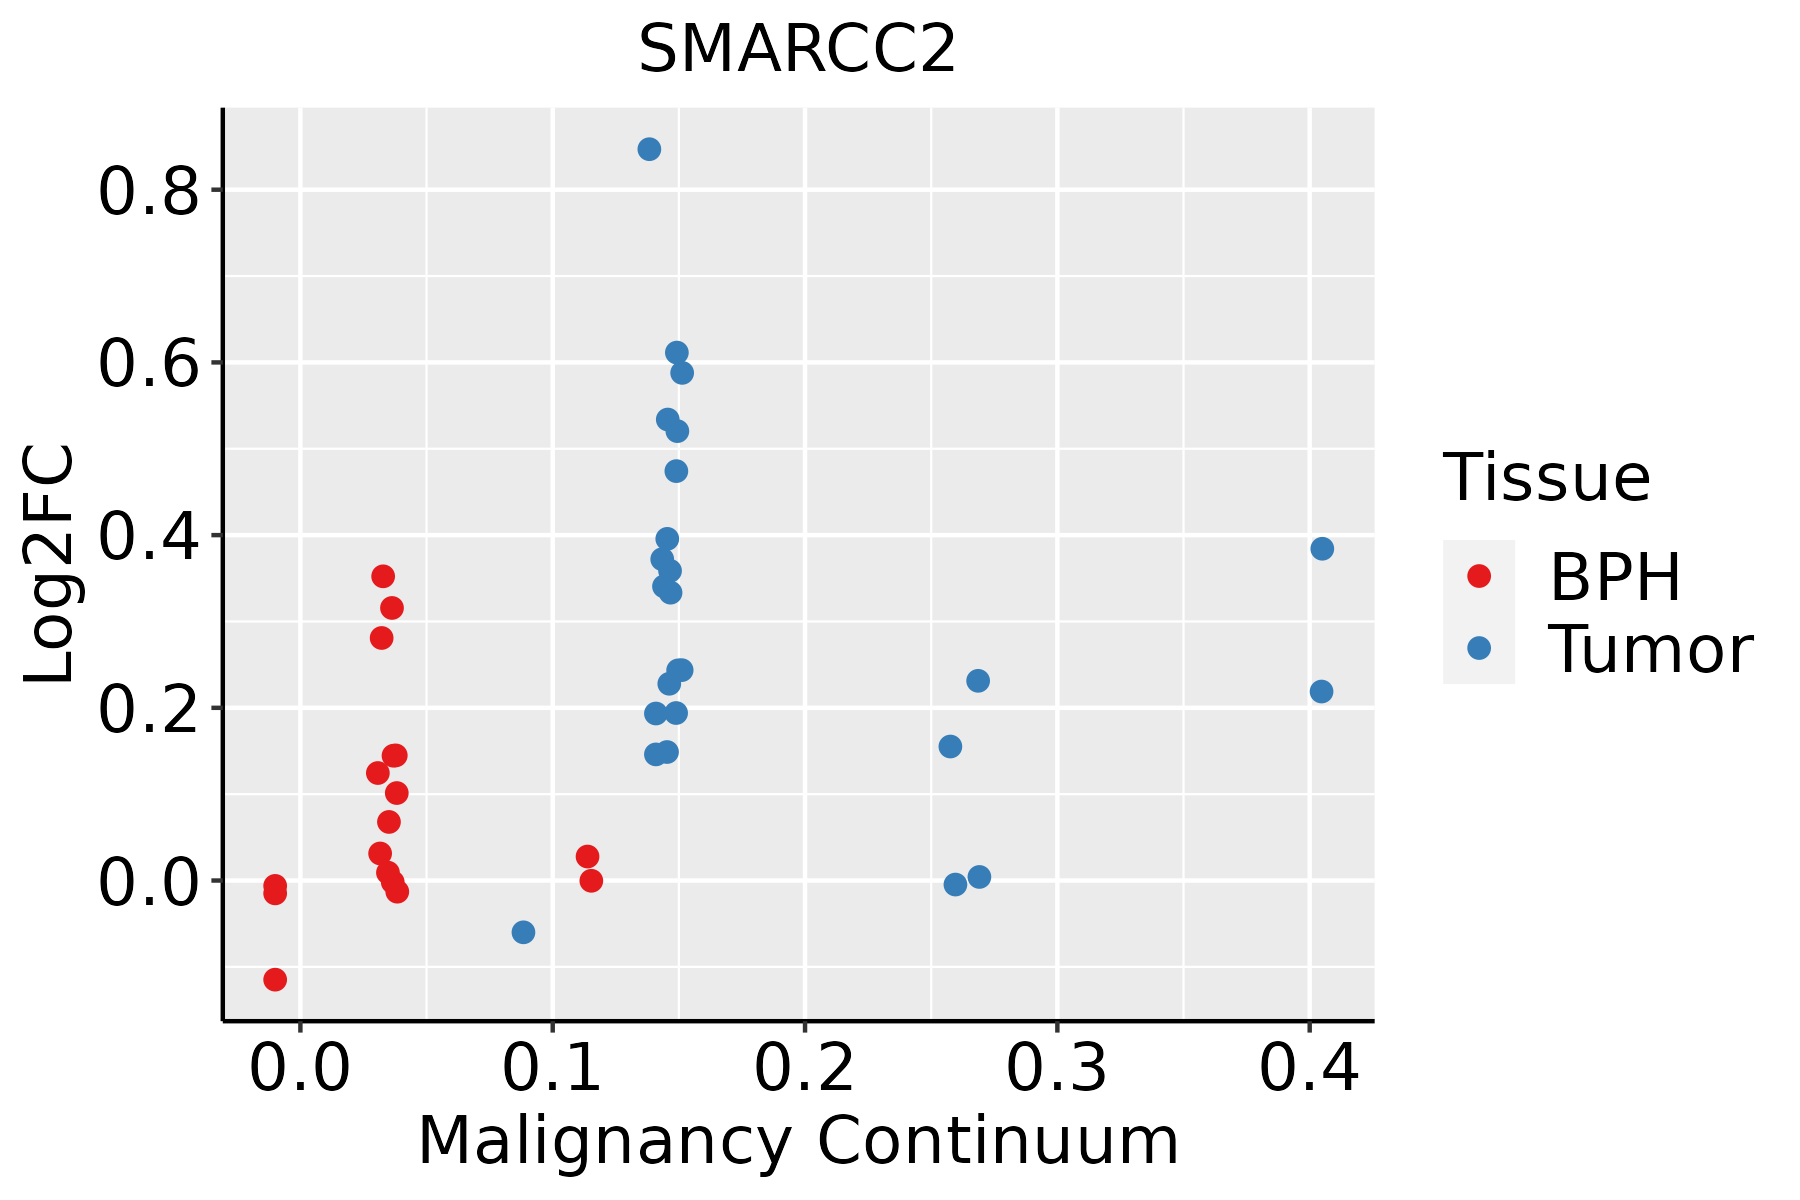 | BPH: Benign Prostatic Hyperplasia |
| Skin | 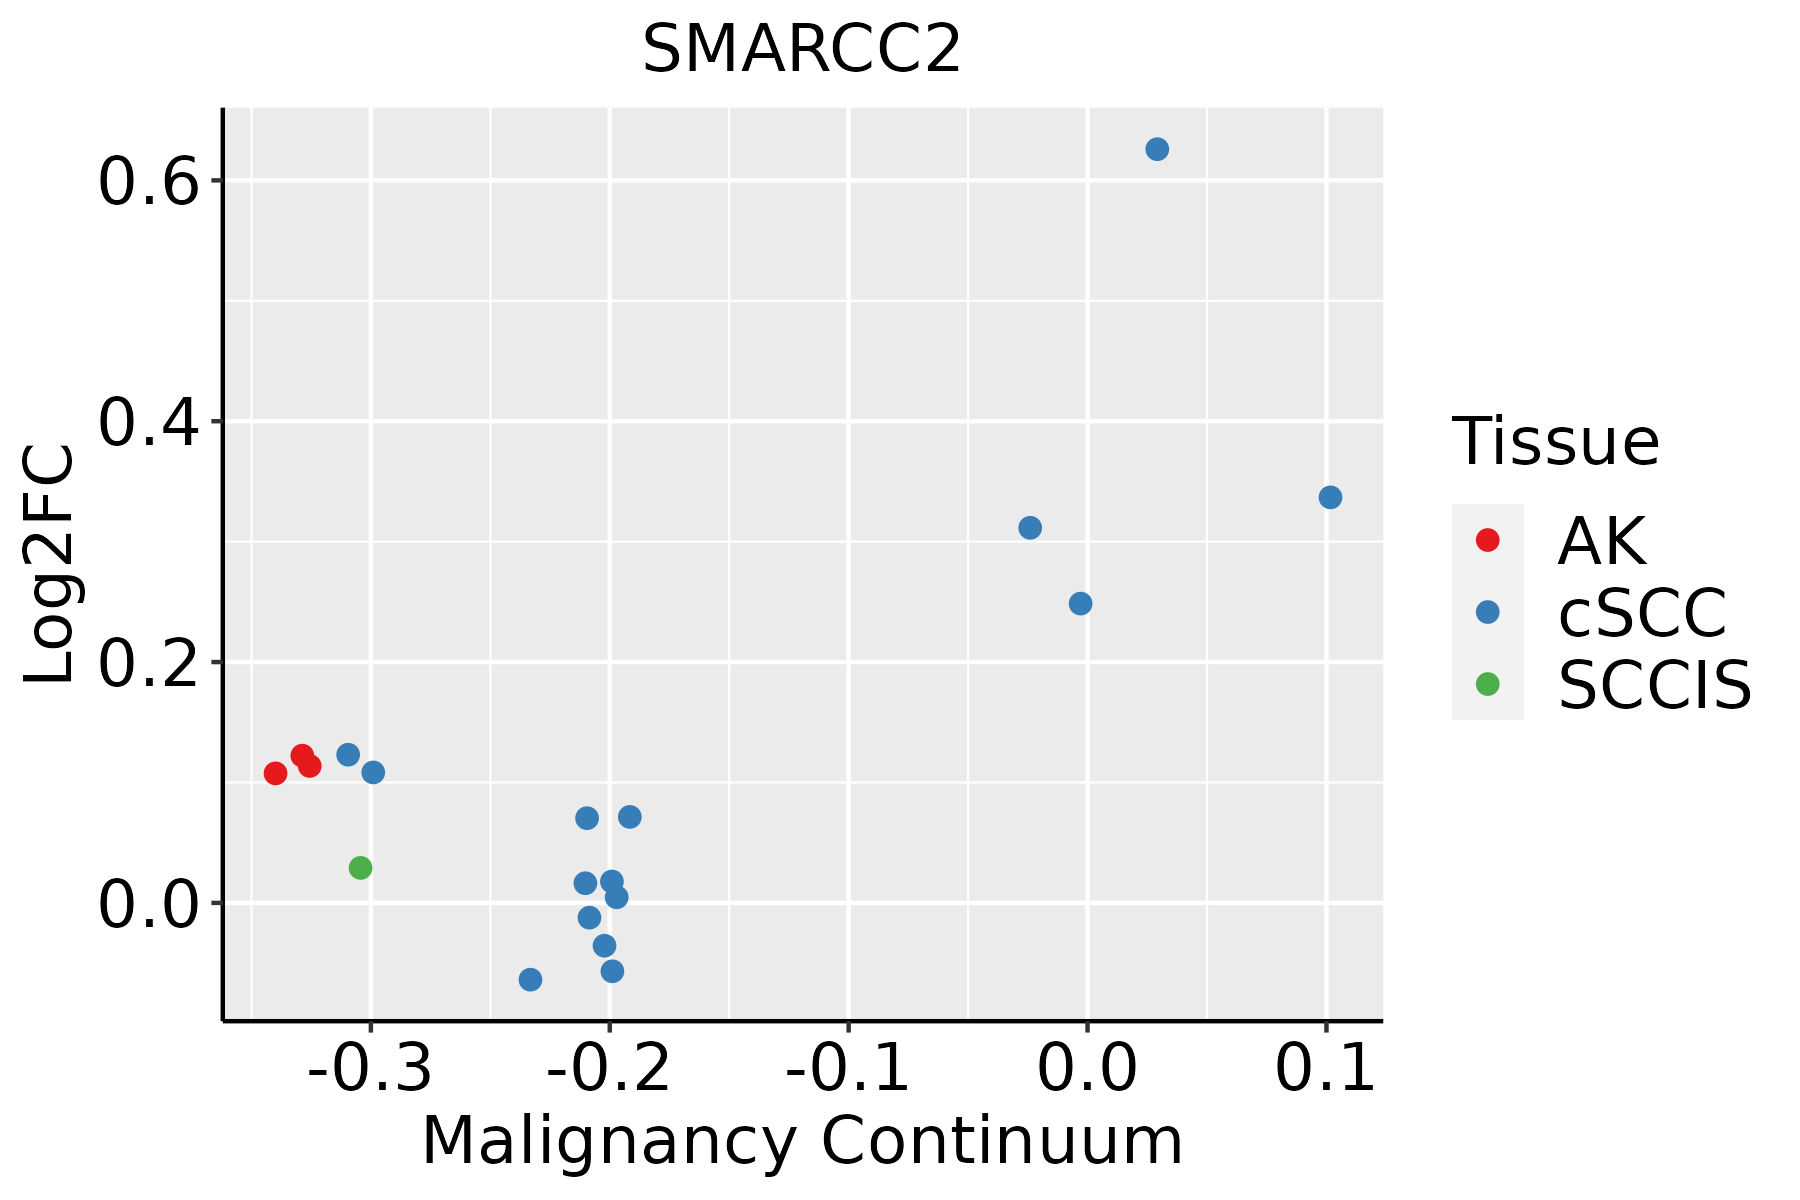 | AK: Actinic keratosis |
| cSCC: Cutaneous squamous cell carcinoma | ||
| SCCIS:squamous cell carcinoma in situ | ||
| Thyroid | 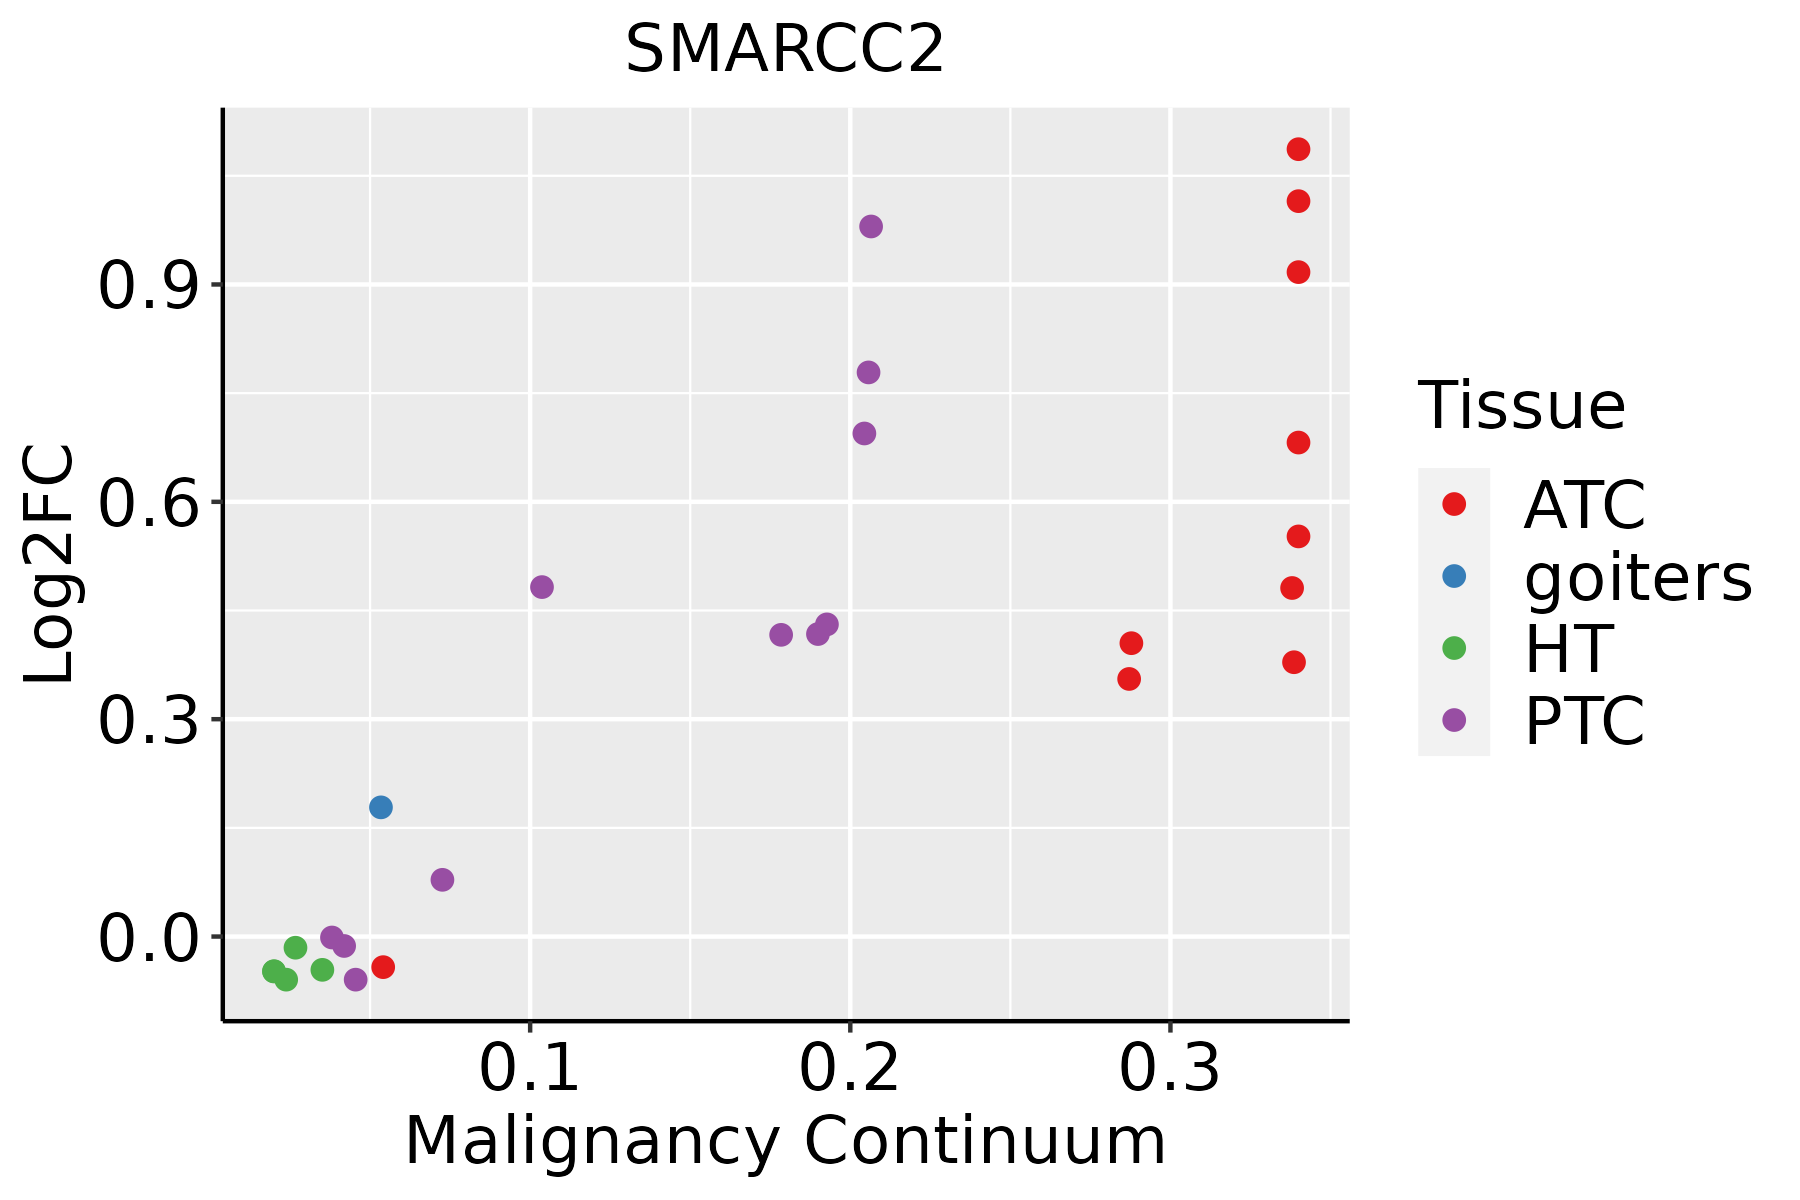 | ATC: Anaplastic thyroid cancer |
| HT: Hashimoto's thyroiditis | ||
| PTC: Papillary thyroid cancer |
| ∗log2FC in expression of this searched gene in stem-like cells from each diseased tissue sample relative to stem-like cells in normal samples in each tissue plotted against the malignancy continuum. Samples are colored based on if they are from different disease stage. |
Top |
Malignant transformation related pathway analysis |
| Find out the enriched GO biological processes and KEGG pathways involved in transition from healthy to precancer to cancer |
| Tissue | Disease Stage | Enriched GO biological Processes |
| Colorectum | AD |  |
| Colorectum | SER |  |
| Colorectum | MSS |  |
| Colorectum | MSI-H |  |
| Colorectum | FAP |  |
| ∗Top 15 enriched GO BP terms are showed in the bar plot of each disease state in each tissue. Each row represents a significant GO biological process which is colored according to the -log10(p.adjust). |
| Page: 1 2 3 4 5 6 7 8 9 |
| GO ID | Tissue | Disease Stage | Description | Gene Ratio | Bg Ratio | pvalue | p.adjust | Count |
| GO:0022411111 | Esophagus | ESCC | cellular component disassembly | 305/8552 | 443/18723 | 1.94e-23 | 4.57e-21 | 305 |
| GO:003298416 | Esophagus | ESCC | protein-containing complex disassembly | 151/8552 | 224/18723 | 3.45e-11 | 1.15e-09 | 151 |
| GO:000632517 | Esophagus | ESCC | chromatin organization | 240/8552 | 409/18723 | 6.52e-08 | 1.14e-06 | 240 |
| GO:003149811 | Esophagus | ESCC | chromatin disassembly | 16/8552 | 20/18723 | 1.85e-03 | 8.40e-03 | 16 |
| GO:003298616 | Esophagus | ESCC | protein-DNA complex disassembly | 16/8552 | 20/18723 | 1.85e-03 | 8.40e-03 | 16 |
| GO:000633713 | Esophagus | ESCC | nucleosome disassembly | 14/8552 | 18/18723 | 5.77e-03 | 2.14e-02 | 14 |
| GO:00224117 | Liver | Cirrhotic | cellular component disassembly | 182/4634 | 443/18723 | 1.59e-14 | 1.54e-12 | 182 |
| GO:00329846 | Liver | Cirrhotic | protein-containing complex disassembly | 82/4634 | 224/18723 | 4.78e-05 | 5.54e-04 | 82 |
| GO:00329864 | Liver | Cirrhotic | protein-DNA complex disassembly | 12/4634 | 20/18723 | 8.43e-04 | 6.12e-03 | 12 |
| GO:00063372 | Liver | Cirrhotic | nucleosome disassembly | 10/4634 | 18/18723 | 5.00e-03 | 2.59e-02 | 10 |
| GO:002241112 | Liver | HCC | cellular component disassembly | 282/7958 | 443/18723 | 1.02e-19 | 1.38e-17 | 282 |
| GO:003298411 | Liver | HCC | protein-containing complex disassembly | 138/7958 | 224/18723 | 5.59e-09 | 1.46e-07 | 138 |
| GO:000632511 | Liver | HCC | chromatin organization | 206/7958 | 409/18723 | 7.23e-04 | 4.41e-03 | 206 |
| GO:003298611 | Liver | HCC | protein-DNA complex disassembly | 15/7958 | 20/18723 | 3.31e-03 | 1.51e-02 | 15 |
| GO:000633711 | Liver | HCC | nucleosome disassembly | 13/7958 | 18/18723 | 1.05e-02 | 3.89e-02 | 13 |
| GO:00314983 | Liver | HCC | chromatin disassembly | 14/7958 | 20/18723 | 1.21e-02 | 4.41e-02 | 14 |
| GO:002241119 | Oral cavity | OSCC | cellular component disassembly | 283/7305 | 443/18723 | 9.57e-27 | 3.37e-24 | 283 |
| GO:003298410 | Oral cavity | OSCC | protein-containing complex disassembly | 136/7305 | 224/18723 | 3.42e-11 | 1.13e-09 | 136 |
| GO:000632510 | Oral cavity | OSCC | chromatin organization | 190/7305 | 409/18723 | 1.17e-03 | 5.97e-03 | 190 |
| GO:00329868 | Oral cavity | OSCC | protein-DNA complex disassembly | 15/7305 | 20/18723 | 1.19e-03 | 5.99e-03 | 15 |
| Page: 1 2 3 |
| Pathway ID | Tissue | Disease Stage | Description | Gene Ratio | Bg Ratio | pvalue | p.adjust | qvalue | Count |
| hsa04714211 | Esophagus | ESCC | Thermogenesis | 163/4205 | 232/8465 | 9.22e-11 | 1.14e-09 | 5.86e-10 | 163 |
| hsa0522518 | Esophagus | ESCC | Hepatocellular carcinoma | 109/4205 | 168/8465 | 4.27e-05 | 1.88e-04 | 9.64e-05 | 109 |
| hsa04714310 | Esophagus | ESCC | Thermogenesis | 163/4205 | 232/8465 | 9.22e-11 | 1.14e-09 | 5.86e-10 | 163 |
| hsa0522519 | Esophagus | ESCC | Hepatocellular carcinoma | 109/4205 | 168/8465 | 4.27e-05 | 1.88e-04 | 9.64e-05 | 109 |
| hsa0471414 | Liver | Cirrhotic | Thermogenesis | 121/2530 | 232/8465 | 5.70e-13 | 1.36e-11 | 8.36e-12 | 121 |
| hsa0471415 | Liver | Cirrhotic | Thermogenesis | 121/2530 | 232/8465 | 5.70e-13 | 1.36e-11 | 8.36e-12 | 121 |
| hsa0471422 | Liver | HCC | Thermogenesis | 170/4020 | 232/8465 | 5.36e-16 | 2.25e-14 | 1.25e-14 | 170 |
| hsa052258 | Liver | HCC | Hepatocellular carcinoma | 106/4020 | 168/8465 | 2.87e-05 | 1.85e-04 | 1.03e-04 | 106 |
| hsa0471432 | Liver | HCC | Thermogenesis | 170/4020 | 232/8465 | 5.36e-16 | 2.25e-14 | 1.25e-14 | 170 |
| hsa0522511 | Liver | HCC | Hepatocellular carcinoma | 106/4020 | 168/8465 | 2.87e-05 | 1.85e-04 | 1.03e-04 | 106 |
| hsa0471430 | Oral cavity | OSCC | Thermogenesis | 138/3704 | 232/8465 | 7.67e-07 | 4.35e-06 | 2.22e-06 | 138 |
| hsa0522516 | Oral cavity | OSCC | Hepatocellular carcinoma | 97/3704 | 168/8465 | 1.63e-04 | 5.52e-04 | 2.81e-04 | 97 |
| hsa04714113 | Oral cavity | OSCC | Thermogenesis | 138/3704 | 232/8465 | 7.67e-07 | 4.35e-06 | 2.22e-06 | 138 |
| hsa0522517 | Oral cavity | OSCC | Hepatocellular carcinoma | 97/3704 | 168/8465 | 1.63e-04 | 5.52e-04 | 2.81e-04 | 97 |
| hsa0471428 | Prostate | BPH | Thermogenesis | 110/1718 | 232/8465 | 5.16e-21 | 1.42e-19 | 8.78e-20 | 110 |
| hsa0522514 | Prostate | BPH | Hepatocellular carcinoma | 51/1718 | 168/8465 | 1.17e-03 | 5.22e-03 | 3.23e-03 | 51 |
| hsa04714112 | Prostate | BPH | Thermogenesis | 110/1718 | 232/8465 | 5.16e-21 | 1.42e-19 | 8.78e-20 | 110 |
| hsa0522515 | Prostate | BPH | Hepatocellular carcinoma | 51/1718 | 168/8465 | 1.17e-03 | 5.22e-03 | 3.23e-03 | 51 |
| hsa0471429 | Prostate | Tumor | Thermogenesis | 110/1791 | 232/8465 | 1.56e-19 | 3.96e-18 | 2.46e-18 | 110 |
| hsa0522522 | Prostate | Tumor | Hepatocellular carcinoma | 53/1791 | 168/8465 | 9.65e-04 | 4.44e-03 | 2.75e-03 | 53 |
| Page: 1 2 |
Top |
Cell-cell communication analysis |
| Identification of potential cell-cell interactions between two cell types and their ligand-receptor pairs for different disease states |
| Ligand | Receptor | LRpair | Pathway | Tissue | Disease Stage |
| Page: 1 |
Top |
Single-cell gene regulatory network inference analysis |
| Find out the significant the regulons (TFs) and the target genes of each regulon across cell types for different disease states |
| TF | Cell Type | Tissue | Disease Stage | Target Gene | RSS | Regulon Activity |
| SMARCC2 | M1MAC | Lung | ADJ | SNED1,PNLDC1,EIF2AK3, etc. | 3.99e-04 |  |
| SMARCC2 | TFH | Lung | ADJ | SNED1,PNLDC1,EIF2AK3, etc. | -4.44e-16 | |
| SMARCC2 | MALTB | Lung | ADJ | SNED1,PNLDC1,EIF2AK3, etc. | 0.00e+00 | |
| SMARCC2 | BMEM | Lung | ADJ | SNED1,PNLDC1,EIF2AK3, etc. | 3.68e-04 | |
| SMARCC2 | GC | Lung | ADJ | SNED1,PNLDC1,EIF2AK3, etc. | 2.77e-04 | |
| SMARCC2 | MDSC | Lung | ADJ | SNED1,PNLDC1,EIF2AK3, etc. | 0.00e+00 | |
| SMARCC2 | PLA | Thyroid | Healthy | AC245140.2,RGMB,TCEANC, etc. | 6.47e-01 |  |
| ∗The dot plots of a searched regulon are shown for all cell subpopulations in each disease state of each tissue based on the regulon specific score inferred using pySCENIC and by calculating the average expression. |
| Page: 1 |
Top |
Somatic mutation of malignant transformation related genes |
| Annotation of somatic variants for genes involved in malignant transformation |
| Hugo Symbol | Variant Class | Variant Classification | dbSNP RS | HGVSc | HGVSp | HGVSp Short | SWISSPROT | BIOTYPE | SIFT | PolyPhen | Tumor Sample Barcode | Tissue | Histology | Sex | Age | Stage | Therapy Types | Drugs | Outcome |
| SMARCC2 | SNV | Missense_Mutation | novel | c.1873N>C | p.Ala625Pro | p.A625P | protein_coding | deleterious(0.02) | possibly_damaging(0.729) | TCGA-A8-A096-01 | Breast | breast invasive carcinoma | Female | >=65 | I/II | Unknown | Unknown | SD | |
| SMARCC2 | SNV | Missense_Mutation | rs200224449 | c.902N>A | p.Arg301His | p.R301H | protein_coding | tolerated(0.17) | probably_damaging(0.927) | TCGA-A8-A0A7-01 | Breast | breast invasive carcinoma | Female | <65 | I/II | Unknown | Unknown | SD | |
| SMARCC2 | SNV | Missense_Mutation | rs761098190 | c.3494N>C | p.Asn1165Thr | p.N1165T | protein_coding | deleterious_low_confidence(0.05) | benign(0.015) | TCGA-AQ-A1H3-01 | Breast | breast invasive carcinoma | Female | <65 | III/IV | Chemotherapy | adriamycin | SD | |
| SMARCC2 | SNV | Missense_Mutation | rs761098190 | c.3494N>C | p.Asn1165Thr | p.N1165T | protein_coding | deleterious_low_confidence(0.05) | benign(0.015) | TCGA-AR-A1AP-01 | Breast | breast invasive carcinoma | Female | >=65 | I/II | Hormone Therapy | anastrozole | SD | |
| SMARCC2 | SNV | Missense_Mutation | c.1624N>C | p.Val542Leu | p.V542L | protein_coding | tolerated(0.22) | probably_damaging(0.971) | TCGA-C8-A12K-01 | Breast | breast invasive carcinoma | Female | >=65 | I/II | Unknown | Unknown | SD | ||
| SMARCC2 | SNV | Missense_Mutation | c.3392G>A | p.Gly1131Asp | p.G1131D | protein_coding | deleterious_low_confidence(0.01) | benign(0.219) | TCGA-C8-A12U-01 | Breast | breast invasive carcinoma | Female | <65 | I/II | Unknown | Unknown | SD | ||
| SMARCC2 | SNV | Missense_Mutation | c.2845N>A | p.Glu949Lys | p.E949K | protein_coding | deleterious(0) | probably_damaging(0.956) | TCGA-C8-A1HM-01 | Breast | breast invasive carcinoma | Female | >=65 | I/II | Chemotherapy | doxorubicin | CR | ||
| SMARCC2 | SNV | Missense_Mutation | c.2426G>T | p.Gly809Val | p.G809V | protein_coding | tolerated(0.06) | possibly_damaging(0.696) | TCGA-C8-A26Y-01 | Breast | breast invasive carcinoma | Female | >=65 | I/II | Unknown | Unknown | SD | ||
| SMARCC2 | SNV | Missense_Mutation | c.1606G>A | p.Asp536Asn | p.D536N | protein_coding | deleterious(0) | probably_damaging(0.99) | TCGA-C8-A26Y-01 | Breast | breast invasive carcinoma | Female | >=65 | I/II | Unknown | Unknown | SD | ||
| SMARCC2 | SNV | Missense_Mutation | c.253N>G | p.Lys85Glu | p.K85E | protein_coding | deleterious(0.03) | probably_damaging(0.987) | TCGA-E9-A1NA-01 | Breast | breast invasive carcinoma | Female | <65 | I/II | Chemotherapy | cyclophosphamide | SD |
| Page: 1 2 3 4 5 6 7 8 9 10 11 12 |
Top |
Related drugs of malignant transformation related genes |
| Identification of chemicals and drugs interact with genes involved in malignant transfromation |
| (DGIdb 4.0) |
| Entrez ID | Symbol | Category | Interaction Types | Drug Claim Name | Drug Name | PMIDs |
| Page: 1 |

Copyright 2023-Present -The University of Texas Health Science Center at Houston |