
|
|||||
|
 | |
| |
| |
| |
| |
| |
|
Gene: SLFN5 |
Gene summary for SLFN5 |
| Gene information | Species | Human | Gene symbol | SLFN5 | Gene ID | 162394 |
| Gene name | schlafen family member 5 | |
| Gene Alias | SLFN5 | |
| Cytomap | 17q12 | |
| Gene Type | protein-coding | GO ID | GO:0008150 | UniProtAcc | B4E128 |
Top |
Malignant transformation analysis |
| Identification of the aberrant gene expression in precancerous and cancerous lesions by comparing the gene expression of stem-like cells in diseased tissues with normal stem cells |
| Entrez ID | Symbol | Replicates | Species | Organ | Tissue | Adj P-value | Log2FC | Malignancy |
| 162394 | SLFN5 | P107T-E | Human | Esophagus | ESCC | 4.06e-25 | 6.75e-01 | 0.171 |
| 162394 | SLFN5 | P126T-E | Human | Esophagus | ESCC | 2.45e-09 | 1.01e+00 | 0.1125 |
| 162394 | SLFN5 | P127T-E | Human | Esophagus | ESCC | 2.79e-15 | 3.93e-01 | 0.0826 |
| 162394 | SLFN5 | P128T-E | Human | Esophagus | ESCC | 1.19e-27 | 8.95e-01 | 0.1241 |
| 162394 | SLFN5 | P130T-E | Human | Esophagus | ESCC | 1.80e-07 | 2.19e-01 | 0.1676 |
| 162394 | SLFN5 | HCC2_Meng | Human | Liver | HCC | 9.26e-18 | 1.54e-01 | 0.0107 |
| 162394 | SLFN5 | HCC1 | Human | Liver | HCC | 3.20e-02 | 2.69e+00 | 0.5336 |
| 162394 | SLFN5 | HCC2 | Human | Liver | HCC | 6.37e-04 | 7.76e-01 | 0.5341 |
| 162394 | SLFN5 | HCC5 | Human | Liver | HCC | 2.02e-04 | 6.90e-01 | 0.4932 |
| 162394 | SLFN5 | Pt13.b | Human | Liver | HCC | 4.65e-10 | 1.92e-01 | 0.0251 |
| 162394 | SLFN5 | S027 | Human | Liver | HCC | 6.32e-09 | 7.43e-01 | 0.2446 |
| 162394 | SLFN5 | S028 | Human | Liver | HCC | 6.02e-09 | 5.56e-01 | 0.2503 |
| 162394 | SLFN5 | S029 | Human | Liver | HCC | 2.30e-11 | 5.54e-01 | 0.2581 |
| 162394 | SLFN5 | RNA-P17T-P17T-2 | Human | Lung | IAC | 1.09e-06 | 6.68e-01 | 0.3371 |
| 162394 | SLFN5 | RNA-P17T-P17T-4 | Human | Lung | IAC | 1.63e-05 | 6.40e-01 | 0.343 |
| 162394 | SLFN5 | RNA-P17T-P17T-6 | Human | Lung | IAC | 1.55e-02 | 4.89e-01 | 0.3385 |
| 162394 | SLFN5 | RNA-P17T-P17T-8 | Human | Lung | IAC | 1.17e-05 | 4.55e-01 | 0.3329 |
| 162394 | SLFN5 | RNA-P6T2-P6T2-2 | Human | Lung | IAC | 5.40e-04 | 1.41e-01 | -0.0132 |
| 162394 | SLFN5 | RNA-P6T2-P6T2-3 | Human | Lung | IAC | 1.49e-02 | 7.97e-02 | -0.013 |
| 162394 | SLFN5 | C04 | Human | Oral cavity | OSCC | 2.68e-04 | 3.05e-01 | 0.2633 |
| Page: 1 2 3 4 5 6 |
| Tissue | Expression Dynamics | Abbreviation |
| Cervix | 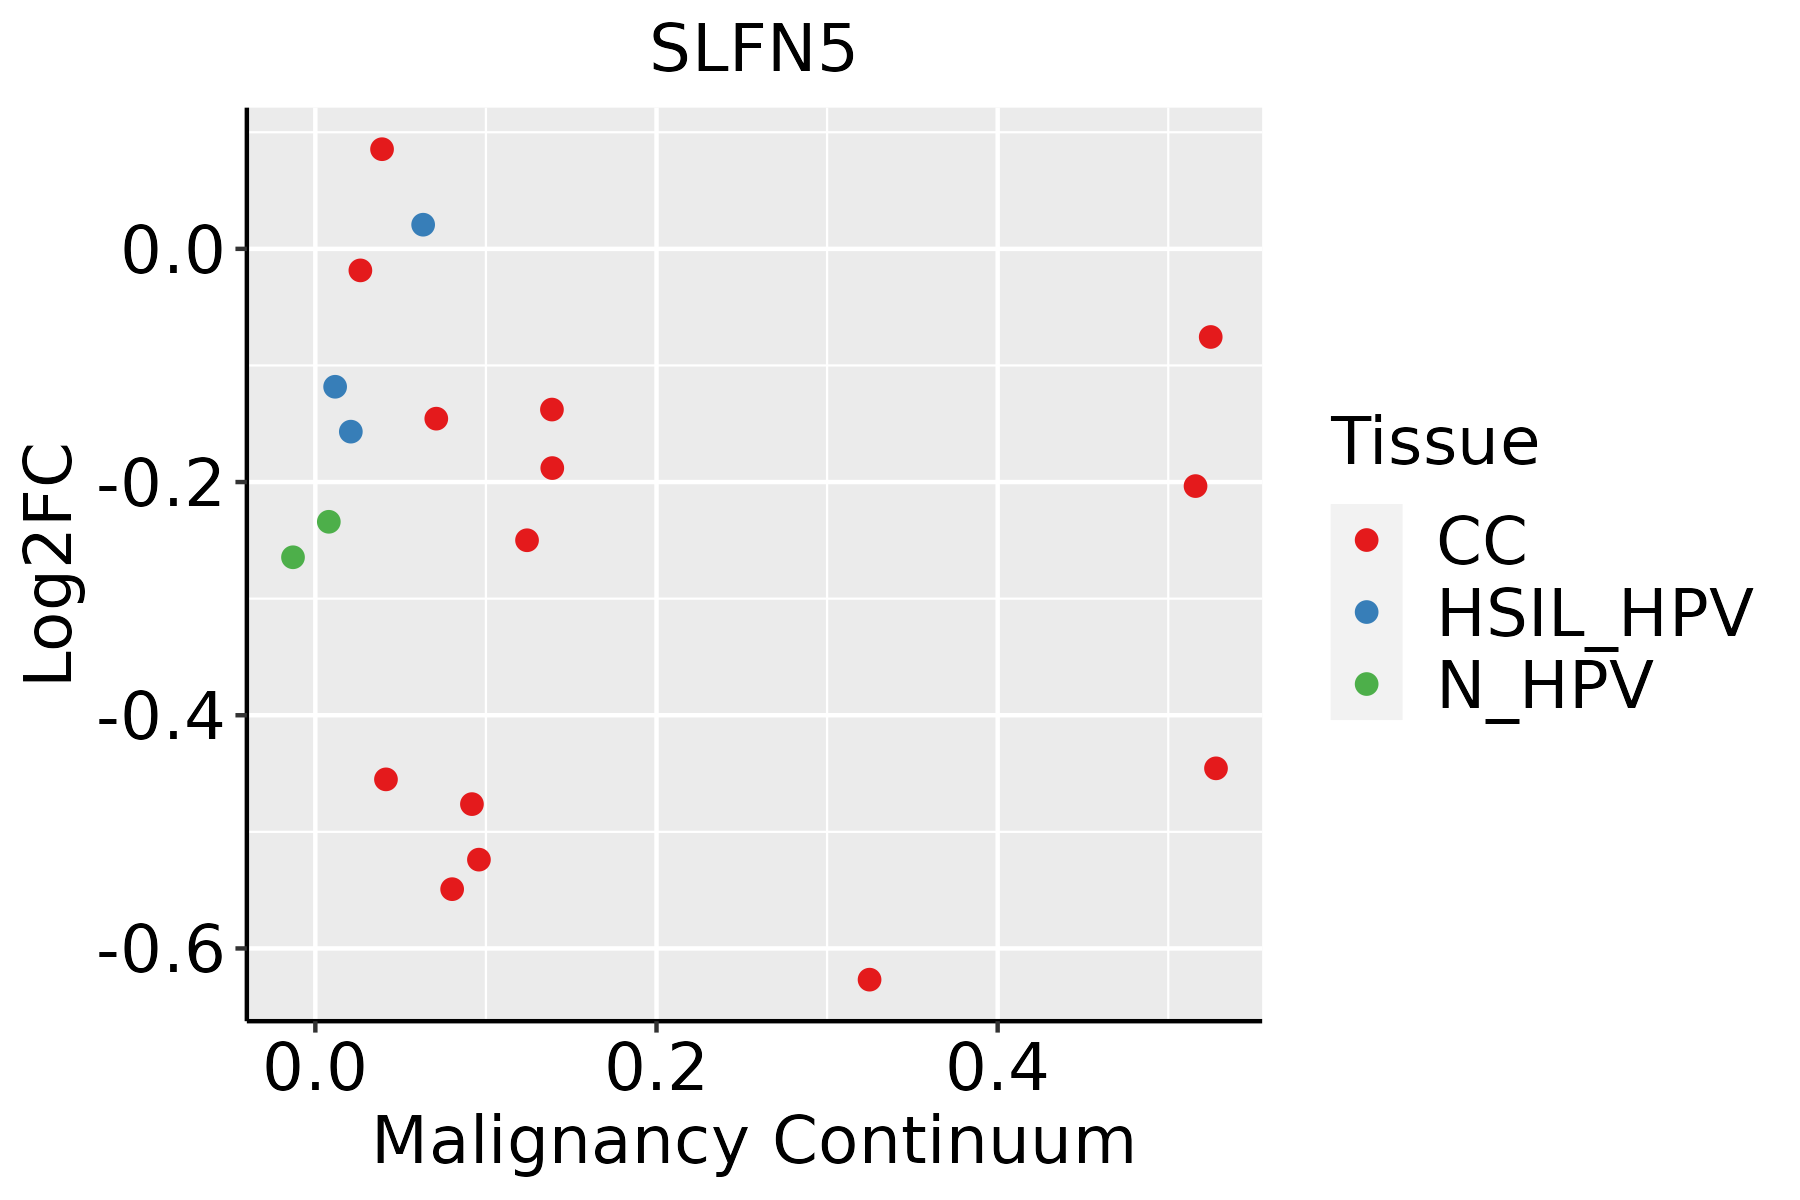 | CC: Cervix cancer |
| HSIL_HPV: HPV-infected high-grade squamous intraepithelial lesions | ||
| N_HPV: HPV-infected normal cervix | ||
| Esophagus |  | ESCC: Esophageal squamous cell carcinoma |
| HGIN: High-grade intraepithelial neoplasias | ||
| LGIN: Low-grade intraepithelial neoplasias | ||
| Liver | 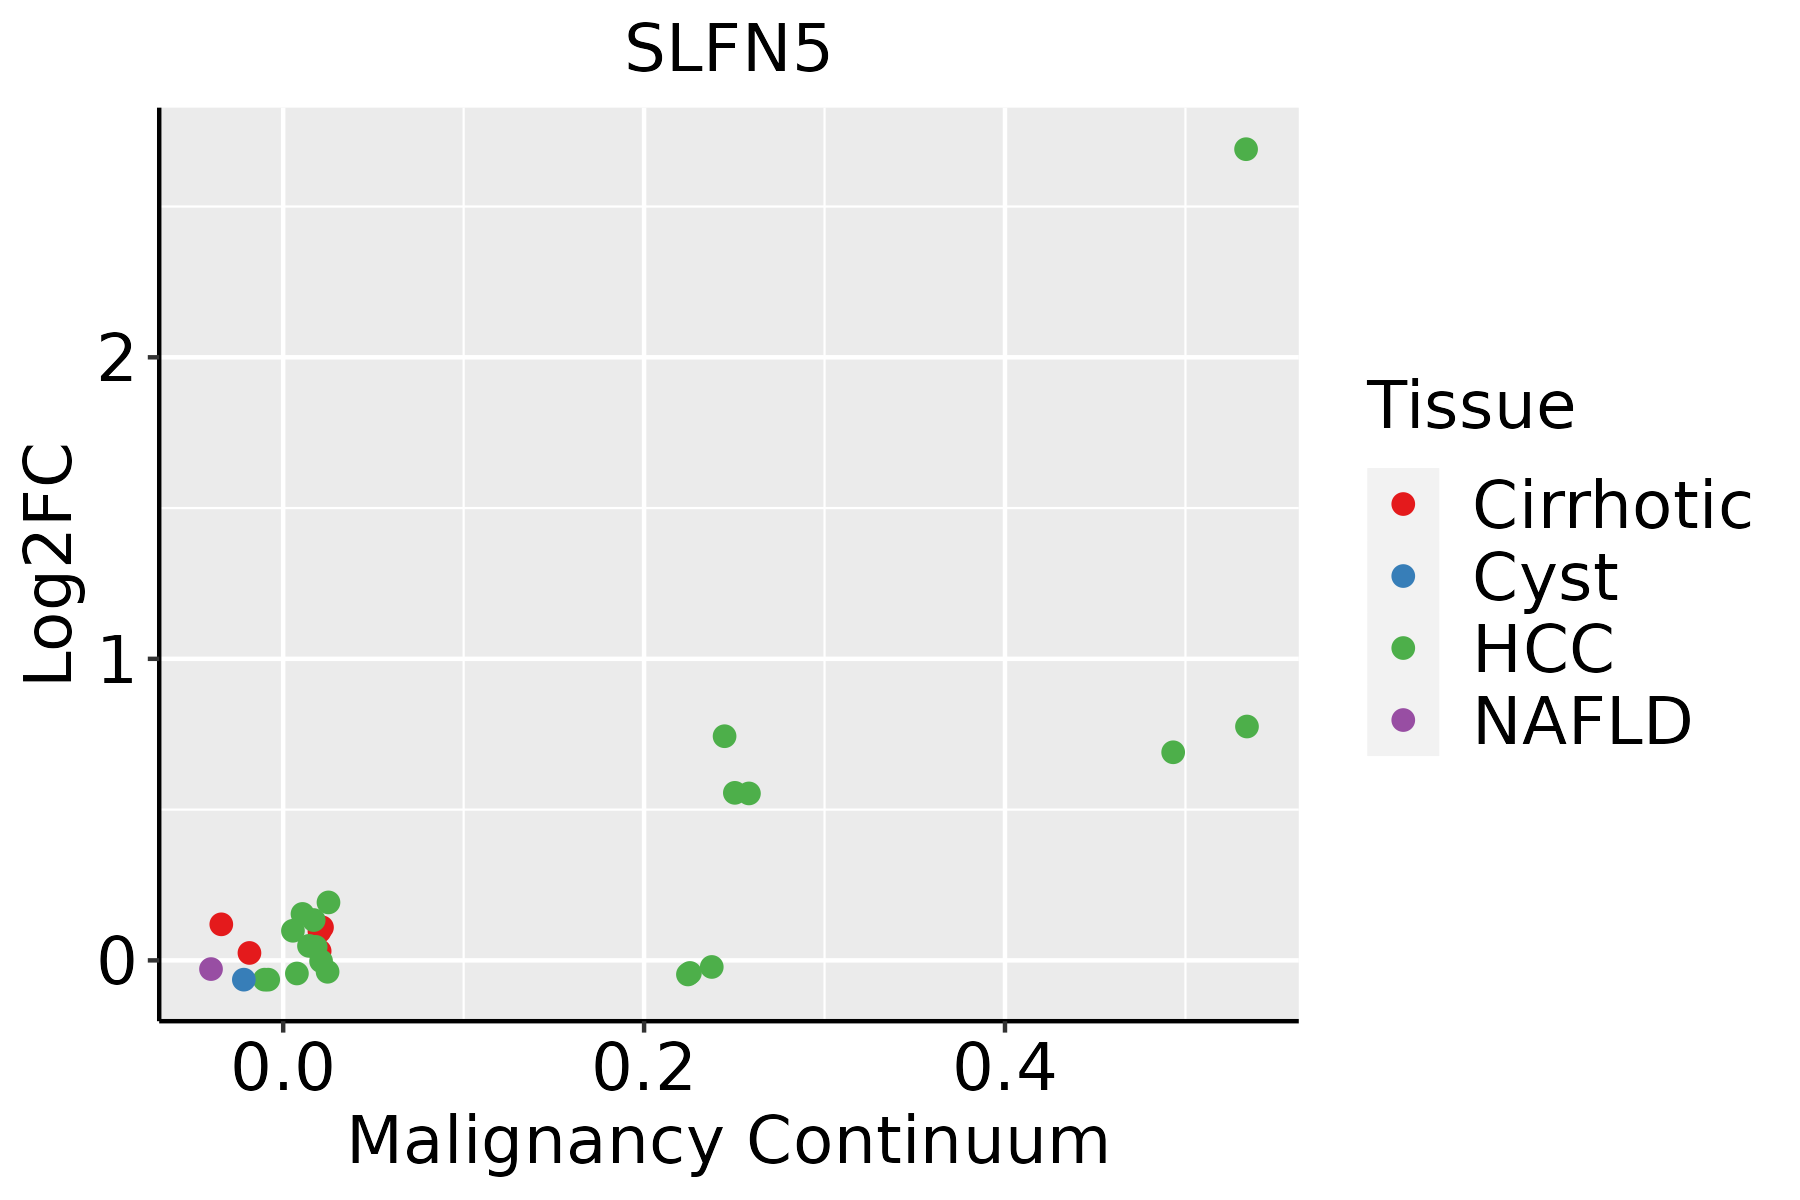 | HCC: Hepatocellular carcinoma |
| NAFLD: Non-alcoholic fatty liver disease | ||
| Lung | 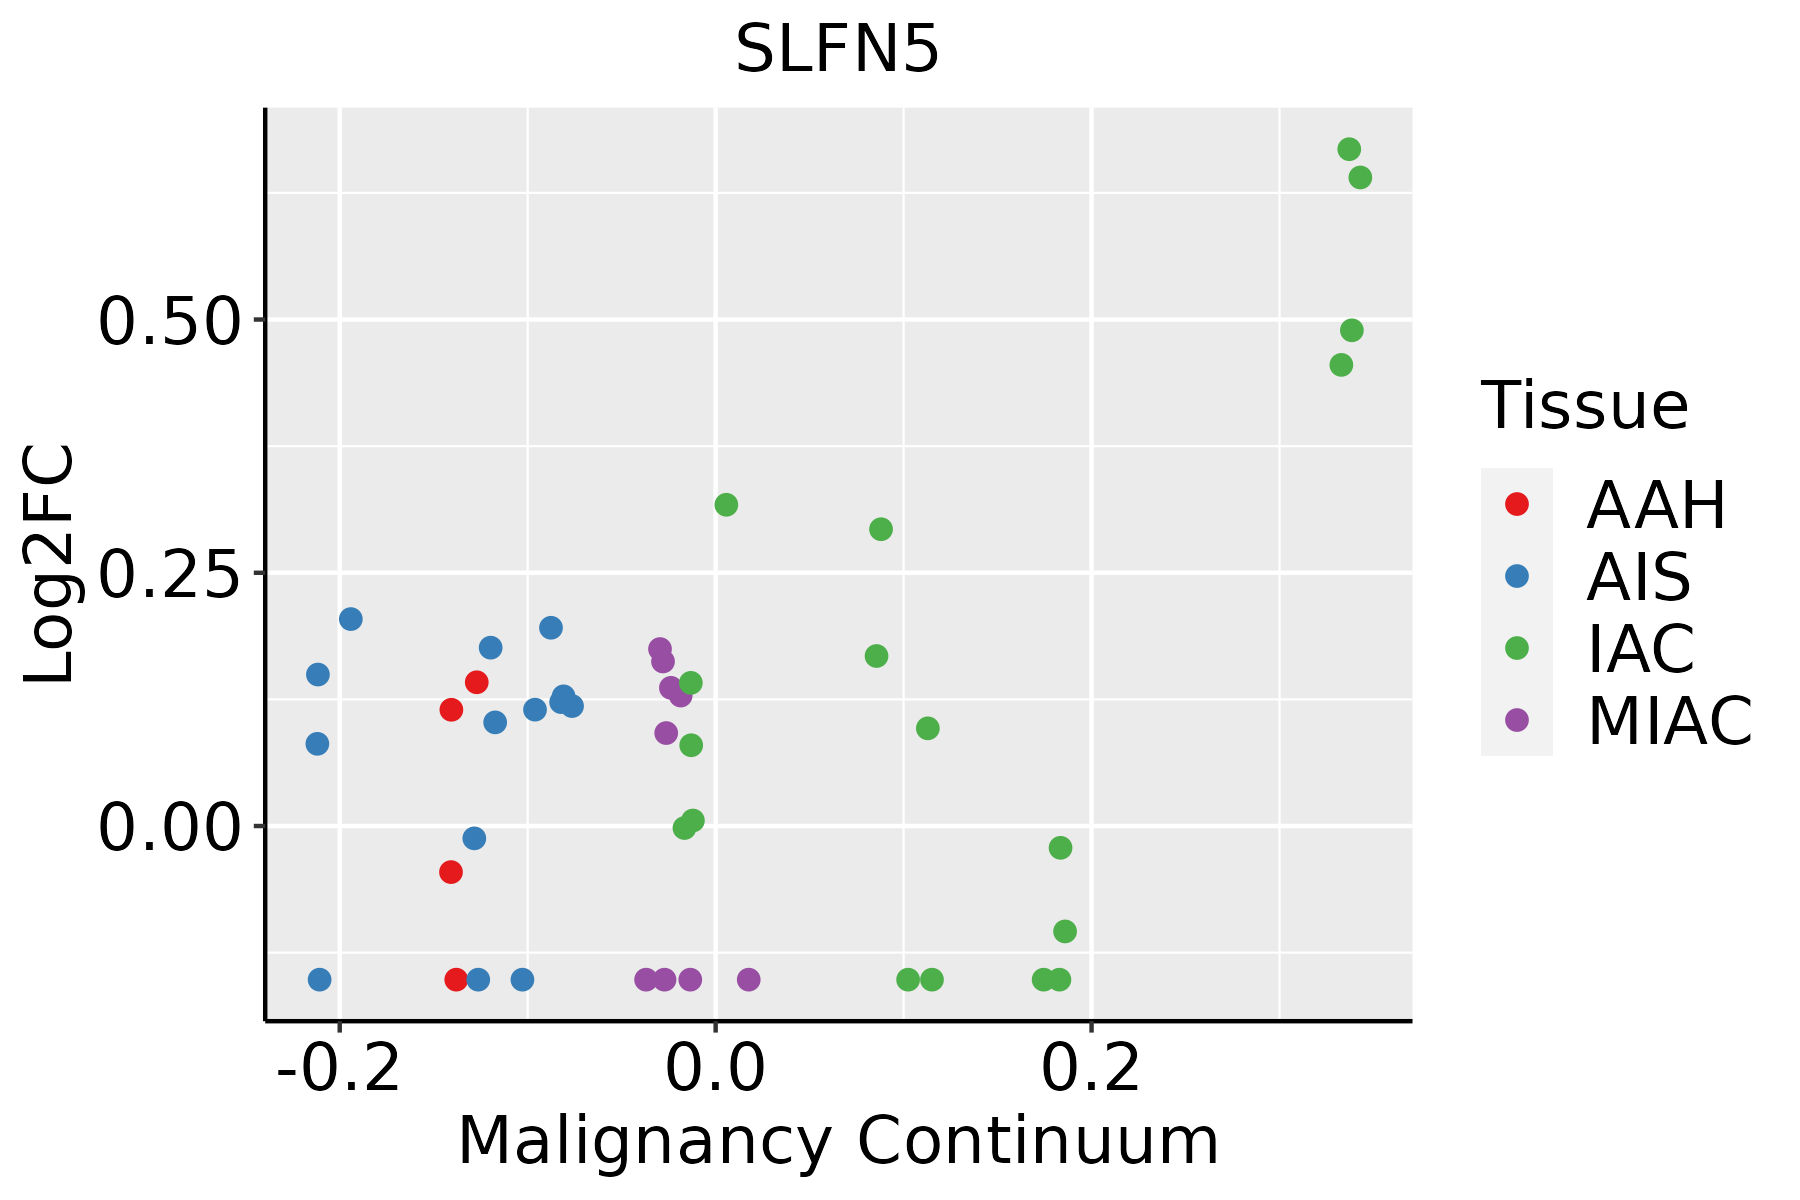 | AAH: Atypical adenomatous hyperplasia |
| AIS: Adenocarcinoma in situ | ||
| IAC: Invasive lung adenocarcinoma | ||
| MIA: Minimally invasive adenocarcinoma | ||
| Oral Cavity | 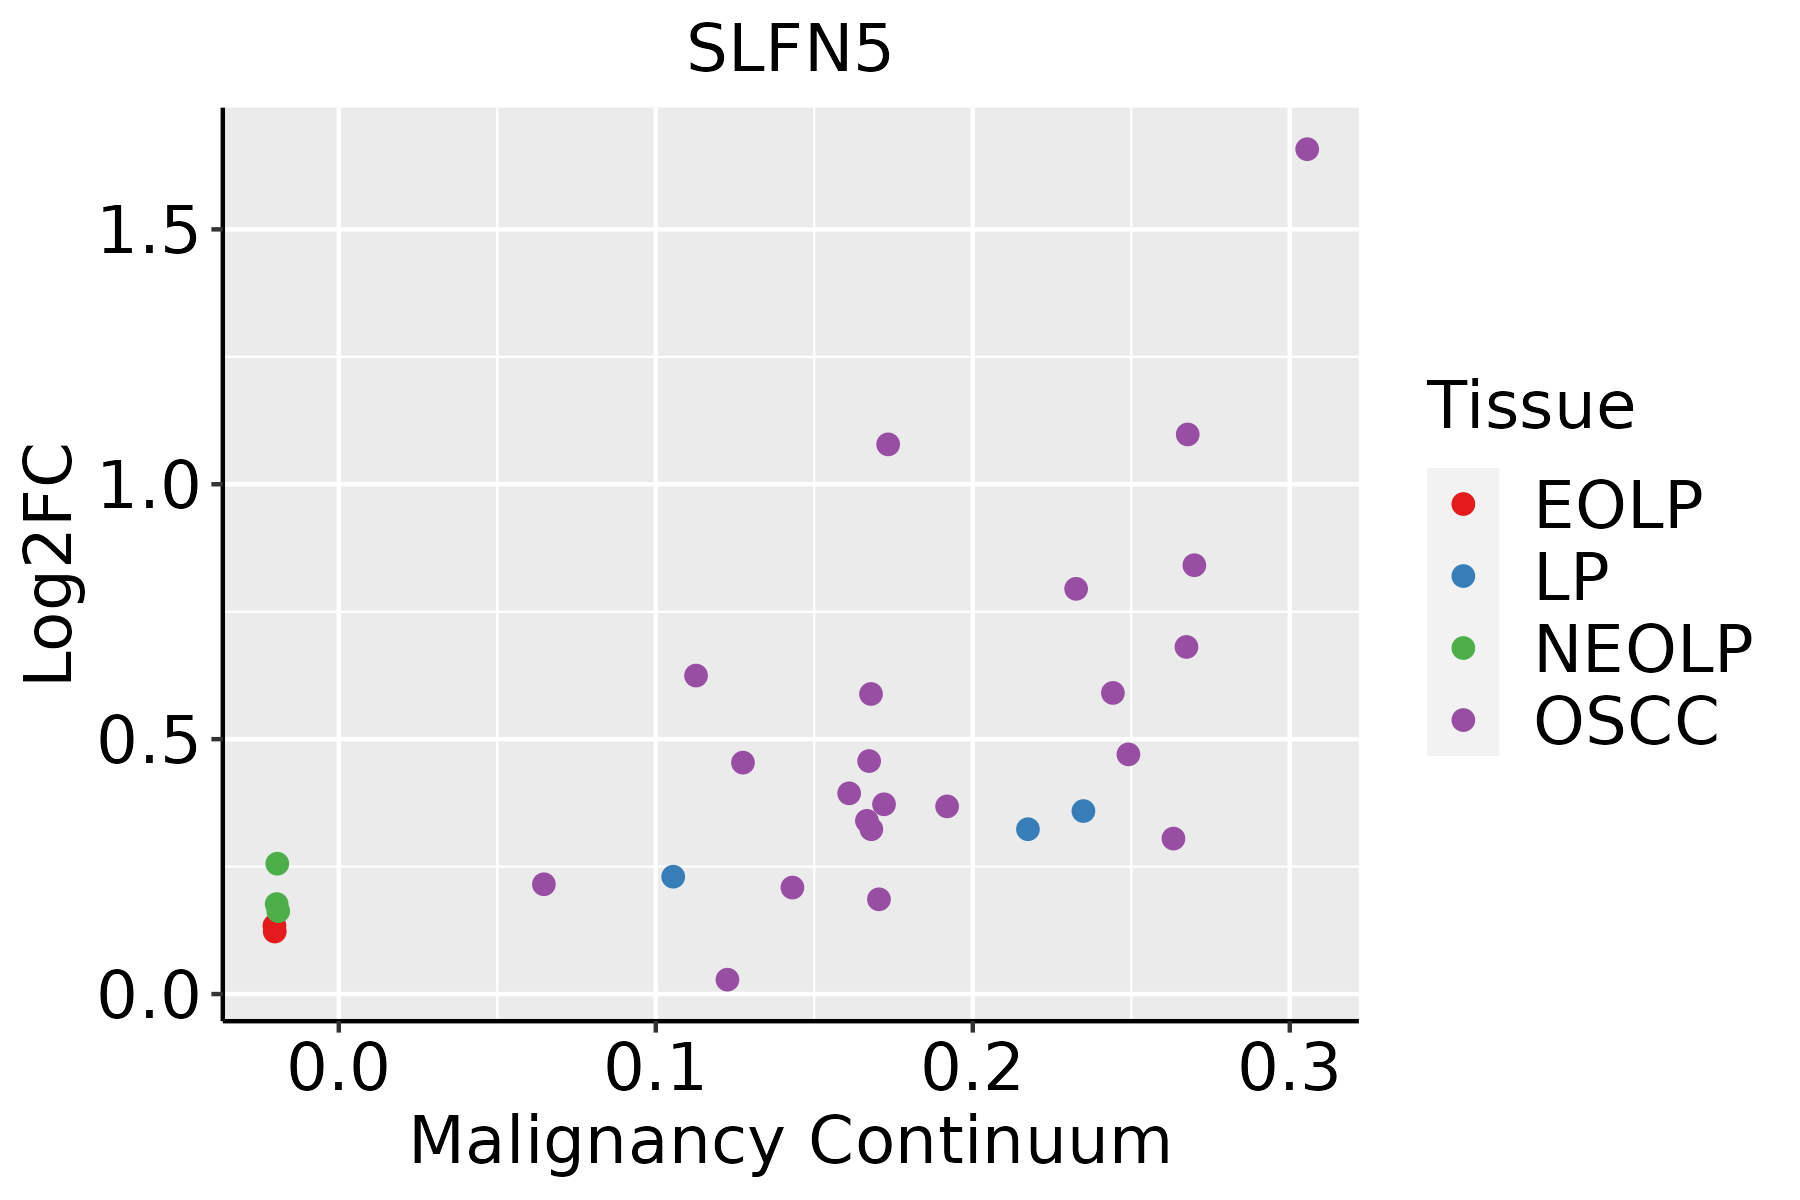 | EOLP: Erosive Oral lichen planus |
| LP: leukoplakia | ||
| NEOLP: Non-erosive oral lichen planus | ||
| OSCC: Oral squamous cell carcinoma | ||
| Prostate |  | BPH: Benign Prostatic Hyperplasia |
| Thyroid | 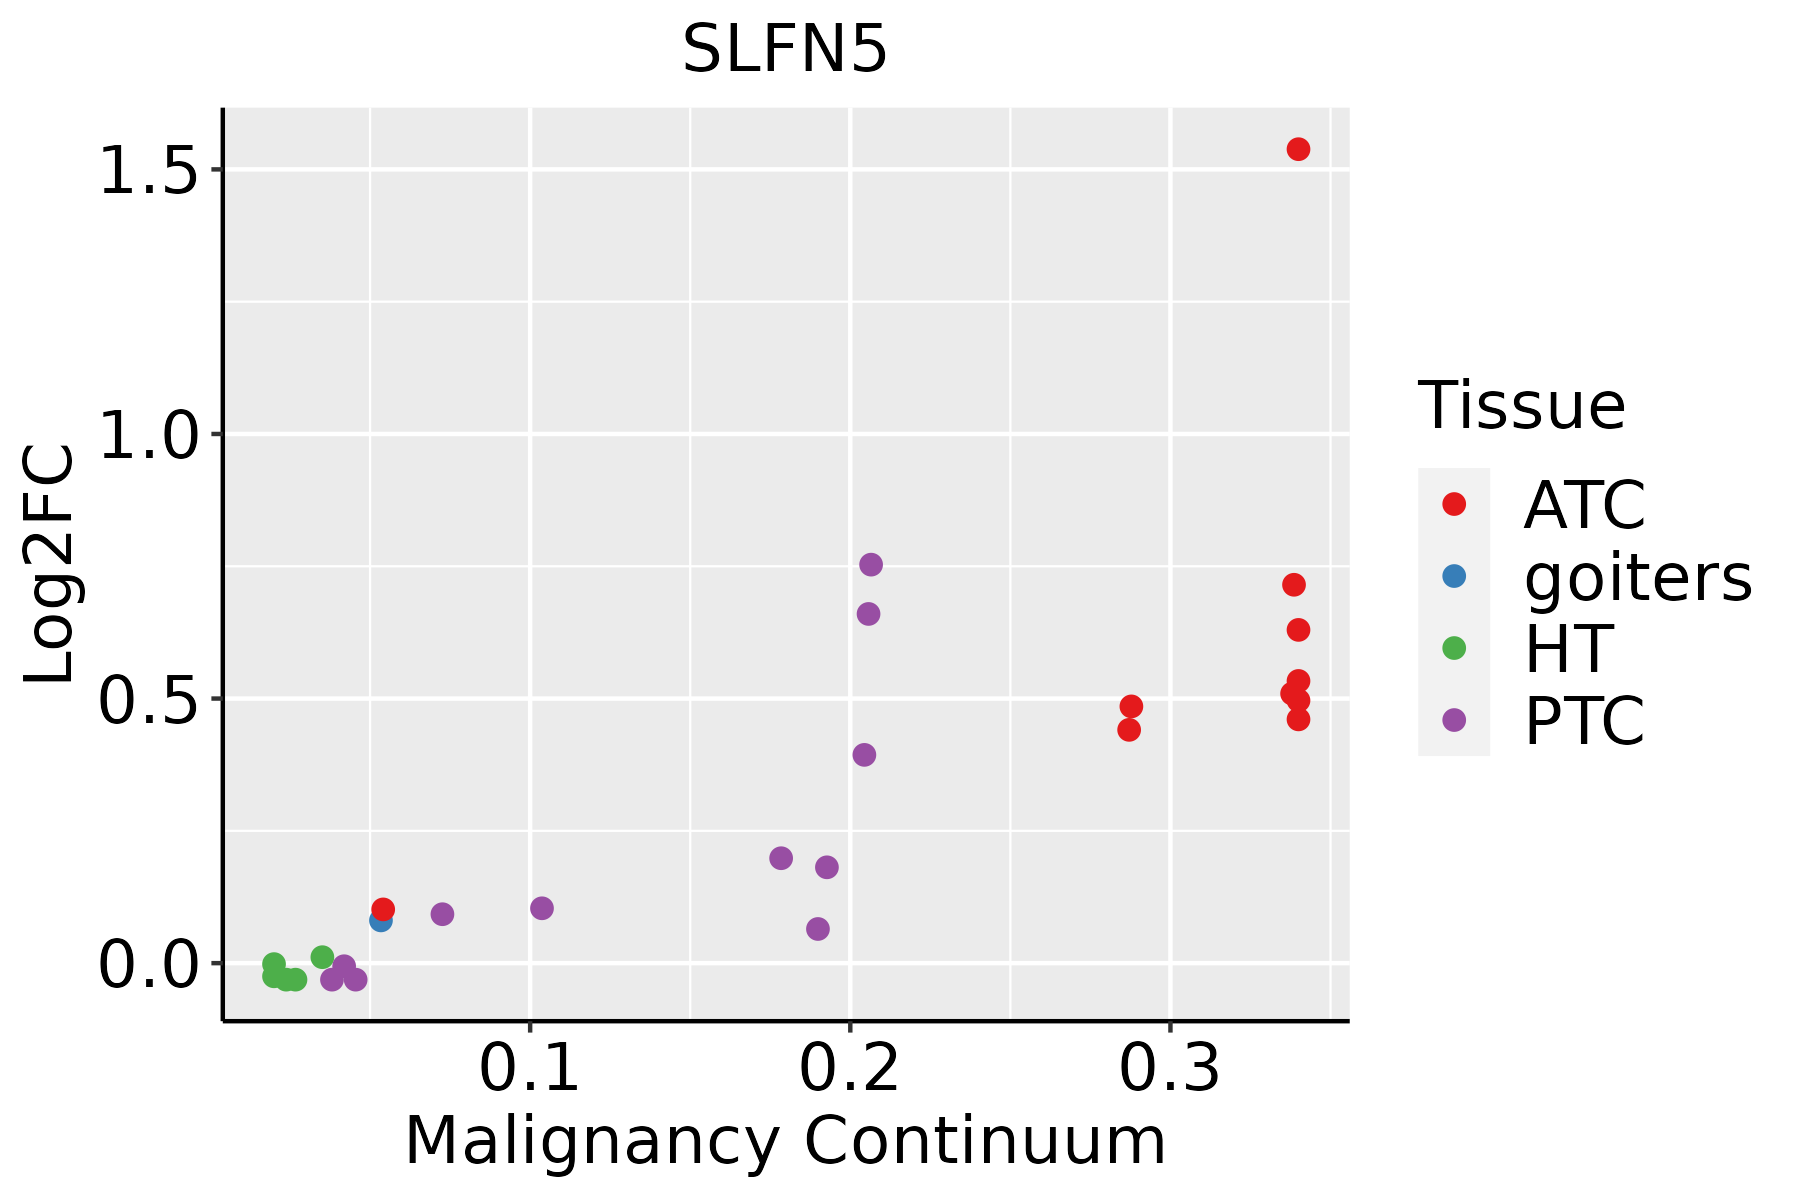 | ATC: Anaplastic thyroid cancer |
| HT: Hashimoto's thyroiditis | ||
| PTC: Papillary thyroid cancer |
| ∗log2FC in expression of this searched gene in stem-like cells from each diseased tissue sample relative to stem-like cells in normal samples in each tissue plotted against the malignancy continuum. Samples are colored based on if they are from different disease stage. |
Top |
Malignant transformation related pathway analysis |
| Find out the enriched GO biological processes and KEGG pathways involved in transition from healthy to precancer to cancer |
| Tissue | Disease Stage | Enriched GO biological Processes |
| Colorectum | AD |  |
| Colorectum | SER |  |
| Colorectum | MSS |  |
| Colorectum | MSI-H |  |
| Colorectum | FAP |  |
| ∗Top 15 enriched GO BP terms are showed in the bar plot of each disease state in each tissue. Each row represents a significant GO biological process which is colored according to the -log10(p.adjust). |
| Page: 1 2 3 4 5 6 7 8 9 |
| GO ID | Tissue | Disease Stage | Description | Gene Ratio | Bg Ratio | pvalue | p.adjust | Count |
| Page: 1 |
| Pathway ID | Tissue | Disease Stage | Description | Gene Ratio | Bg Ratio | pvalue | p.adjust | qvalue | Count |
| Page: 1 |
Top |
Cell-cell communication analysis |
| Identification of potential cell-cell interactions between two cell types and their ligand-receptor pairs for different disease states |
| Ligand | Receptor | LRpair | Pathway | Tissue | Disease Stage |
| Page: 1 |
Top |
Single-cell gene regulatory network inference analysis |
| Find out the significant the regulons (TFs) and the target genes of each regulon across cell types for different disease states |
| TF | Cell Type | Tissue | Disease Stage | Target Gene | RSS | Regulon Activity |
| ∗The dot plots of a searched regulon are shown for all cell subpopulations in each disease state of each tissue based on the regulon specific score inferred using pySCENIC and by calculating the average expression. |
| Page: 1 |
Top |
Somatic mutation of malignant transformation related genes |
| Annotation of somatic variants for genes involved in malignant transformation |
| Hugo Symbol | Variant Class | Variant Classification | dbSNP RS | HGVSc | HGVSp | HGVSp Short | SWISSPROT | BIOTYPE | SIFT | PolyPhen | Tumor Sample Barcode | Tissue | Histology | Sex | Age | Stage | Therapy Types | Drugs | Outcome |
| SLFN5 | SNV | Missense_Mutation | c.2433N>A | p.Met811Ile | p.M811I | Q08AF3 | protein_coding | tolerated(0.14) | benign(0.003) | TCGA-A2-A0YK-01 | Breast | breast invasive carcinoma | Female | <65 | I/II | Chemotherapy | cytoxan | SD | |
| SLFN5 | SNV | Missense_Mutation | rs200108679 | c.1100N>T | p.Ser367Leu | p.S367L | Q08AF3 | protein_coding | tolerated(1) | benign(0) | TCGA-AN-A046-01 | Breast | breast invasive carcinoma | Female | >=65 | I/II | Unknown | Unknown | SD |
| SLFN5 | SNV | Missense_Mutation | c.2040N>C | p.Trp680Cys | p.W680C | Q08AF3 | protein_coding | tolerated(0.05) | probably_damaging(0.971) | TCGA-B6-A0IJ-01 | Breast | breast invasive carcinoma | Female | <65 | I/II | Unknown | Unknown | SD | |
| SLFN5 | SNV | Missense_Mutation | novel | c.760T>C | p.Ser254Pro | p.S254P | Q08AF3 | protein_coding | tolerated(0.25) | possibly_damaging(0.5) | TCGA-BH-A1FU-01 | Breast | breast invasive carcinoma | Female | <65 | I/II | Unknown | Unknown | PD |
| SLFN5 | SNV | Missense_Mutation | rs760275920 | c.1193N>T | p.Ser398Leu | p.S398L | Q08AF3 | protein_coding | tolerated(0.11) | benign(0.007) | TCGA-D8-A27V-01 | Breast | breast invasive carcinoma | Female | <65 | I/II | Hormone Therapy | tamoxiphen | SD |
| SLFN5 | SNV | Missense_Mutation | rs372293965 | c.106N>T | p.Arg36Trp | p.R36W | Q08AF3 | protein_coding | deleterious(0.02) | benign(0) | TCGA-2W-A8YY-01 | Cervix | cervical & endocervical cancer | Female | <65 | I/II | Chemotherapy | cisplatin | CR |
| SLFN5 | SNV | Missense_Mutation | rs755184137 | c.1526N>T | p.Ser509Leu | p.S509L | Q08AF3 | protein_coding | tolerated(0.07) | benign(0.003) | TCGA-2W-A8YY-01 | Cervix | cervical & endocervical cancer | Female | <65 | I/II | Chemotherapy | cisplatin | CR |
| SLFN5 | SNV | Missense_Mutation | rs773377768 | c.2488N>A | p.Gly830Ser | p.G830S | Q08AF3 | protein_coding | tolerated(0.97) | benign(0.003) | TCGA-2W-A8YY-01 | Cervix | cervical & endocervical cancer | Female | <65 | I/II | Chemotherapy | cisplatin | CR |
| SLFN5 | SNV | Missense_Mutation | c.363N>C | p.Glu121Asp | p.E121D | Q08AF3 | protein_coding | tolerated(0.37) | benign(0) | TCGA-DR-A0ZM-01 | Cervix | cervical & endocervical cancer | Female | <65 | III/IV | Unspecific | Cisplatin | SD | |
| SLFN5 | SNV | Missense_Mutation | c.2338N>A | p.Leu780Ile | p.L780I | Q08AF3 | protein_coding | deleterious(0.01) | benign(0.264) | TCGA-FU-A3HZ-01 | Cervix | cervical & endocervical cancer | Female | <65 | I/II | Chemotherapy | cisplatin | CR |
| Page: 1 2 3 4 5 6 7 8 9 10 11 12 |
Top |
Related drugs of malignant transformation related genes |
| Identification of chemicals and drugs interact with genes involved in malignant transfromation |
| (DGIdb 4.0) |
| Entrez ID | Symbol | Category | Interaction Types | Drug Claim Name | Drug Name | PMIDs |
| Page: 1 |

Copyright 2023-Present -The University of Texas Health Science Center at Houston |