
|
|||||
|
 | |
| |
| |
| |
| |
| |
|
Gene: SLC9A3R2 |
Gene summary for SLC9A3R2 |
| Gene information | Species | Human | Gene symbol | SLC9A3R2 | Gene ID | 9351 |
| Gene name | SLC9A3 regulator 2 | |
| Gene Alias | E3KARP | |
| Cytomap | 16p13.3 | |
| Gene Type | protein-coding | GO ID | GO:0008104 | UniProtAcc | Q15599 |
Top |
Malignant transformation analysis |
| Identification of the aberrant gene expression in precancerous and cancerous lesions by comparing the gene expression of stem-like cells in diseased tissues with normal stem cells |
| Entrez ID | Symbol | Replicates | Species | Organ | Tissue | Adj P-value | Log2FC | Malignancy |
| 9351 | SLC9A3R2 | P79T-E | Human | Esophagus | ESCC | 2.58e-03 | 5.85e-02 | 0.1154 |
| 9351 | SLC9A3R2 | P80T-E | Human | Esophagus | ESCC | 1.06e-13 | 2.72e-01 | 0.155 |
| 9351 | SLC9A3R2 | P82T-E | Human | Esophagus | ESCC | 7.16e-11 | 3.83e-01 | 0.1072 |
| 9351 | SLC9A3R2 | P83T-E | Human | Esophagus | ESCC | 1.47e-05 | 1.63e-01 | 0.1738 |
| 9351 | SLC9A3R2 | P84T-E | Human | Esophagus | ESCC | 4.80e-06 | 8.47e-01 | 0.0933 |
| 9351 | SLC9A3R2 | P94T-E | Human | Esophagus | ESCC | 1.16e-04 | 6.80e-01 | 0.0879 |
| 9351 | SLC9A3R2 | P104T-E | Human | Esophagus | ESCC | 1.26e-06 | 5.37e-01 | 0.0931 |
| 9351 | SLC9A3R2 | P107T-E | Human | Esophagus | ESCC | 6.30e-03 | 1.29e-01 | 0.171 |
| 9351 | SLC9A3R2 | P126T-E | Human | Esophagus | ESCC | 1.31e-11 | 1.55e+00 | 0.1125 |
| 9351 | SLC9A3R2 | P127T-E | Human | Esophagus | ESCC | 5.43e-23 | 4.82e-01 | 0.0826 |
| 9351 | SLC9A3R2 | P128T-E | Human | Esophagus | ESCC | 3.14e-40 | 1.12e+00 | 0.1241 |
| 9351 | SLC9A3R2 | P130T-E | Human | Esophagus | ESCC | 2.26e-54 | 1.05e+00 | 0.1676 |
| 9351 | SLC9A3R2 | S43 | Human | Liver | Cirrhotic | 2.89e-08 | -1.20e-01 | -0.0187 |
| 9351 | SLC9A3R2 | HCC1_Meng | Human | Liver | HCC | 4.96e-61 | -9.20e-02 | 0.0246 |
| 9351 | SLC9A3R2 | HCC2_Meng | Human | Liver | HCC | 2.87e-30 | -4.65e-02 | 0.0107 |
| 9351 | SLC9A3R2 | cirrhotic1 | Human | Liver | Cirrhotic | 4.19e-10 | 1.90e-01 | 0.0202 |
| 9351 | SLC9A3R2 | cirrhotic2 | Human | Liver | Cirrhotic | 1.27e-20 | 4.86e-01 | 0.0201 |
| 9351 | SLC9A3R2 | cirrhotic3 | Human | Liver | Cirrhotic | 3.08e-02 | 9.37e-02 | 0.0215 |
| 9351 | SLC9A3R2 | HCC5 | Human | Liver | HCC | 2.36e-04 | -3.08e-01 | 0.4932 |
| 9351 | SLC9A3R2 | Pt13.b | Human | Liver | HCC | 2.41e-17 | 4.17e-02 | 0.0251 |
| Page: 1 2 3 4 5 6 |
| Tissue | Expression Dynamics | Abbreviation |
| Endometrium |  | AEH: Atypical endometrial hyperplasia |
| EEC: Endometrioid Cancer | ||
| Esophagus | 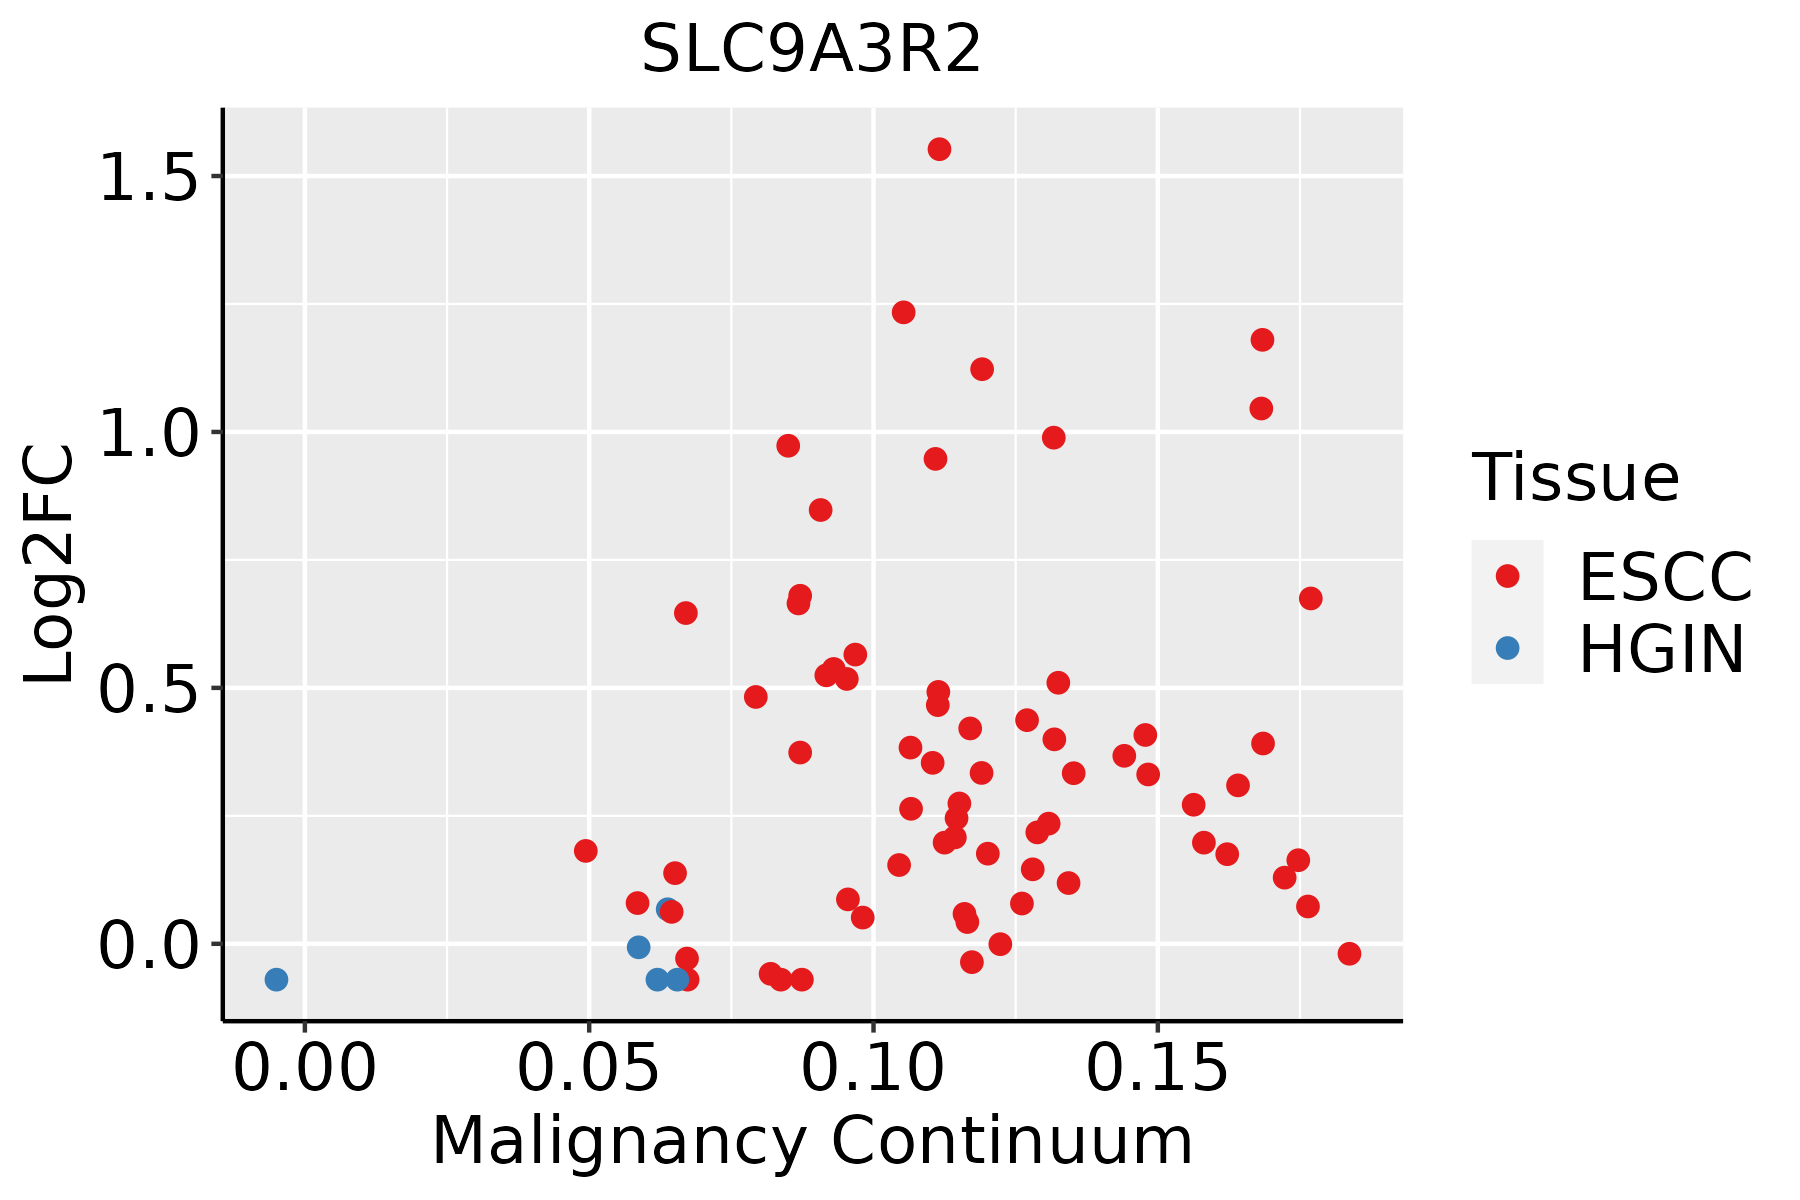 | ESCC: Esophageal squamous cell carcinoma |
| HGIN: High-grade intraepithelial neoplasias | ||
| LGIN: Low-grade intraepithelial neoplasias | ||
| Liver |  | HCC: Hepatocellular carcinoma |
| NAFLD: Non-alcoholic fatty liver disease | ||
| Oral Cavity | 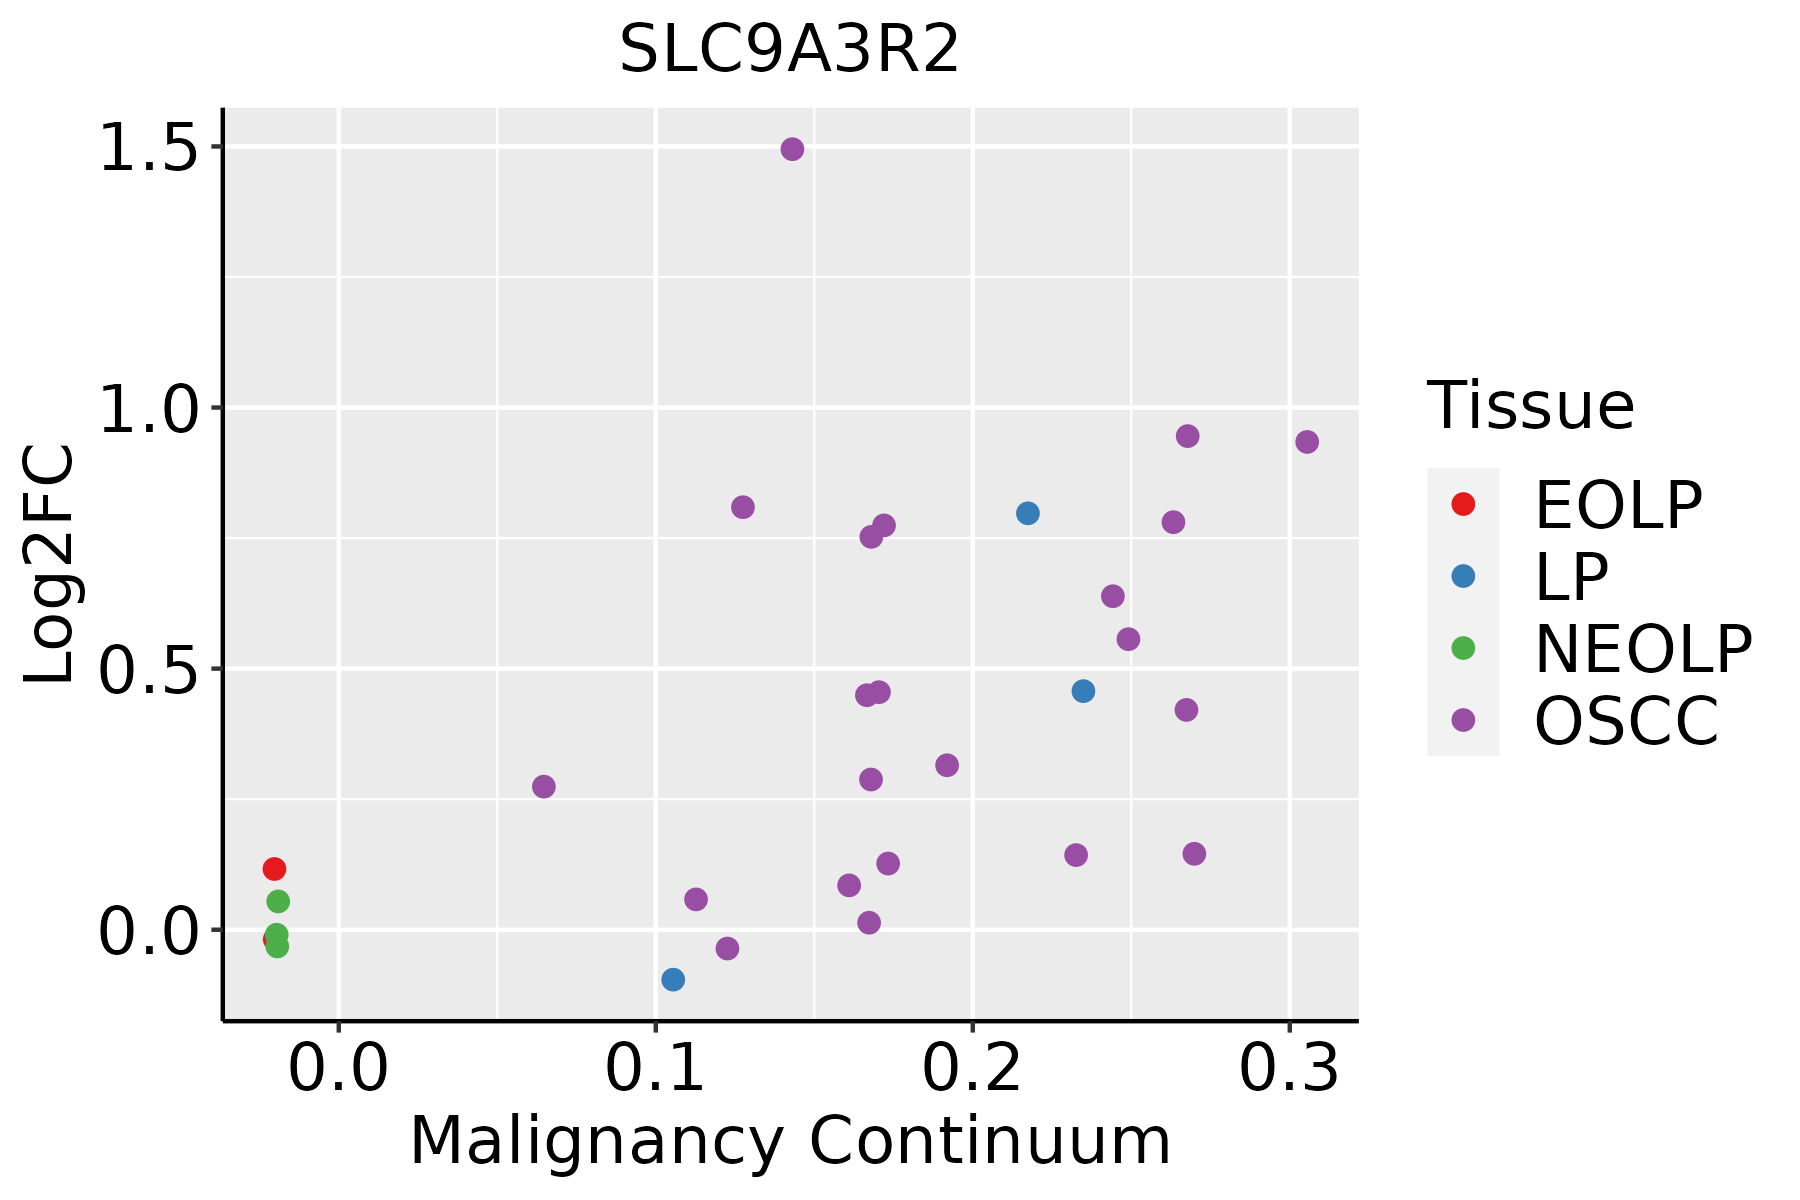 | EOLP: Erosive Oral lichen planus |
| LP: leukoplakia | ||
| NEOLP: Non-erosive oral lichen planus | ||
| OSCC: Oral squamous cell carcinoma | ||
| Prostate |  | BPH: Benign Prostatic Hyperplasia |
| Thyroid |  | ATC: Anaplastic thyroid cancer |
| HT: Hashimoto's thyroiditis | ||
| PTC: Papillary thyroid cancer |
| ∗log2FC in expression of this searched gene in stem-like cells from each diseased tissue sample relative to stem-like cells in normal samples in each tissue plotted against the malignancy continuum. Samples are colored based on if they are from different disease stage. |
Top |
Malignant transformation related pathway analysis |
| Find out the enriched GO biological processes and KEGG pathways involved in transition from healthy to precancer to cancer |
| Tissue | Disease Stage | Enriched GO biological Processes |
| Colorectum | AD |  |
| Colorectum | SER |  |
| Colorectum | MSS |  |
| Colorectum | MSI-H |  |
| Colorectum | FAP |  |
| ∗Top 15 enriched GO BP terms are showed in the bar plot of each disease state in each tissue. Each row represents a significant GO biological process which is colored according to the -log10(p.adjust). |
| Page: 1 2 3 4 5 6 7 8 9 |
| GO ID | Tissue | Disease Stage | Description | Gene Ratio | Bg Ratio | pvalue | p.adjust | Count |
| GO:007265914 | Endometrium | AEH | protein localization to plasma membrane | 63/2100 | 284/18723 | 7.58e-08 | 3.92e-06 | 63 |
| GO:19907789 | Endometrium | AEH | protein localization to cell periphery | 68/2100 | 333/18723 | 6.38e-07 | 2.38e-05 | 68 |
| GO:007265915 | Endometrium | EEC | protein localization to plasma membrane | 64/2168 | 284/18723 | 1.05e-07 | 5.05e-06 | 64 |
| GO:199077814 | Endometrium | EEC | protein localization to cell periphery | 69/2168 | 333/18723 | 9.71e-07 | 3.31e-05 | 69 |
| GO:0072659110 | Esophagus | ESCC | protein localization to plasma membrane | 193/8552 | 284/18723 | 1.95e-14 | 1.03e-12 | 193 |
| GO:199077819 | Esophagus | ESCC | protein localization to cell periphery | 217/8552 | 333/18723 | 4.08e-13 | 1.88e-11 | 217 |
| GO:199077811 | Liver | Cirrhotic | protein localization to cell periphery | 135/4634 | 333/18723 | 1.18e-10 | 6.21e-09 | 135 |
| GO:007265911 | Liver | Cirrhotic | protein localization to plasma membrane | 119/4634 | 284/18723 | 1.30e-10 | 6.80e-09 | 119 |
| GO:007265921 | Liver | HCC | protein localization to plasma membrane | 177/7958 | 284/18723 | 1.02e-11 | 4.18e-10 | 177 |
| GO:199077821 | Liver | HCC | protein localization to cell periphery | 200/7958 | 333/18723 | 6.07e-11 | 2.23e-09 | 200 |
| GO:007265918 | Oral cavity | OSCC | protein localization to plasma membrane | 169/7305 | 284/18723 | 1.69e-12 | 7.21e-11 | 169 |
| GO:199077816 | Oral cavity | OSCC | protein localization to cell periphery | 190/7305 | 333/18723 | 1.46e-11 | 5.13e-10 | 190 |
| GO:007265919 | Oral cavity | LP | protein localization to plasma membrane | 119/4623 | 284/18723 | 1.11e-10 | 6.44e-09 | 119 |
| GO:199077817 | Oral cavity | LP | protein localization to cell periphery | 133/4623 | 333/18723 | 4.42e-10 | 2.21e-08 | 133 |
| GO:007265916 | Prostate | BPH | protein localization to plasma membrane | 89/3107 | 284/18723 | 5.00e-10 | 2.56e-08 | 89 |
| GO:199077810 | Prostate | BPH | protein localization to cell periphery | 95/3107 | 333/18723 | 2.78e-08 | 8.13e-07 | 95 |
| GO:007265917 | Prostate | Tumor | protein localization to plasma membrane | 90/3246 | 284/18723 | 2.07e-09 | 8.99e-08 | 90 |
| GO:199077815 | Prostate | Tumor | protein localization to cell periphery | 97/3246 | 333/18723 | 5.88e-08 | 1.75e-06 | 97 |
| GO:0072659112 | Thyroid | PTC | protein localization to plasma membrane | 153/5968 | 284/18723 | 9.90e-15 | 6.50e-13 | 153 |
| GO:1990778111 | Thyroid | PTC | protein localization to cell periphery | 172/5968 | 333/18723 | 3.71e-14 | 2.30e-12 | 172 |
| Page: 1 2 |
| Pathway ID | Tissue | Disease Stage | Description | Gene Ratio | Bg Ratio | pvalue | p.adjust | qvalue | Count |
| Page: 1 |
Top |
Cell-cell communication analysis |
| Identification of potential cell-cell interactions between two cell types and their ligand-receptor pairs for different disease states |
| Ligand | Receptor | LRpair | Pathway | Tissue | Disease Stage |
| Page: 1 |
Top |
Single-cell gene regulatory network inference analysis |
| Find out the significant the regulons (TFs) and the target genes of each regulon across cell types for different disease states |
| TF | Cell Type | Tissue | Disease Stage | Target Gene | RSS | Regulon Activity |
| ∗The dot plots of a searched regulon are shown for all cell subpopulations in each disease state of each tissue based on the regulon specific score inferred using pySCENIC and by calculating the average expression. |
| Page: 1 |
Top |
Somatic mutation of malignant transformation related genes |
| Annotation of somatic variants for genes involved in malignant transformation |
| Hugo Symbol | Variant Class | Variant Classification | dbSNP RS | HGVSc | HGVSp | HGVSp Short | SWISSPROT | BIOTYPE | SIFT | PolyPhen | Tumor Sample Barcode | Tissue | Histology | Sex | Age | Stage | Therapy Types | Drugs | Outcome |
| SLC9A3R2 | SNV | Missense_Mutation | c.334C>A | p.Leu112Ile | p.L112I | Q15599 | protein_coding | tolerated(0.53) | benign(0.003) | TCGA-AC-A5EH-01 | Breast | breast invasive carcinoma | Female | >=65 | I/II | Unknown | Unknown | SD | |
| SLC9A3R2 | SNV | Missense_Mutation | rs754722358 | c.329G>A | p.Arg110Gln | p.R110Q | Q15599 | protein_coding | tolerated(0.52) | benign(0.001) | TCGA-2W-A8YY-01 | Cervix | cervical & endocervical cancer | Female | <65 | I/II | Chemotherapy | cisplatin | CR |
| SLC9A3R2 | SNV | Missense_Mutation | novel | c.965C>T | p.Ala322Val | p.A322V | Q15599 | protein_coding | deleterious(0.01) | probably_damaging(0.993) | TCGA-2W-A8YY-01 | Cervix | cervical & endocervical cancer | Female | <65 | I/II | Chemotherapy | cisplatin | CR |
| SLC9A3R2 | SNV | Missense_Mutation | c.685G>A | p.Asp229Asn | p.D229N | Q15599 | protein_coding | deleterious(0) | probably_damaging(0.974) | TCGA-CK-4951-01 | Colorectum | colon adenocarcinoma | Female | >=65 | I/II | Unknown | Unknown | PD | |
| SLC9A3R2 | SNV | Missense_Mutation | rs192036446 | c.656G>A | p.Arg219Gln | p.R219Q | Q15599 | protein_coding | deleterious(0.05) | benign(0.003) | TCGA-CK-6746-01 | Colorectum | colon adenocarcinoma | Female | >=65 | I/II | Unknown | Unknown | SD |
| SLC9A3R2 | SNV | Missense_Mutation | novel | c.232N>A | p.Ala78Thr | p.A78T | Q15599 | protein_coding | deleterious(0.03) | possibly_damaging(0.503) | TCGA-A5-A0G1-01 | Endometrium | uterine corpus endometrioid carcinoma | Female | >=65 | I/II | Unknown | Unknown | SD |
| SLC9A3R2 | SNV | Missense_Mutation | rs41292275 | c.713N>A | p.Arg238Gln | p.R238Q | Q15599 | protein_coding | deleterious(0.02) | benign(0.007) | TCGA-A5-A0G1-01 | Endometrium | uterine corpus endometrioid carcinoma | Female | >=65 | I/II | Unknown | Unknown | SD |
| SLC9A3R2 | SNV | Missense_Mutation | c.334N>A | p.Leu112Ile | p.L112I | Q15599 | protein_coding | tolerated(0.53) | benign(0.003) | TCGA-AP-A059-01 | Endometrium | uterine corpus endometrioid carcinoma | Female | >=65 | I/II | Unknown | Unknown | SD | |
| SLC9A3R2 | SNV | Missense_Mutation | c.259G>C | p.Val87Leu | p.V87L | Q15599 | protein_coding | deleterious(0.02) | probably_damaging(0.998) | TCGA-AP-A1DR-01 | Endometrium | uterine corpus endometrioid carcinoma | Female | <65 | III/IV | Chemotherapy | cisplatin | SD | |
| SLC9A3R2 | SNV | Missense_Mutation | novel | c.806N>T | p.Ser269Phe | p.S269F | Q15599 | protein_coding | deleterious(0.02) | benign(0.022) | TCGA-AX-A2H4-01 | Endometrium | uterine corpus endometrioid carcinoma | Female | >=65 | III/IV | Unknown | Unknown | PD |
| Page: 1 2 |
Top |
Related drugs of malignant transformation related genes |
| Identification of chemicals and drugs interact with genes involved in malignant transfromation |
| (DGIdb 4.0) |
| Entrez ID | Symbol | Category | Interaction Types | Drug Claim Name | Drug Name | PMIDs |
| Page: 1 |

Copyright 2023-Present -The University of Texas Health Science Center at Houston |