
|
|||||
|
 | |
| |
| |
| |
| |
| |
|
Gene: SIRT7 |
Gene summary for SIRT7 |
| Gene information | Species | Human | Gene symbol | SIRT7 | Gene ID | 51547 |
| Gene name | sirtuin 7 | |
| Gene Alias | SIR2L7 | |
| Cytomap | 17q25.3 | |
| Gene Type | protein-coding | GO ID | GO:0000003 | UniProtAcc | Q9NRC8 |
Top |
Malignant transformation analysis |
| Identification of the aberrant gene expression in precancerous and cancerous lesions by comparing the gene expression of stem-like cells in diseased tissues with normal stem cells |
| Entrez ID | Symbol | Replicates | Species | Organ | Tissue | Adj P-value | Log2FC | Malignancy |
| 51547 | SIRT7 | P76T-E | Human | Esophagus | ESCC | 1.27e-11 | 2.34e-01 | 0.1207 |
| 51547 | SIRT7 | P79T-E | Human | Esophagus | ESCC | 6.72e-10 | 1.63e-01 | 0.1154 |
| 51547 | SIRT7 | P80T-E | Human | Esophagus | ESCC | 5.45e-31 | 7.57e-01 | 0.155 |
| 51547 | SIRT7 | P82T-E | Human | Esophagus | ESCC | 7.68e-13 | 5.20e-01 | 0.1072 |
| 51547 | SIRT7 | P83T-E | Human | Esophagus | ESCC | 1.07e-38 | 8.60e-01 | 0.1738 |
| 51547 | SIRT7 | P84T-E | Human | Esophagus | ESCC | 1.53e-04 | 3.31e-01 | 0.0933 |
| 51547 | SIRT7 | P89T-E | Human | Esophagus | ESCC | 6.02e-11 | 5.62e-01 | 0.1752 |
| 51547 | SIRT7 | P91T-E | Human | Esophagus | ESCC | 8.98e-12 | 9.57e-01 | 0.1828 |
| 51547 | SIRT7 | P94T-E | Human | Esophagus | ESCC | 4.82e-07 | 6.67e-01 | 0.0879 |
| 51547 | SIRT7 | P104T-E | Human | Esophagus | ESCC | 6.77e-17 | 7.80e-01 | 0.0931 |
| 51547 | SIRT7 | P107T-E | Human | Esophagus | ESCC | 3.73e-26 | 5.01e-01 | 0.171 |
| 51547 | SIRT7 | P126T-E | Human | Esophagus | ESCC | 3.61e-06 | 7.09e-01 | 0.1125 |
| 51547 | SIRT7 | P127T-E | Human | Esophagus | ESCC | 3.64e-20 | 3.64e-01 | 0.0826 |
| 51547 | SIRT7 | P128T-E | Human | Esophagus | ESCC | 2.30e-48 | 1.24e+00 | 0.1241 |
| 51547 | SIRT7 | P130T-E | Human | Esophagus | ESCC | 3.99e-59 | 1.02e+00 | 0.1676 |
| 51547 | SIRT7 | HCC1_Meng | Human | Liver | HCC | 4.90e-51 | 9.14e-02 | 0.0246 |
| 51547 | SIRT7 | HCC2_Meng | Human | Liver | HCC | 2.01e-41 | 2.58e-01 | 0.0107 |
| 51547 | SIRT7 | cirrhotic1 | Human | Liver | Cirrhotic | 1.47e-11 | 1.62e-01 | 0.0202 |
| 51547 | SIRT7 | cirrhotic2 | Human | Liver | Cirrhotic | 7.37e-04 | 1.10e-01 | 0.0201 |
| 51547 | SIRT7 | cirrhotic3 | Human | Liver | Cirrhotic | 9.07e-05 | 9.74e-02 | 0.0215 |
| Page: 1 2 3 4 5 6 7 |
| Tissue | Expression Dynamics | Abbreviation |
| Colorectum (GSE201348) |  | FAP: Familial adenomatous polyposis |
| CRC: Colorectal cancer | ||
| Colorectum (HTA11) |  | AD: Adenomas |
| SER: Sessile serrated lesions | ||
| MSI-H: Microsatellite-high colorectal cancer | ||
| MSS: Microsatellite stable colorectal cancer | ||
| Esophagus | 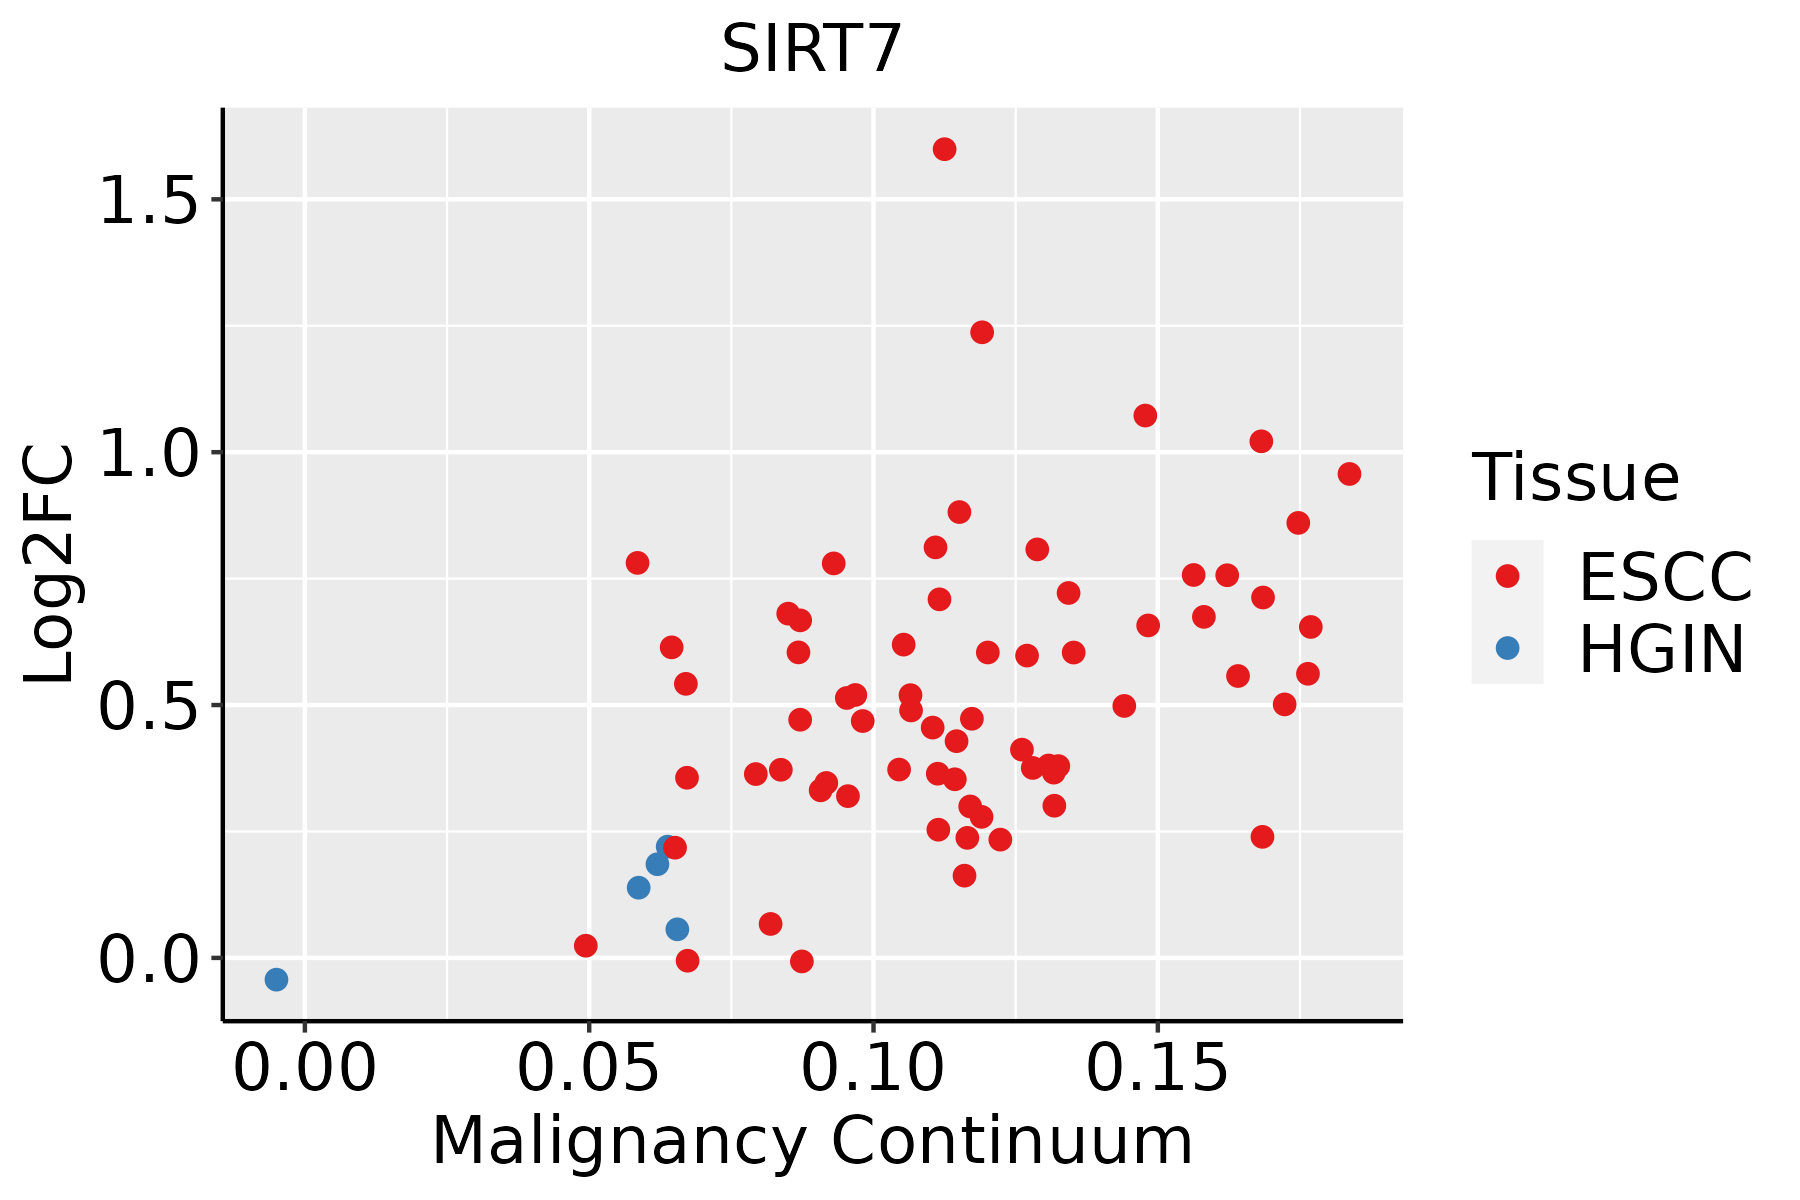 | ESCC: Esophageal squamous cell carcinoma |
| HGIN: High-grade intraepithelial neoplasias | ||
| LGIN: Low-grade intraepithelial neoplasias | ||
| Liver | 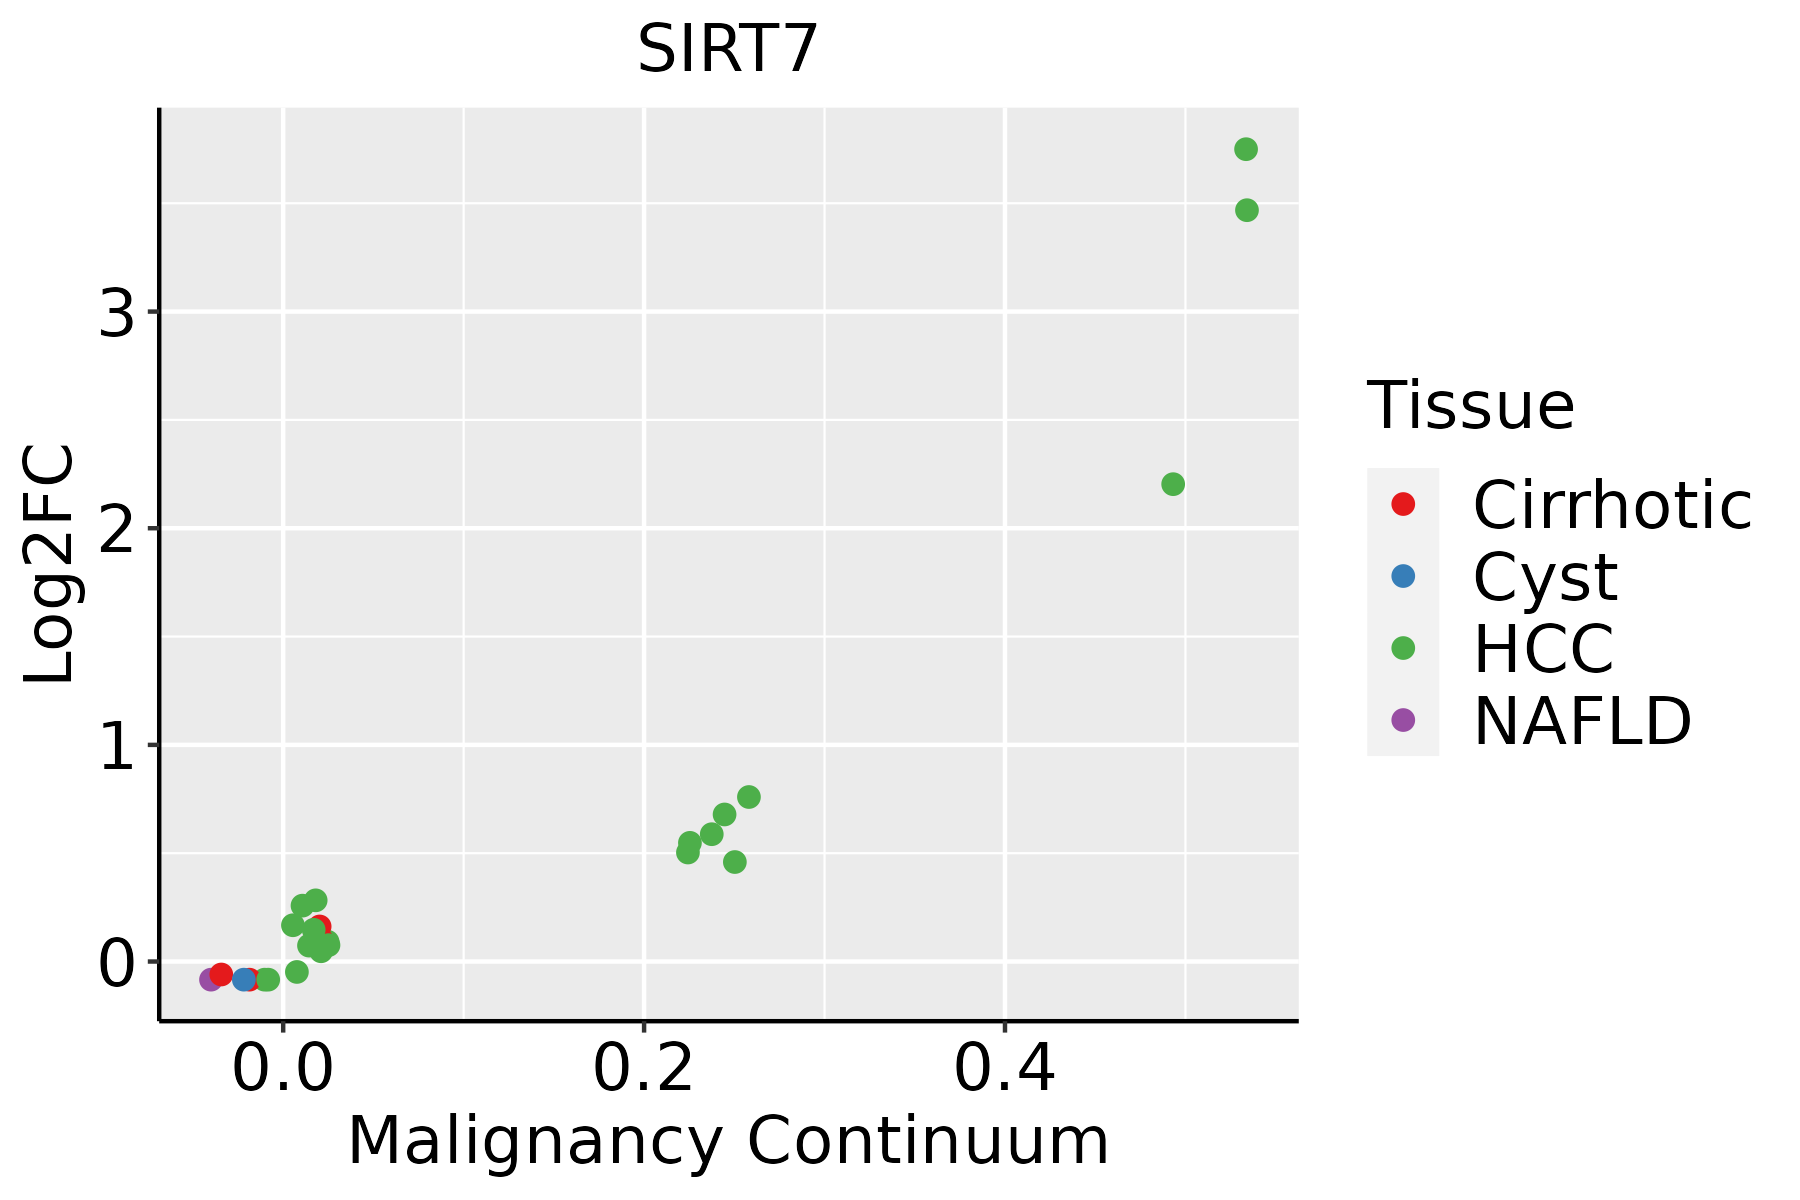 | HCC: Hepatocellular carcinoma |
| NAFLD: Non-alcoholic fatty liver disease | ||
| Oral Cavity | 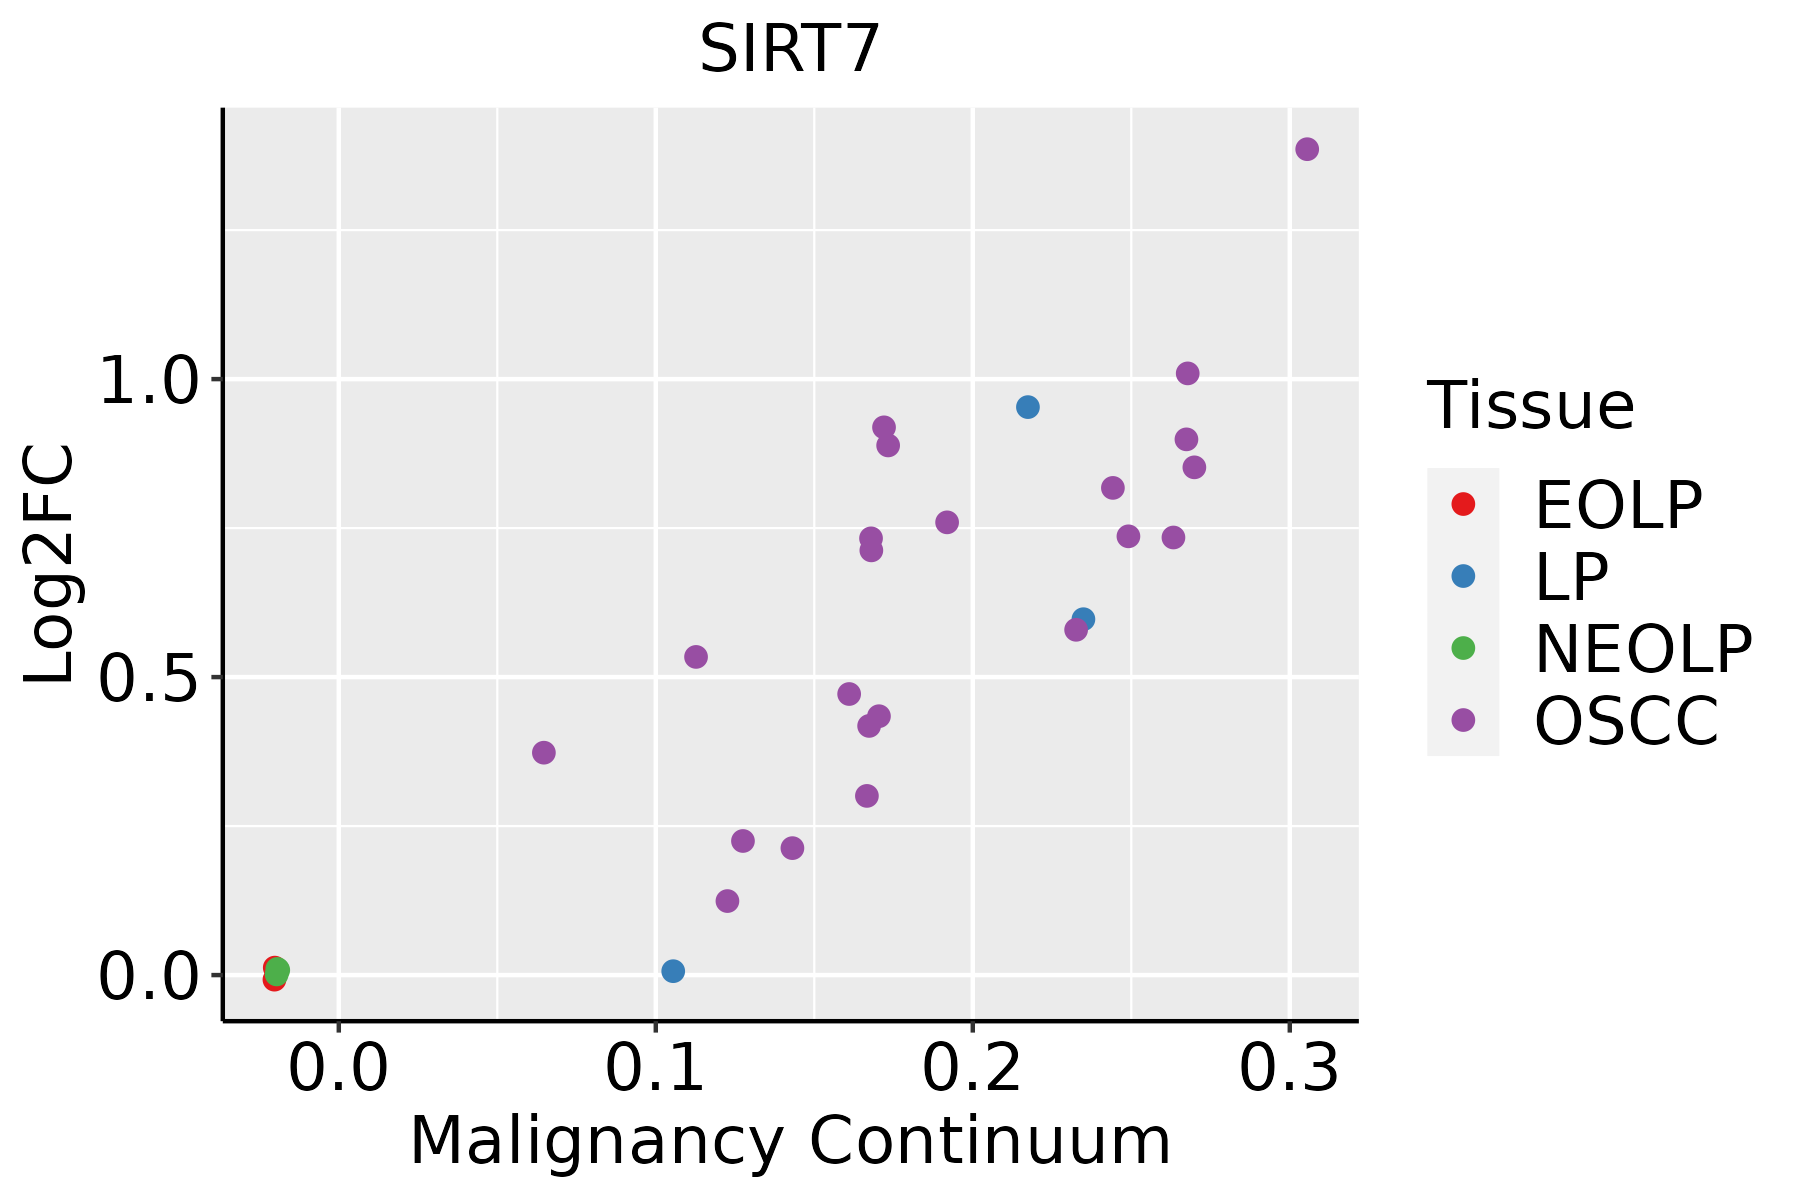 | EOLP: Erosive Oral lichen planus |
| LP: leukoplakia | ||
| NEOLP: Non-erosive oral lichen planus | ||
| OSCC: Oral squamous cell carcinoma | ||
| Skin | 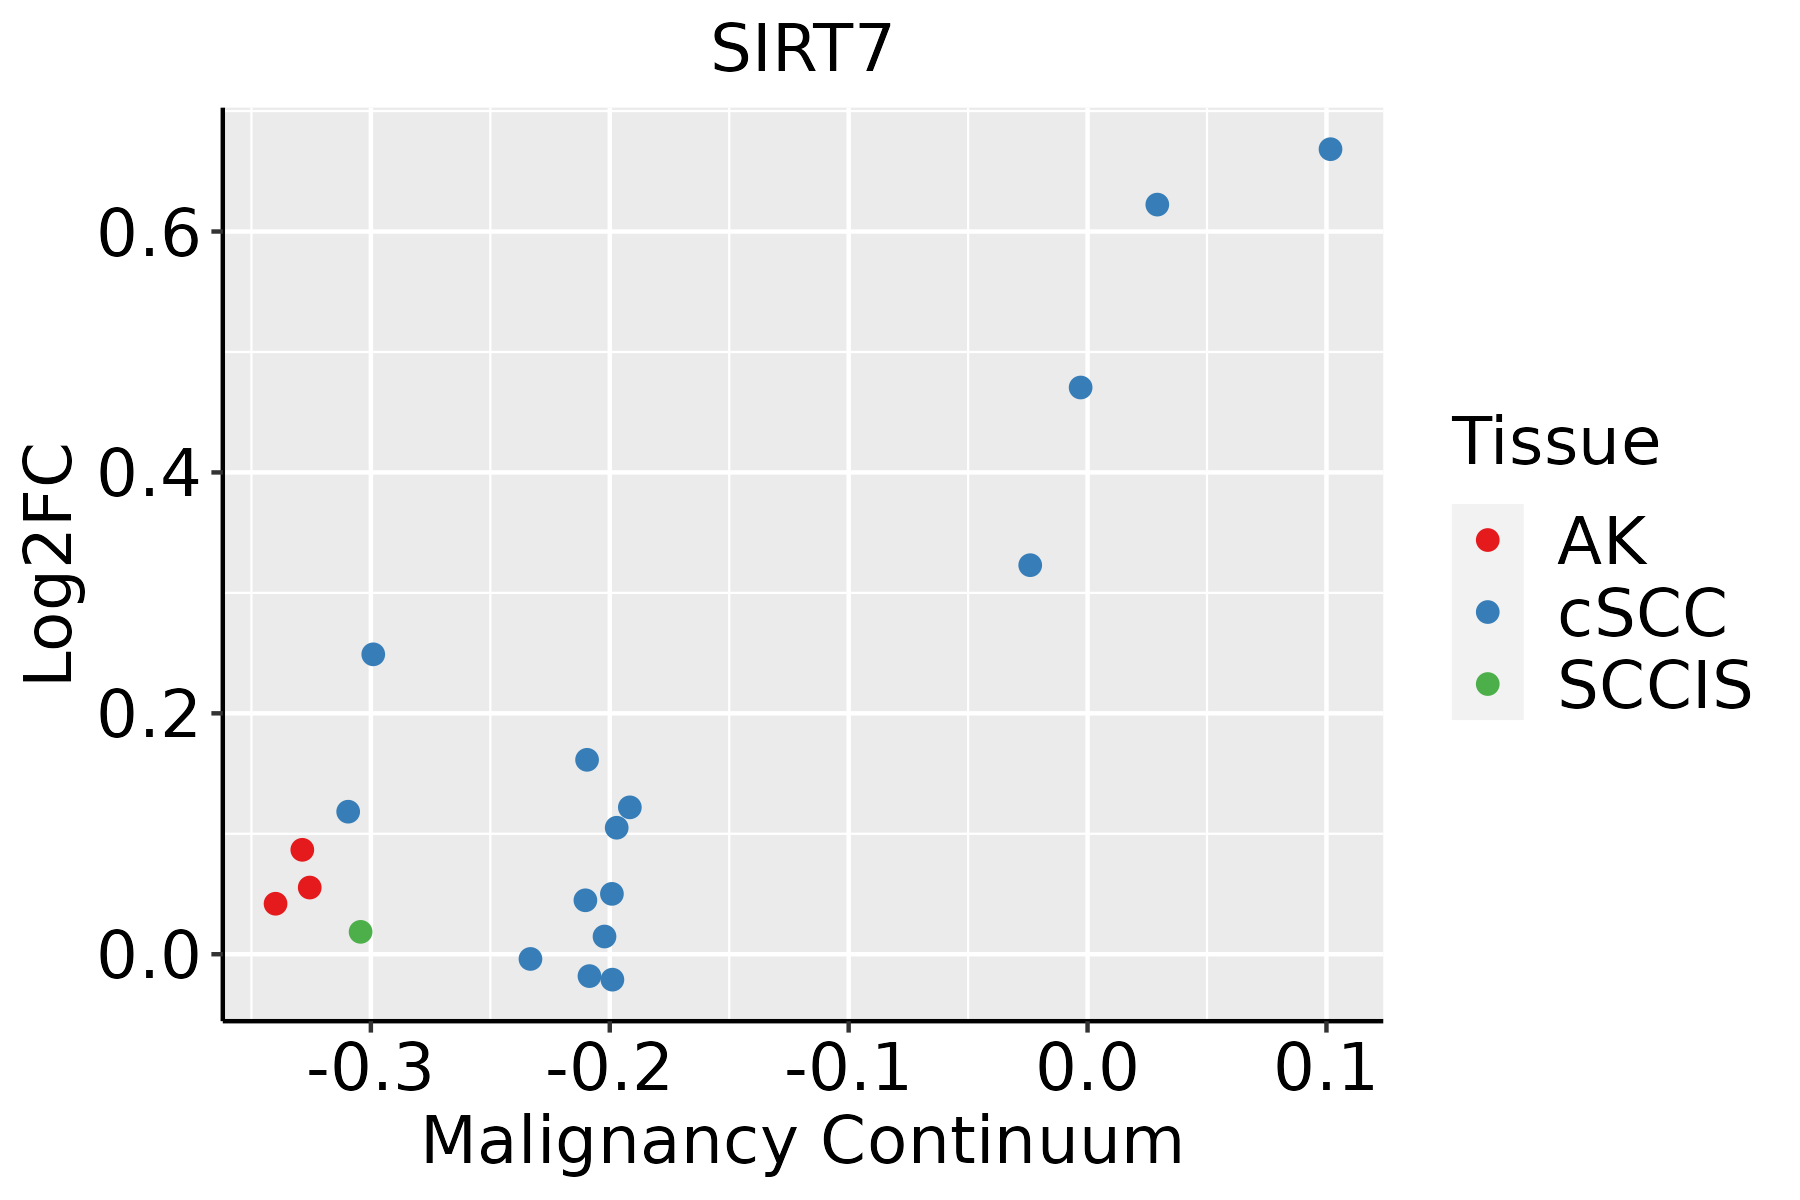 | AK: Actinic keratosis |
| cSCC: Cutaneous squamous cell carcinoma | ||
| SCCIS:squamous cell carcinoma in situ | ||
| Thyroid |  | ATC: Anaplastic thyroid cancer |
| HT: Hashimoto's thyroiditis | ||
| PTC: Papillary thyroid cancer |
| ∗log2FC in expression of this searched gene in stem-like cells from each diseased tissue sample relative to stem-like cells in normal samples in each tissue plotted against the malignancy continuum. Samples are colored based on if they are from different disease stage. |
Top |
Malignant transformation related pathway analysis |
| Find out the enriched GO biological processes and KEGG pathways involved in transition from healthy to precancer to cancer |
| Tissue | Disease Stage | Enriched GO biological Processes |
| Colorectum | AD |  |
| Colorectum | SER |  |
| Colorectum | MSS |  |
| Colorectum | MSI-H |  |
| Colorectum | FAP |  |
| ∗Top 15 enriched GO BP terms are showed in the bar plot of each disease state in each tissue. Each row represents a significant GO biological process which is colored according to the -log10(p.adjust). |
| Page: 1 2 3 4 5 6 7 8 9 |
| GO ID | Tissue | Disease Stage | Description | Gene Ratio | Bg Ratio | pvalue | p.adjust | Count |
| GO:0022613 | Colorectum | AD | ribonucleoprotein complex biogenesis | 151/3918 | 463/18723 | 1.96e-09 | 1.39e-07 | 151 |
| GO:1903320 | Colorectum | AD | regulation of protein modification by small protein conjugation or removal | 86/3918 | 242/18723 | 9.43e-08 | 4.65e-06 | 86 |
| GO:0006913 | Colorectum | AD | nucleocytoplasmic transport | 102/3918 | 301/18723 | 1.00e-07 | 4.85e-06 | 102 |
| GO:0051169 | Colorectum | AD | nuclear transport | 102/3918 | 301/18723 | 1.00e-07 | 4.85e-06 | 102 |
| GO:0010821 | Colorectum | AD | regulation of mitochondrion organization | 57/3918 | 144/18723 | 2.43e-07 | 9.92e-06 | 57 |
| GO:0051052 | Colorectum | AD | regulation of DNA metabolic process | 116/3918 | 359/18723 | 2.47e-07 | 1.00e-05 | 116 |
| GO:0032386 | Colorectum | AD | regulation of intracellular transport | 109/3918 | 337/18723 | 5.33e-07 | 1.95e-05 | 109 |
| GO:0033157 | Colorectum | AD | regulation of intracellular protein transport | 80/3918 | 229/18723 | 5.81e-07 | 2.09e-05 | 80 |
| GO:0031396 | Colorectum | AD | regulation of protein ubiquitination | 72/3918 | 210/18723 | 4.50e-06 | 1.21e-04 | 72 |
| GO:0019318 | Colorectum | AD | hexose metabolic process | 77/3918 | 237/18723 | 1.96e-05 | 4.01e-04 | 77 |
| GO:0046822 | Colorectum | AD | regulation of nucleocytoplasmic transport | 41/3918 | 106/18723 | 2.17e-05 | 4.33e-04 | 41 |
| GO:0031397 | Colorectum | AD | negative regulation of protein ubiquitination | 34/3918 | 83/18723 | 2.66e-05 | 5.04e-04 | 34 |
| GO:2001020 | Colorectum | AD | regulation of response to DNA damage stimulus | 71/3918 | 219/18723 | 4.38e-05 | 7.65e-04 | 71 |
| GO:1903321 | Colorectum | AD | negative regulation of protein modification by small protein conjugation or removal | 37/3918 | 95/18723 | 4.49e-05 | 7.83e-04 | 37 |
| GO:0044262 | Colorectum | AD | cellular carbohydrate metabolic process | 87/3918 | 283/18723 | 6.00e-05 | 1.01e-03 | 87 |
| GO:0051168 | Colorectum | AD | nuclear export | 53/3918 | 154/18723 | 6.89e-05 | 1.11e-03 | 53 |
| GO:0005996 | Colorectum | AD | monosaccharide metabolic process | 80/3918 | 257/18723 | 7.31e-05 | 1.17e-03 | 80 |
| GO:0006006 | Colorectum | AD | glucose metabolic process | 62/3918 | 196/18723 | 2.76e-04 | 3.39e-03 | 62 |
| GO:0001649 | Colorectum | AD | osteoblast differentiation | 70/3918 | 229/18723 | 3.59e-04 | 4.18e-03 | 70 |
| GO:0006611 | Colorectum | AD | protein export from nucleus | 23/3918 | 57/18723 | 6.62e-04 | 6.80e-03 | 23 |
| Page: 1 2 3 4 5 6 7 8 9 10 11 12 13 14 15 16 17 18 19 20 21 22 23 24 25 26 27 |
| Pathway ID | Tissue | Disease Stage | Description | Gene Ratio | Bg Ratio | pvalue | p.adjust | qvalue | Count |
| Page: 1 |
Top |
Cell-cell communication analysis |
| Identification of potential cell-cell interactions between two cell types and their ligand-receptor pairs for different disease states |
| Ligand | Receptor | LRpair | Pathway | Tissue | Disease Stage |
| Page: 1 |
Top |
Single-cell gene regulatory network inference analysis |
| Find out the significant the regulons (TFs) and the target genes of each regulon across cell types for different disease states |
| TF | Cell Type | Tissue | Disease Stage | Target Gene | RSS | Regulon Activity |
| ∗The dot plots of a searched regulon are shown for all cell subpopulations in each disease state of each tissue based on the regulon specific score inferred using pySCENIC and by calculating the average expression. |
| Page: 1 |
Top |
Somatic mutation of malignant transformation related genes |
| Annotation of somatic variants for genes involved in malignant transformation |
| Hugo Symbol | Variant Class | Variant Classification | dbSNP RS | HGVSc | HGVSp | HGVSp Short | SWISSPROT | BIOTYPE | SIFT | PolyPhen | Tumor Sample Barcode | Tissue | Histology | Sex | Age | Stage | Therapy Types | Drugs | Outcome |
| SIRT7 | SNV | Missense_Mutation | c.1076C>G | p.Ser359Trp | p.S359W | Q9NRC8 | protein_coding | tolerated(0.18) | possibly_damaging(0.652) | TCGA-AR-A24Q-01 | Breast | breast invasive carcinoma | Female | <65 | I/II | Chemotherapy | doxorubicin | SD | |
| SIRT7 | SNV | Missense_Mutation | c.1191N>C | p.Lys397Asn | p.K397N | Q9NRC8 | protein_coding | deleterious_low_confidence(0) | benign(0.092) | TCGA-EK-A2PG-01 | Cervix | cervical & endocervical cancer | Female | >=65 | I/II | Unknown | Unknown | SD | |
| SIRT7 | SNV | Missense_Mutation | novel | c.710T>C | p.Val237Ala | p.V237A | Q9NRC8 | protein_coding | deleterious(0) | probably_damaging(0.999) | TCGA-MA-AA42-01 | Cervix | cervical & endocervical cancer | Female | >=65 | I/II | Unknown | Unknown | SD |
| SIRT7 | SNV | Missense_Mutation | rs781471662 | c.1042C>T | p.Arg348Cys | p.R348C | Q9NRC8 | protein_coding | tolerated(0.06) | benign(0.007) | TCGA-AA-A01R-01 | Colorectum | colon adenocarcinoma | Male | <65 | III/IV | Chemotherapy | 5-fluorouracil | PD |
| SIRT7 | SNV | Missense_Mutation | rs757485586 | c.1043G>A | p.Arg348His | p.R348H | Q9NRC8 | protein_coding | tolerated(0.09) | benign(0.018) | TCGA-AZ-4313-01 | Colorectum | colon adenocarcinoma | Female | <65 | I/II | Unknown | Unknown | SD |
| SIRT7 | SNV | Missense_Mutation | novel | c.1185N>C | p.Lys395Asn | p.K395N | Q9NRC8 | protein_coding | deleterious_low_confidence(0.01) | benign(0.436) | TCGA-CA-6717-01 | Colorectum | colon adenocarcinoma | Male | <65 | I/II | Chemotherapy | oxaliplatin | CR |
| SIRT7 | SNV | Missense_Mutation | rs200982525 | c.952G>A | p.Val318Ile | p.V318I | Q9NRC8 | protein_coding | deleterious(0.03) | possibly_damaging(0.459) | TCGA-CM-5861-01 | Colorectum | colon adenocarcinoma | Female | <65 | I/II | Unknown | Unknown | PD |
| SIRT7 | SNV | Missense_Mutation | rs190336639 | c.994N>A | p.Ala332Thr | p.A332T | Q9NRC8 | protein_coding | tolerated(0.56) | benign(0.001) | TCGA-DM-A1HB-01 | Colorectum | colon adenocarcinoma | Male | >=65 | III/IV | Unknown | Unknown | SD |
| SIRT7 | SNV | Missense_Mutation | rs747584480 | c.1031N>T | p.Ala344Val | p.A344V | Q9NRC8 | protein_coding | deleterious(0.02) | benign(0.352) | TCGA-AP-A059-01 | Endometrium | uterine corpus endometrioid carcinoma | Female | >=65 | I/II | Unknown | Unknown | SD |
| SIRT7 | SNV | Missense_Mutation | c.941A>C | p.Lys314Thr | p.K314T | Q9NRC8 | protein_coding | deleterious(0) | benign(0.265) | TCGA-AP-A0LM-01 | Endometrium | uterine corpus endometrioid carcinoma | Female | <65 | III/IV | Chemotherapy | cisplatin | SD |
| Page: 1 2 3 4 |
Top |
Related drugs of malignant transformation related genes |
| Identification of chemicals and drugs interact with genes involved in malignant transfromation |
| (DGIdb 4.0) |
| Entrez ID | Symbol | Category | Interaction Types | Drug Claim Name | Drug Name | PMIDs |
| Page: 1 |

Copyright 2023-Present -The University of Texas Health Science Center at Houston |