| Tissue | Expression Dynamics | Abbreviation |
| Cervix | 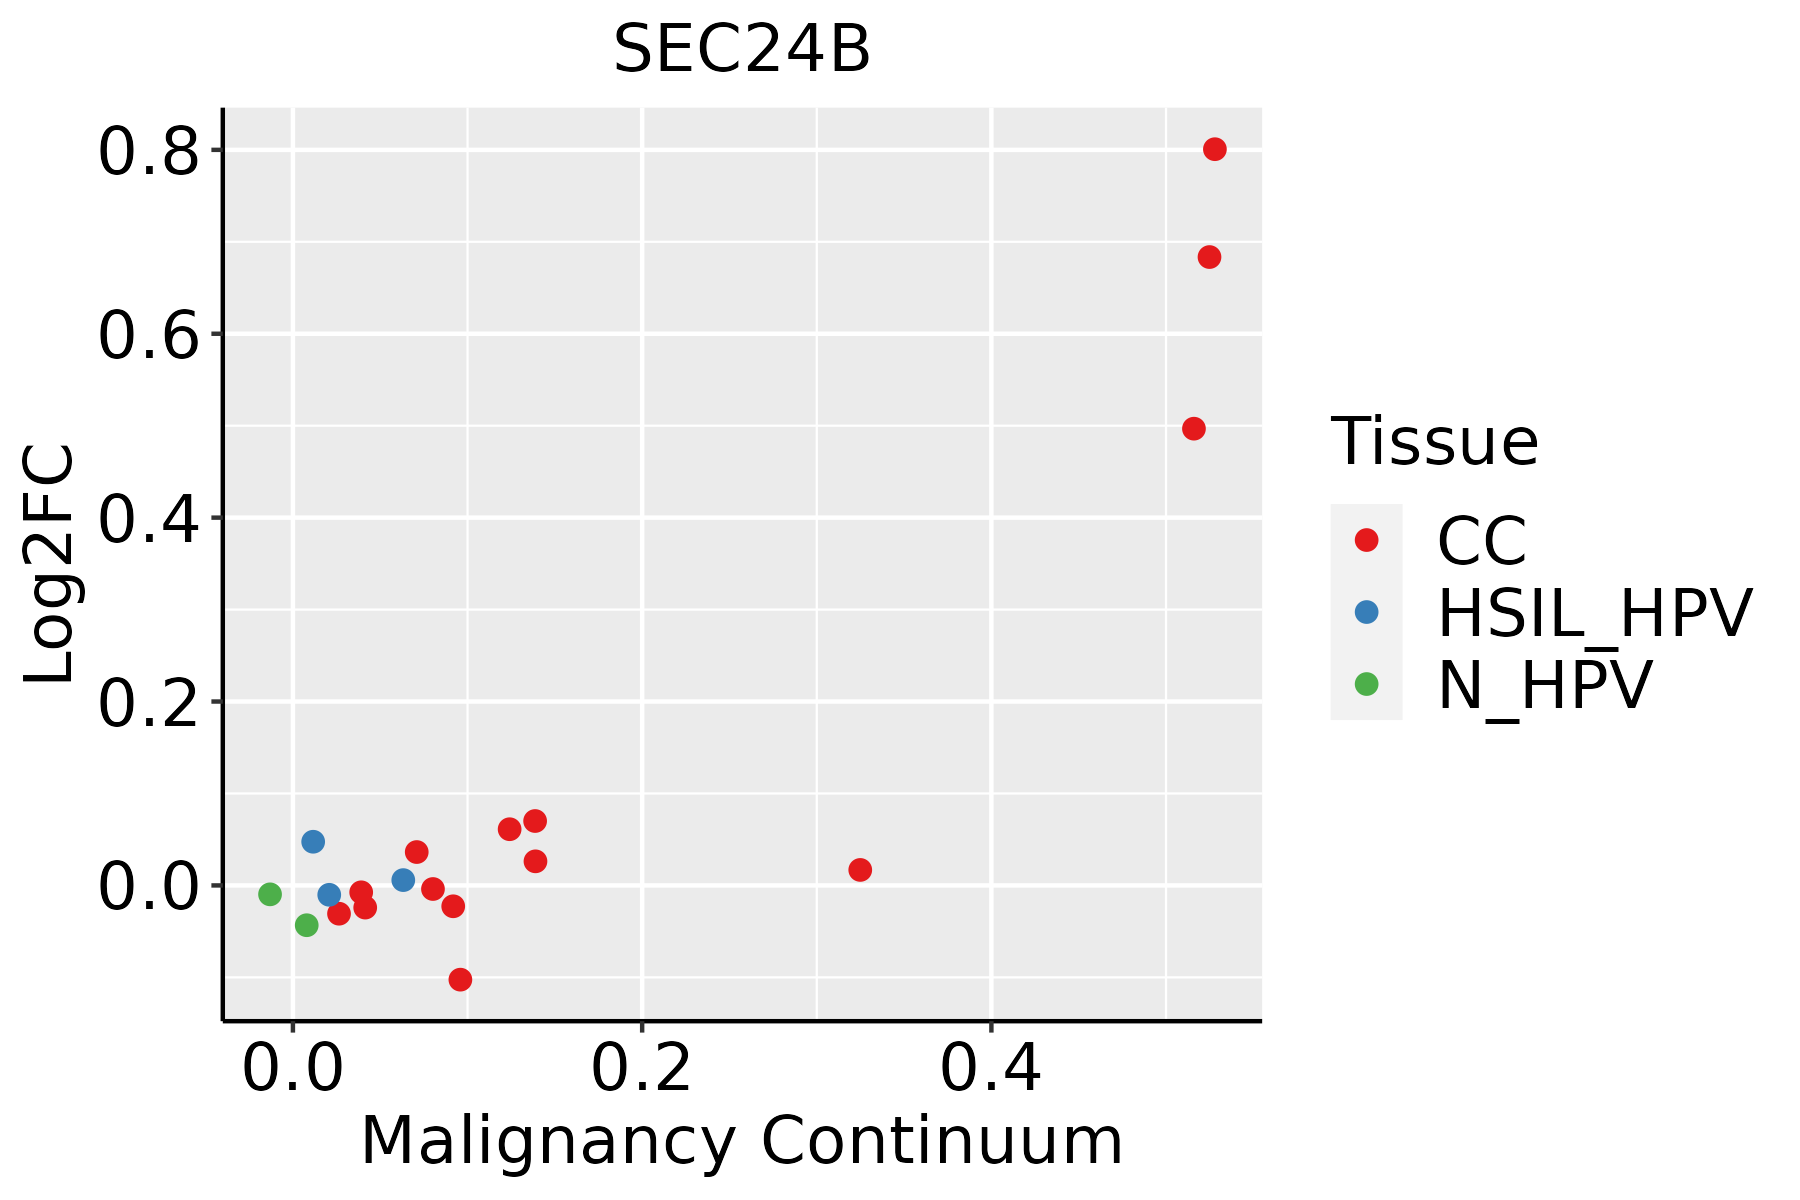 | CC: Cervix cancer |
| HSIL_HPV: HPV-infected high-grade squamous intraepithelial lesions |
| N_HPV: HPV-infected normal cervix |
| Colorectum (GSE201348) |  | FAP: Familial adenomatous polyposis |
| CRC: Colorectal cancer |
| Colorectum (HTA11) |  | AD: Adenomas |
| SER: Sessile serrated lesions |
| MSI-H: Microsatellite-high colorectal cancer |
| MSS: Microsatellite stable colorectal cancer |
| Esophagus | 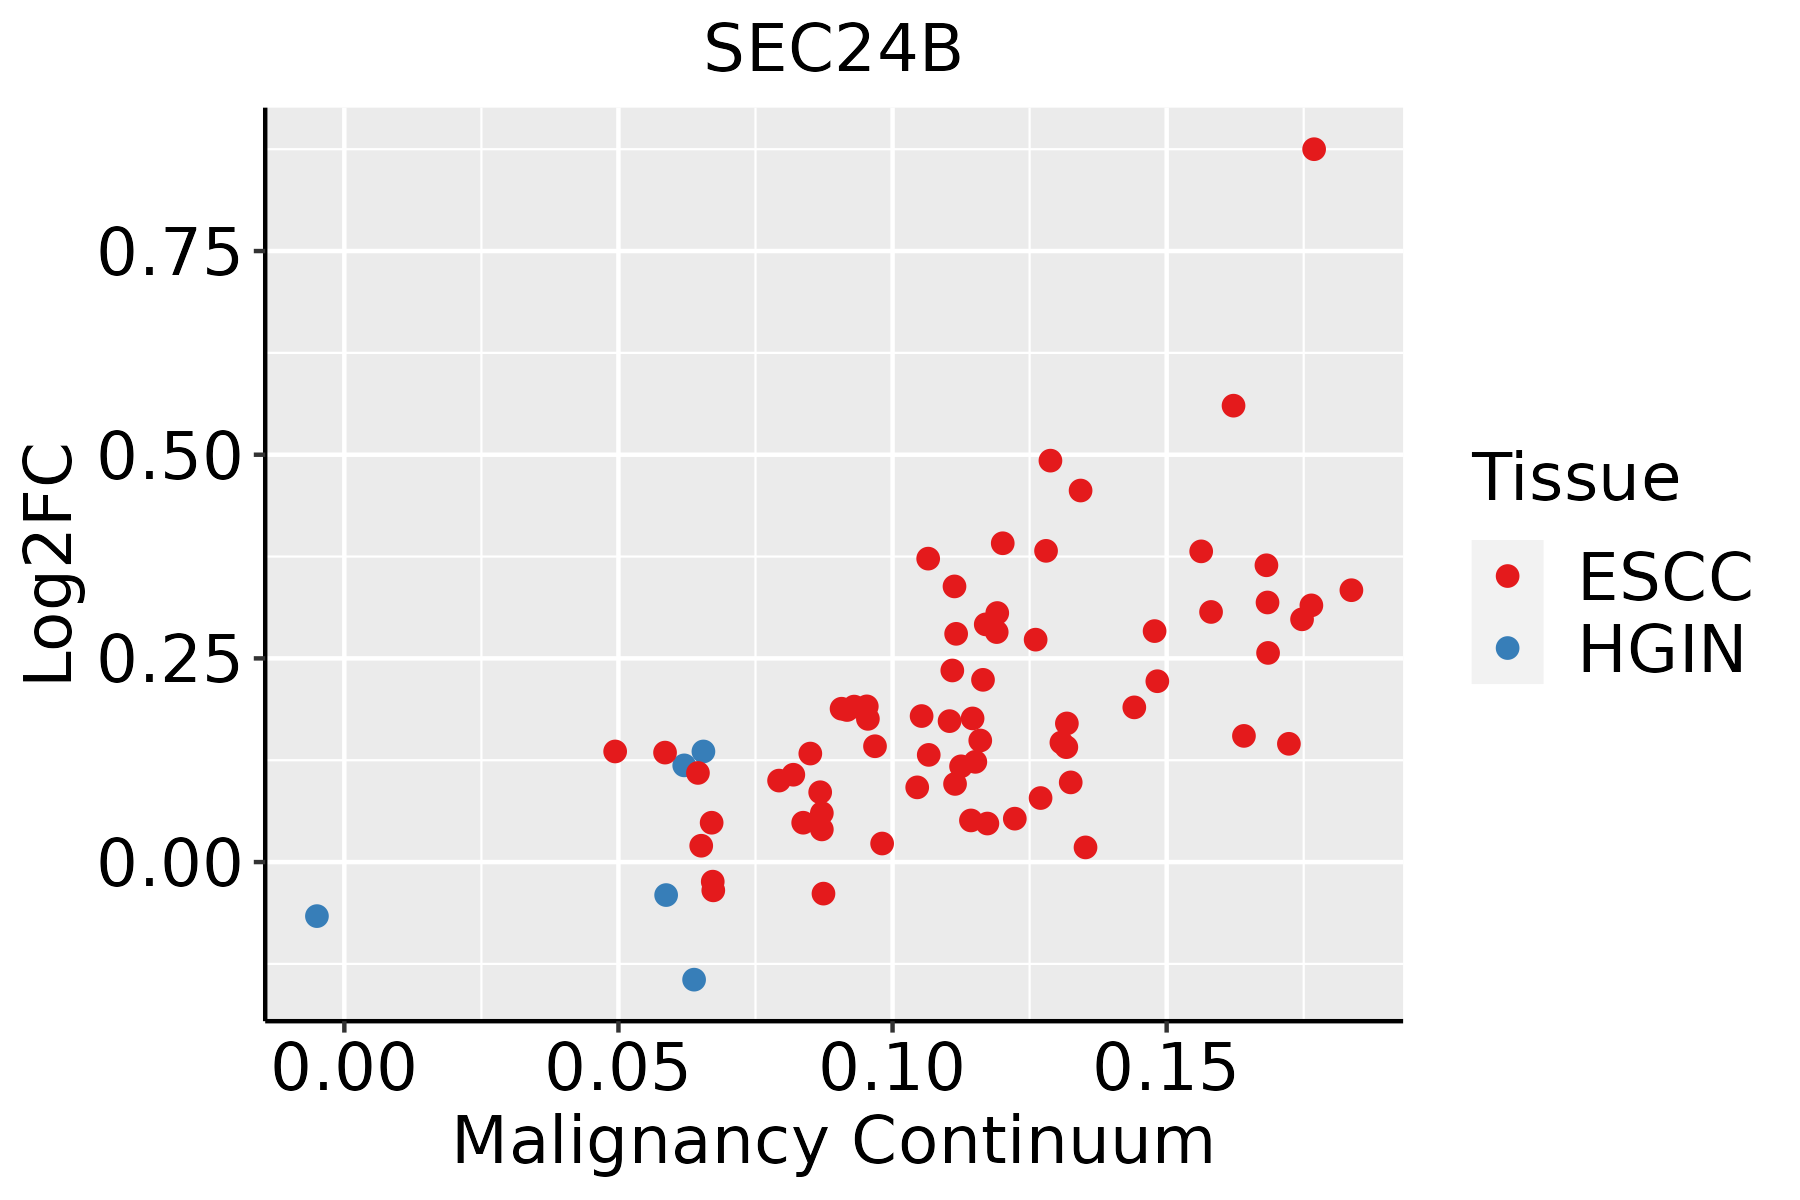 | ESCC: Esophageal squamous cell carcinoma |
| HGIN: High-grade intraepithelial neoplasias |
| LGIN: Low-grade intraepithelial neoplasias |
| Liver |  | HCC: Hepatocellular carcinoma |
| NAFLD: Non-alcoholic fatty liver disease |
| Prostate |  | BPH: Benign Prostatic Hyperplasia |
| GO ID | Tissue | Disease Stage | Description | Gene Ratio | Bg Ratio | pvalue | p.adjust | Count |
| GO:00085446 | Cervix | CC | epidermis development | 83/2311 | 324/18723 | 3.91e-11 | 8.54e-09 | 83 |
| GO:00099137 | Cervix | CC | epidermal cell differentiation | 53/2311 | 202/18723 | 5.48e-08 | 3.25e-06 | 53 |
| GO:00323868 | Cervix | CC | regulation of intracellular transport | 71/2311 | 337/18723 | 3.70e-06 | 9.74e-05 | 71 |
| GO:000690010 | Cervix | CC | vesicle budding from membrane | 20/2311 | 61/18723 | 2.50e-05 | 4.28e-04 | 20 |
| GO:00481938 | Cervix | CC | Golgi vesicle transport | 58/2311 | 296/18723 | 2.24e-04 | 2.54e-03 | 58 |
| GO:000206410 | Cervix | CC | epithelial cell development | 45/2311 | 220/18723 | 4.14e-04 | 4.21e-03 | 45 |
| GO:00488579 | Cervix | CC | neural nucleus development | 18/2311 | 64/18723 | 5.42e-04 | 5.23e-03 | 18 |
| GO:00604253 | Cervix | CC | lung morphogenesis | 15/2311 | 50/18723 | 7.36e-04 | 6.60e-03 | 15 |
| GO:00303245 | Cervix | CC | lung development | 36/2311 | 177/18723 | 1.64e-03 | 1.26e-02 | 36 |
| GO:00351487 | Cervix | CC | tube formation | 31/2311 | 148/18723 | 2.07e-03 | 1.51e-02 | 31 |
| GO:00017384 | Cervix | CC | morphogenesis of a polarized epithelium | 22/2311 | 94/18723 | 2.09e-03 | 1.52e-02 | 22 |
| GO:00303235 | Cervix | CC | respiratory tube development | 36/2311 | 181/18723 | 2.46e-03 | 1.71e-02 | 36 |
| GO:00160506 | Cervix | CC | vesicle organization | 54/2311 | 300/18723 | 2.71e-03 | 1.85e-02 | 54 |
| GO:00018417 | Cervix | CC | neural tube formation | 23/2311 | 102/18723 | 2.80e-03 | 1.87e-02 | 23 |
| GO:00605413 | Cervix | CC | respiratory system development | 39/2311 | 203/18723 | 3.18e-03 | 2.07e-02 | 39 |
| GO:00605626 | Cervix | CC | epithelial tube morphogenesis | 57/2311 | 325/18723 | 3.79e-03 | 2.41e-02 | 57 |
| GO:00140206 | Cervix | CC | primary neural tube formation | 21/2311 | 94/18723 | 4.68e-03 | 2.82e-02 | 21 |
| GO:00219156 | Cervix | CC | neural tube development | 30/2311 | 152/18723 | 6.00e-03 | 3.43e-02 | 30 |
| GO:00901752 | Cervix | CC | regulation of establishment of planar polarity | 14/2311 | 56/18723 | 6.93e-03 | 3.74e-02 | 14 |
| GO:00018435 | Cervix | CC | neural tube closure | 19/2311 | 88/18723 | 1.01e-02 | 4.91e-02 | 19 |
| Pathway ID | Tissue | Disease Stage | Description | Gene Ratio | Bg Ratio | pvalue | p.adjust | qvalue | Count |
| hsa0513020 | Cervix | CC | Pathogenic Escherichia coli infection | 63/1267 | 197/8465 | 9.28e-10 | 2.00e-08 | 1.19e-08 | 63 |
| hsa0414120 | Cervix | CC | Protein processing in endoplasmic reticulum | 55/1267 | 174/8465 | 1.74e-08 | 2.68e-07 | 1.58e-07 | 55 |
| hsa05130110 | Cervix | CC | Pathogenic Escherichia coli infection | 63/1267 | 197/8465 | 9.28e-10 | 2.00e-08 | 1.19e-08 | 63 |
| hsa04141110 | Cervix | CC | Protein processing in endoplasmic reticulum | 55/1267 | 174/8465 | 1.74e-08 | 2.68e-07 | 1.58e-07 | 55 |
| hsa04141 | Colorectum | AD | Protein processing in endoplasmic reticulum | 80/2092 | 174/8465 | 5.96e-10 | 1.25e-08 | 7.96e-09 | 80 |
| hsa05130 | Colorectum | AD | Pathogenic Escherichia coli infection | 79/2092 | 197/8465 | 1.05e-06 | 1.36e-05 | 8.65e-06 | 79 |
| hsa041411 | Colorectum | AD | Protein processing in endoplasmic reticulum | 80/2092 | 174/8465 | 5.96e-10 | 1.25e-08 | 7.96e-09 | 80 |
| hsa051301 | Colorectum | AD | Pathogenic Escherichia coli infection | 79/2092 | 197/8465 | 1.05e-06 | 1.36e-05 | 8.65e-06 | 79 |
| hsa041412 | Colorectum | SER | Protein processing in endoplasmic reticulum | 60/1580 | 174/8465 | 4.20e-07 | 7.33e-06 | 5.32e-06 | 60 |
| hsa051302 | Colorectum | SER | Pathogenic Escherichia coli infection | 60/1580 | 197/8465 | 3.63e-05 | 4.31e-04 | 3.13e-04 | 60 |
| hsa041413 | Colorectum | SER | Protein processing in endoplasmic reticulum | 60/1580 | 174/8465 | 4.20e-07 | 7.33e-06 | 5.32e-06 | 60 |
| hsa051303 | Colorectum | SER | Pathogenic Escherichia coli infection | 60/1580 | 197/8465 | 3.63e-05 | 4.31e-04 | 3.13e-04 | 60 |
| hsa041414 | Colorectum | MSS | Protein processing in endoplasmic reticulum | 75/1875 | 174/8465 | 3.78e-10 | 8.44e-09 | 5.17e-09 | 75 |
| hsa051304 | Colorectum | MSS | Pathogenic Escherichia coli infection | 73/1875 | 197/8465 | 1.10e-06 | 1.48e-05 | 9.06e-06 | 73 |
| hsa041415 | Colorectum | MSS | Protein processing in endoplasmic reticulum | 75/1875 | 174/8465 | 3.78e-10 | 8.44e-09 | 5.17e-09 | 75 |
| hsa051305 | Colorectum | MSS | Pathogenic Escherichia coli infection | 73/1875 | 197/8465 | 1.10e-06 | 1.48e-05 | 9.06e-06 | 73 |
| hsa051308 | Colorectum | FAP | Pathogenic Escherichia coli infection | 62/1404 | 197/8465 | 1.37e-07 | 3.08e-06 | 1.87e-06 | 62 |
| hsa041418 | Colorectum | FAP | Protein processing in endoplasmic reticulum | 50/1404 | 174/8465 | 3.64e-05 | 3.68e-04 | 2.24e-04 | 50 |
| hsa051309 | Colorectum | FAP | Pathogenic Escherichia coli infection | 62/1404 | 197/8465 | 1.37e-07 | 3.08e-06 | 1.87e-06 | 62 |
| hsa041419 | Colorectum | FAP | Protein processing in endoplasmic reticulum | 50/1404 | 174/8465 | 3.64e-05 | 3.68e-04 | 2.24e-04 | 50 |
| Hugo Symbol | Variant Class | Variant Classification | dbSNP RS | HGVSc | HGVSp | HGVSp Short | SWISSPROT | BIOTYPE | SIFT | PolyPhen | Tumor Sample Barcode | Tissue | Histology | Sex | Age | Stage | Therapy Types | Drugs | Outcome |
| SEC24B | SNV | Missense_Mutation | | c.774N>A | p.Phe258Leu | p.F258L | O95487 | protein_coding | tolerated_low_confidence(0.28) | benign(0.079) | TCGA-A7-A26F-01 | Breast | breast invasive carcinoma | Female | <65 | I/II | Chemotherapy | taxotere | SD |
| SEC24B | SNV | Missense_Mutation | novel | c.1234N>C | p.Glu412Gln | p.E412Q | O95487 | protein_coding | deleterious_low_confidence(0.02) | benign(0.036) | TCGA-A8-A08R-01 | Breast | breast invasive carcinoma | Female | <65 | I/II | Unknown | Unknown | SD |
| SEC24B | SNV | Missense_Mutation | novel | c.3604N>T | p.Gly1202Trp | p.G1202W | O95487 | protein_coding | deleterious(0) | probably_damaging(1) | TCGA-AC-A3W5-01 | Breast | breast invasive carcinoma | Female | >=65 | I/II | Chemotherapy | docetaxel | CR |
| SEC24B | SNV | Missense_Mutation | novel | c.3530A>C | p.Lys1177Thr | p.K1177T | O95487 | protein_coding | tolerated(0.06) | benign(0.19) | TCGA-AN-A046-01 | Breast | breast invasive carcinoma | Female | >=65 | I/II | Unknown | Unknown | SD |
| SEC24B | SNV | Missense_Mutation | | c.2509N>G | p.Arg837Gly | p.R837G | O95487 | protein_coding | deleterious(0) | probably_damaging(1) | TCGA-BH-A0B1-01 | Breast | breast invasive carcinoma | Female | >=65 | I/II | Chemotherapy | adriamycin | SD |
| SEC24B | SNV | Missense_Mutation | | c.982N>G | p.Leu328Val | p.L328V | O95487 | protein_coding | tolerated_low_confidence(0.55) | benign(0.023) | TCGA-BH-A0H7-01 | Breast | breast invasive carcinoma | Female | >=65 | III/IV | Chemotherapy | doxorubicin | SD |
| SEC24B | SNV | Missense_Mutation | | c.2378N>G | p.Tyr793Cys | p.Y793C | O95487 | protein_coding | tolerated(0.08) | possibly_damaging(0.779) | TCGA-BH-A0HA-01 | Breast | breast invasive carcinoma | Female | <65 | I/II | Unknown | Unknown | SD |
| SEC24B | insertion | Nonsense_Mutation | novel | c.1460_1461insCTGCCACGATGCCTGGGTAGTTTTTTTGTATTTTTAG | p.Lys488CysfsTer12 | p.K488Cfs*12 | O95487 | protein_coding | | | TCGA-A8-A09E-01 | Breast | breast invasive carcinoma | Female | >=65 | III/IV | Hormone Therapy | anastrozole | SD |
| SEC24B | insertion | Frame_Shift_Ins | novel | c.668_669insAT | p.Tyr224CysfsTer69 | p.Y224Cfs*69 | O95487 | protein_coding | | | TCGA-BH-A0AY-01 | Breast | breast invasive carcinoma | Female | <65 | I/II | Chemotherapy | | SD |
| SEC24B | insertion | Nonsense_Mutation | novel | c.670_671insAATGGAATACTATTCAGACATTAAAAATAATGATGGAAAG | p.Tyr224Ter | p.Y224* | O95487 | protein_coding | | | TCGA-BH-A0AY-01 | Breast | breast invasive carcinoma | Female | <65 | I/II | Chemotherapy | | SD |


