
|
|||||
|
 | |
| |
| |
| |
| |
| |
|
Gene: SCMH1 |
Gene summary for SCMH1 |
| Gene information | Species | Human | Gene symbol | SCMH1 | Gene ID | 22955 |
| Gene name | Scm polycomb group protein homolog 1 | |
| Gene Alias | Scml3 | |
| Cytomap | 1p34.2 | |
| Gene Type | protein-coding | GO ID | GO:0000003 | UniProtAcc | Q96GD3 |
Top |
Malignant transformation analysis |
| Identification of the aberrant gene expression in precancerous and cancerous lesions by comparing the gene expression of stem-like cells in diseased tissues with normal stem cells |
| Entrez ID | Symbol | Replicates | Species | Organ | Tissue | Adj P-value | Log2FC | Malignancy |
| 22955 | SCMH1 | P11T-E | Human | Esophagus | ESCC | 2.92e-06 | 1.68e-01 | 0.1426 |
| 22955 | SCMH1 | P12T-E | Human | Esophagus | ESCC | 6.19e-13 | 1.85e-01 | 0.1122 |
| 22955 | SCMH1 | P15T-E | Human | Esophagus | ESCC | 1.24e-18 | 1.82e-01 | 0.1149 |
| 22955 | SCMH1 | P16T-E | Human | Esophagus | ESCC | 7.09e-14 | 2.29e-01 | 0.1153 |
| 22955 | SCMH1 | P17T-E | Human | Esophagus | ESCC | 3.05e-02 | 1.36e-01 | 0.1278 |
| 22955 | SCMH1 | P20T-E | Human | Esophagus | ESCC | 1.07e-12 | 1.60e-01 | 0.1124 |
| 22955 | SCMH1 | P21T-E | Human | Esophagus | ESCC | 5.72e-22 | 2.65e-01 | 0.1617 |
| 22955 | SCMH1 | P22T-E | Human | Esophagus | ESCC | 1.45e-13 | 1.79e-01 | 0.1236 |
| 22955 | SCMH1 | P23T-E | Human | Esophagus | ESCC | 4.24e-07 | 2.16e-01 | 0.108 |
| 22955 | SCMH1 | P26T-E | Human | Esophagus | ESCC | 3.39e-03 | 7.10e-02 | 0.1276 |
| 22955 | SCMH1 | P27T-E | Human | Esophagus | ESCC | 1.39e-12 | 2.60e-01 | 0.1055 |
| 22955 | SCMH1 | P28T-E | Human | Esophagus | ESCC | 4.64e-11 | 1.17e-01 | 0.1149 |
| 22955 | SCMH1 | P30T-E | Human | Esophagus | ESCC | 4.68e-19 | 4.29e-01 | 0.137 |
| 22955 | SCMH1 | P31T-E | Human | Esophagus | ESCC | 2.03e-19 | 3.02e-01 | 0.1251 |
| 22955 | SCMH1 | P32T-E | Human | Esophagus | ESCC | 5.04e-11 | 1.42e-01 | 0.1666 |
| 22955 | SCMH1 | P36T-E | Human | Esophagus | ESCC | 2.72e-08 | 2.11e-01 | 0.1187 |
| 22955 | SCMH1 | P37T-E | Human | Esophagus | ESCC | 1.30e-10 | 1.69e-01 | 0.1371 |
| 22955 | SCMH1 | P39T-E | Human | Esophagus | ESCC | 2.48e-02 | 2.10e-02 | 0.0894 |
| 22955 | SCMH1 | P40T-E | Human | Esophagus | ESCC | 9.91e-08 | 1.38e-01 | 0.109 |
| 22955 | SCMH1 | P42T-E | Human | Esophagus | ESCC | 3.50e-10 | 2.20e-01 | 0.1175 |
| Page: 1 2 3 4 5 6 7 8 |
| Tissue | Expression Dynamics | Abbreviation |
| Cervix | 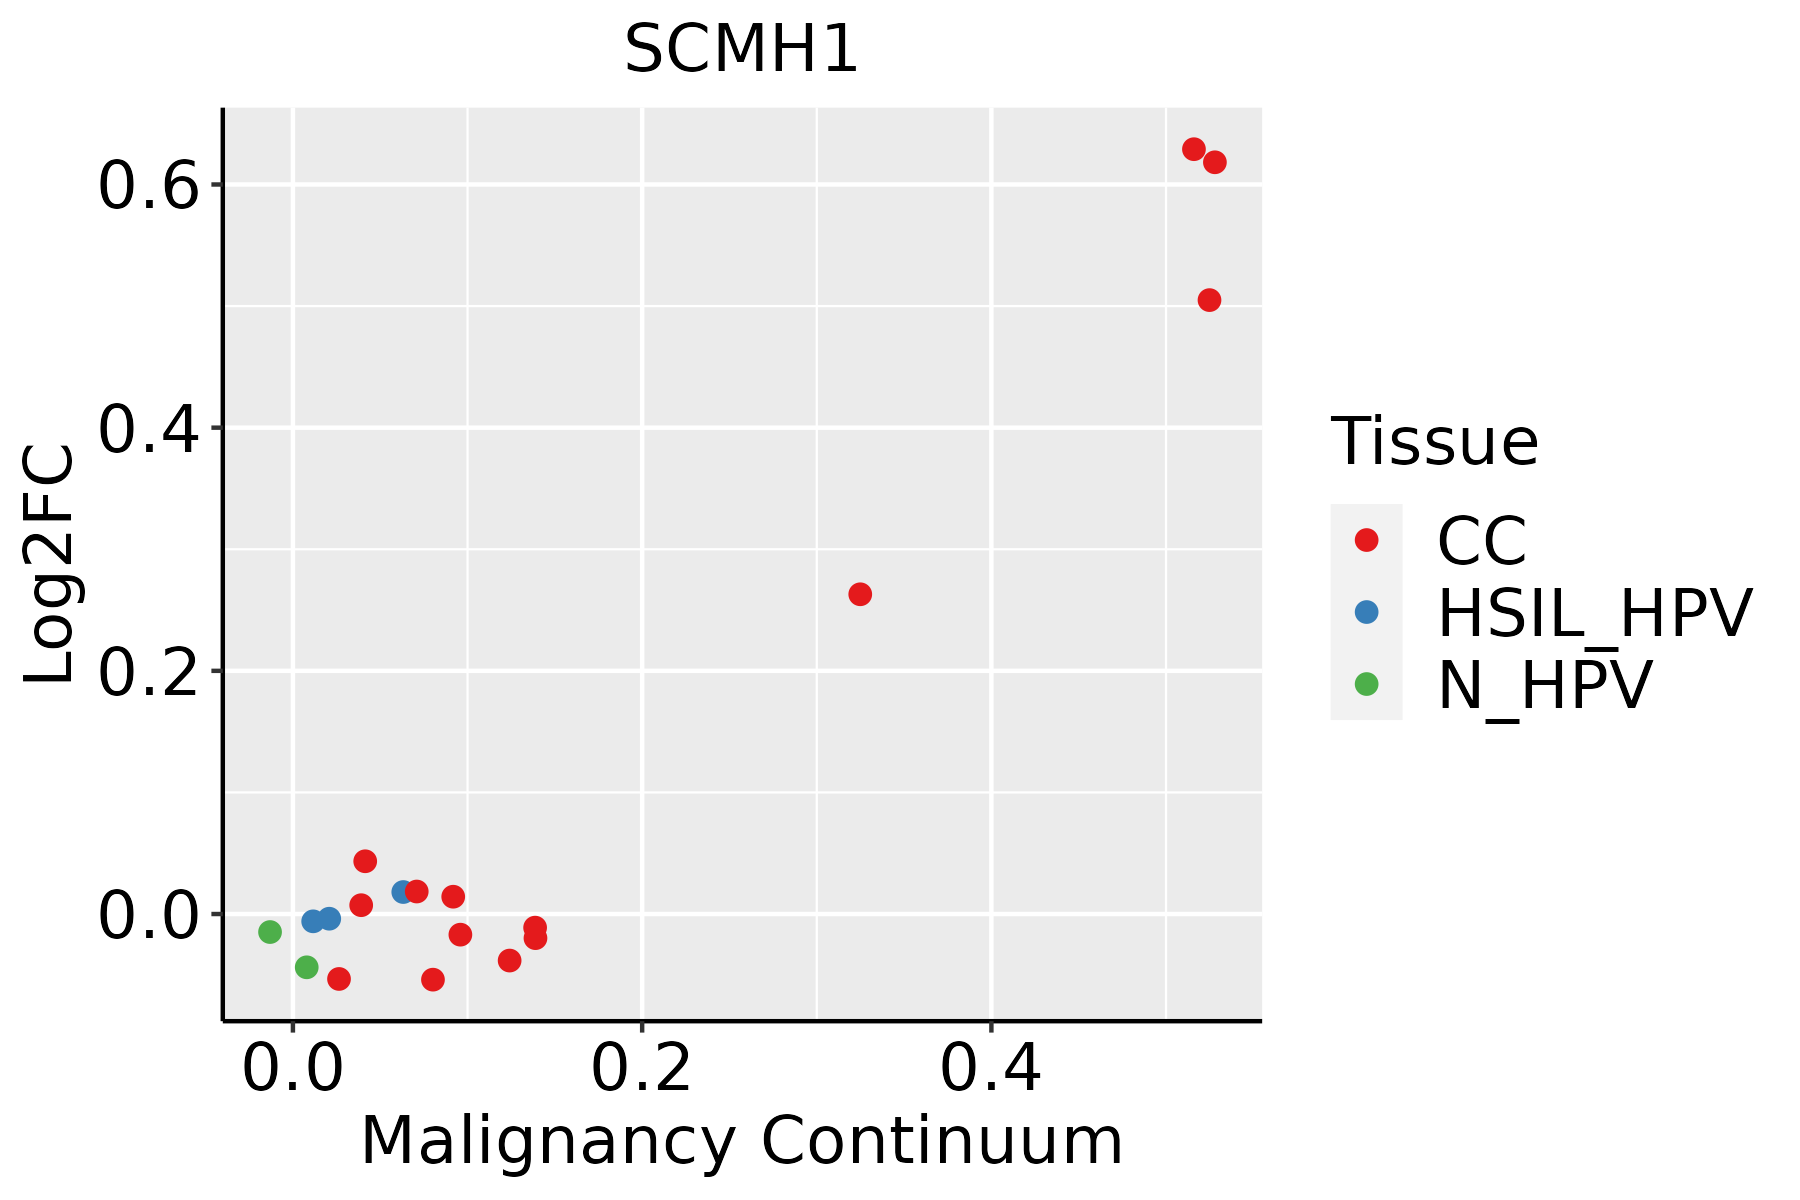 | CC: Cervix cancer |
| HSIL_HPV: HPV-infected high-grade squamous intraepithelial lesions | ||
| N_HPV: HPV-infected normal cervix | ||
| Colorectum (GSE201348) |  | FAP: Familial adenomatous polyposis |
| CRC: Colorectal cancer | ||
| Colorectum (HTA11) |  | AD: Adenomas |
| SER: Sessile serrated lesions | ||
| MSI-H: Microsatellite-high colorectal cancer | ||
| MSS: Microsatellite stable colorectal cancer | ||
| Endometrium | 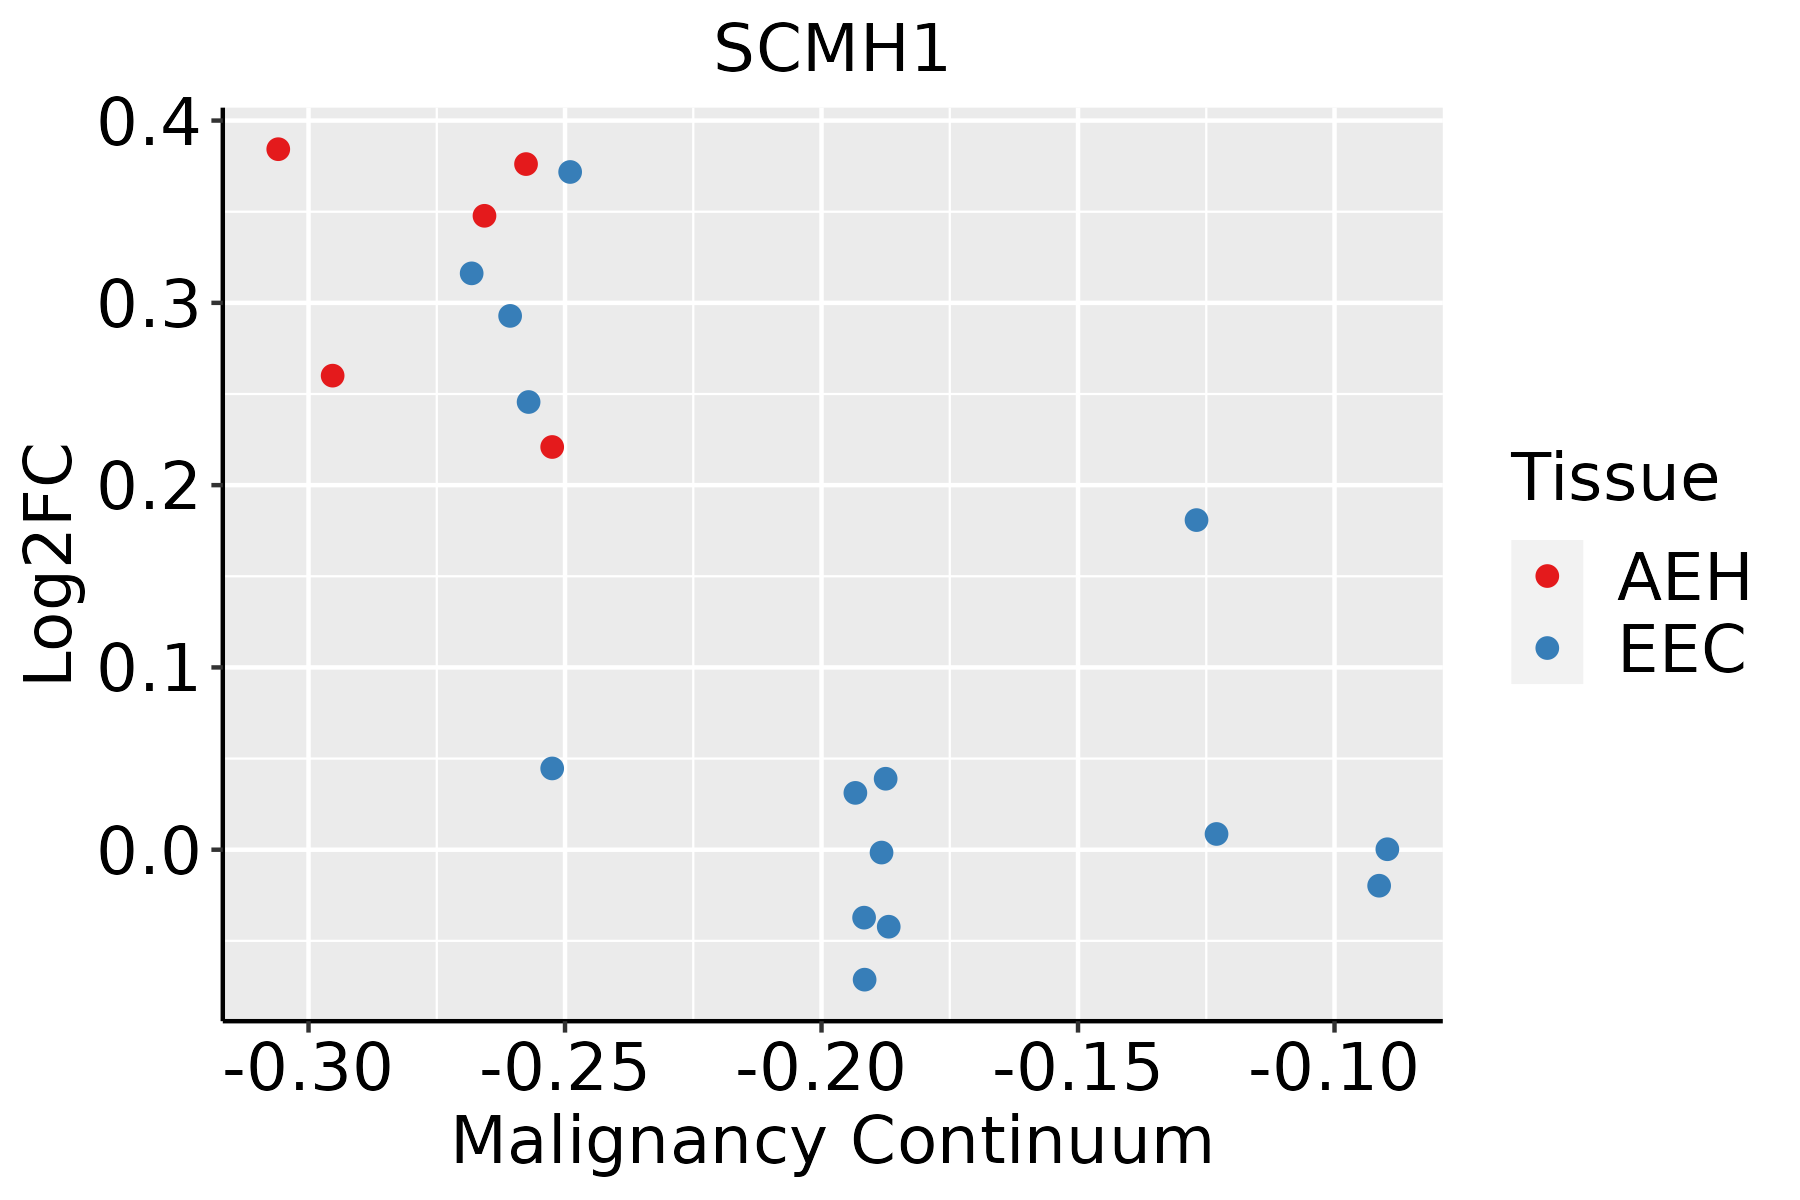 | AEH: Atypical endometrial hyperplasia |
| EEC: Endometrioid Cancer | ||
| Esophagus | 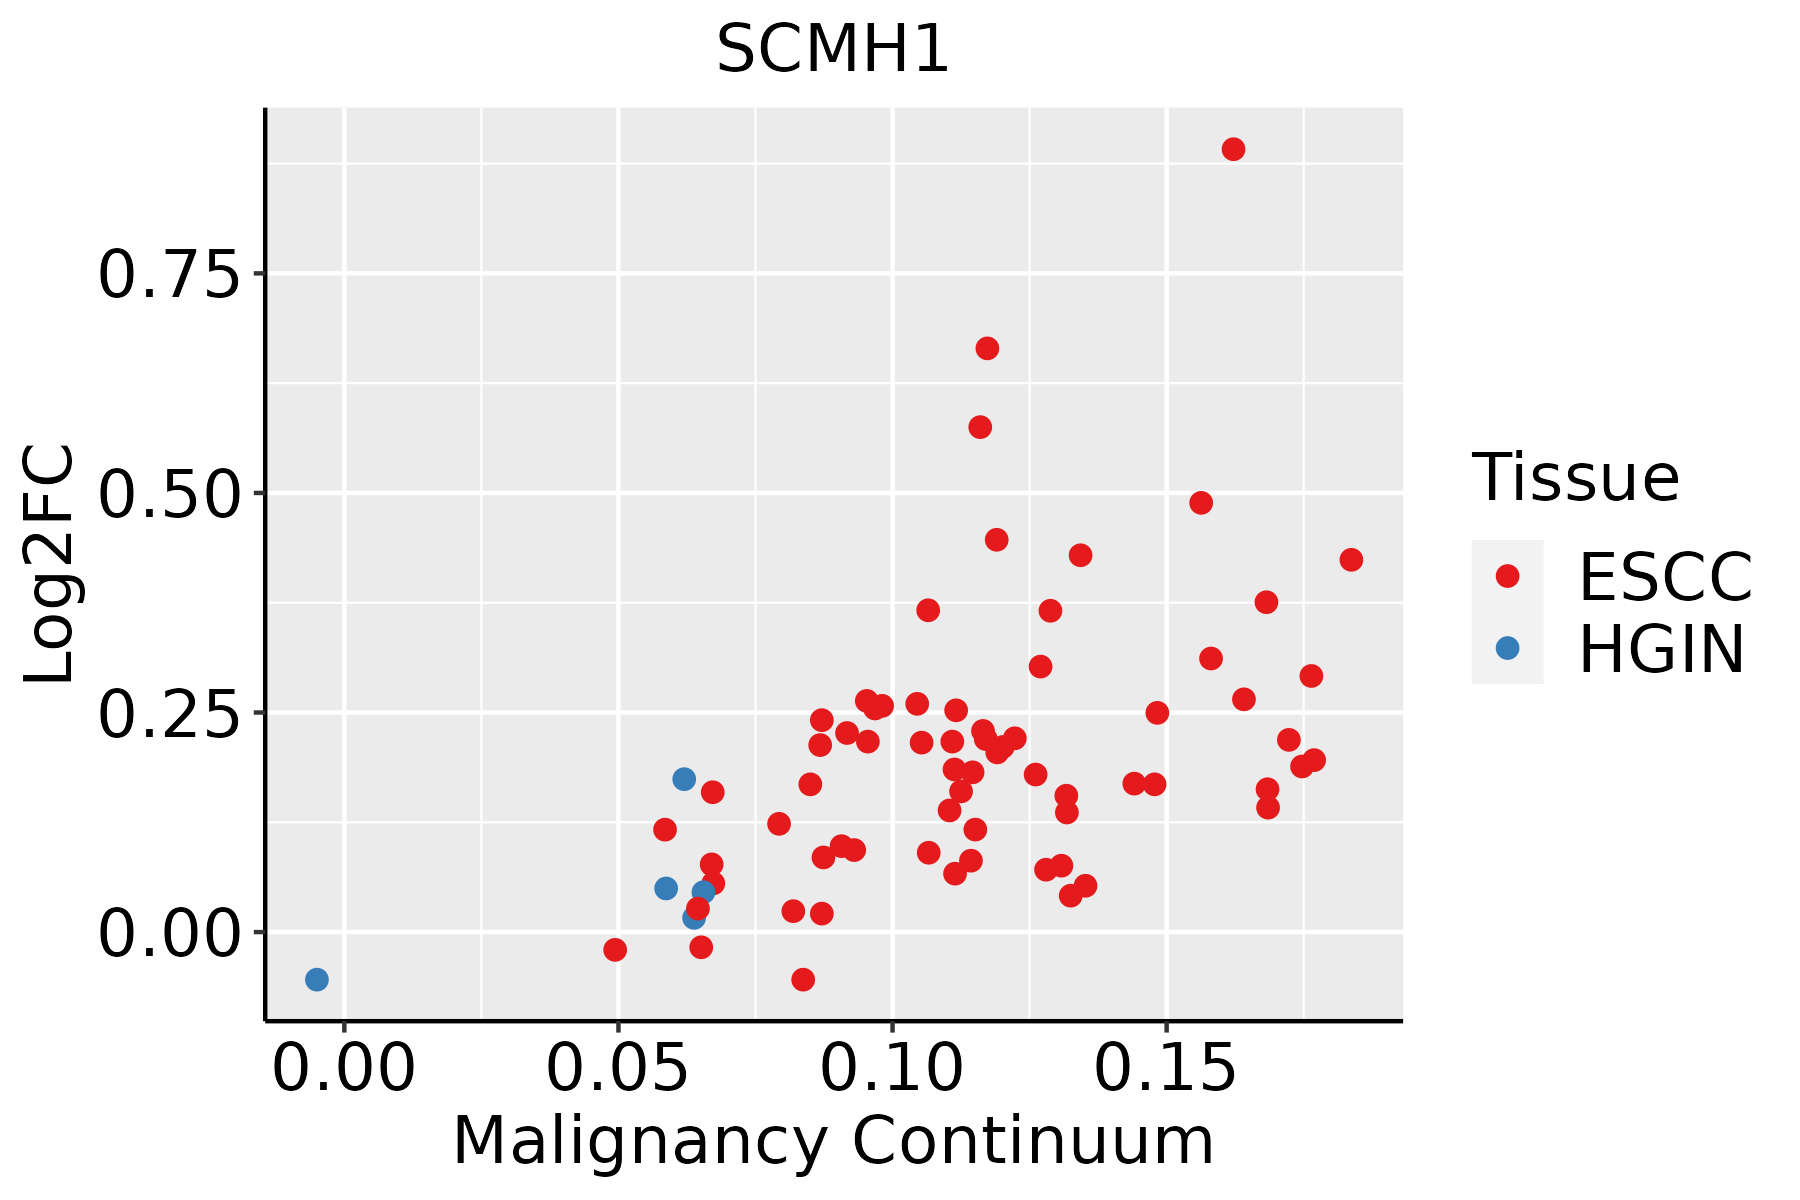 | ESCC: Esophageal squamous cell carcinoma |
| HGIN: High-grade intraepithelial neoplasias | ||
| LGIN: Low-grade intraepithelial neoplasias | ||
| Liver |  | HCC: Hepatocellular carcinoma |
| NAFLD: Non-alcoholic fatty liver disease | ||
| Lung |  | AAH: Atypical adenomatous hyperplasia |
| AIS: Adenocarcinoma in situ | ||
| IAC: Invasive lung adenocarcinoma | ||
| MIA: Minimally invasive adenocarcinoma | ||
| Prostate |  | BPH: Benign Prostatic Hyperplasia |
| ∗log2FC in expression of this searched gene in stem-like cells from each diseased tissue sample relative to stem-like cells in normal samples in each tissue plotted against the malignancy continuum. Samples are colored based on if they are from different disease stage. |
Top |
Malignant transformation related pathway analysis |
| Find out the enriched GO biological processes and KEGG pathways involved in transition from healthy to precancer to cancer |
| Tissue | Disease Stage | Enriched GO biological Processes |
| Colorectum | AD |  |
| Colorectum | SER |  |
| Colorectum | MSS |  |
| Colorectum | MSI-H |  |
| Colorectum | FAP |  |
| ∗Top 15 enriched GO BP terms are showed in the bar plot of each disease state in each tissue. Each row represents a significant GO biological process which is colored according to the -log10(p.adjust). |
| Page: 1 2 3 4 5 6 7 8 9 |
| GO ID | Tissue | Disease Stage | Description | Gene Ratio | Bg Ratio | pvalue | p.adjust | Count |
| GO:00063257 | Cervix | CC | chromatin organization | 78/2311 | 409/18723 | 5.40e-05 | 8.02e-04 | 78 |
| GO:00063381 | Cervix | CC | chromatin remodeling | 45/2311 | 255/18723 | 8.33e-03 | 4.30e-02 | 45 |
| GO:0006325 | Colorectum | AD | chromatin organization | 119/3918 | 409/18723 | 4.85e-05 | 8.33e-04 | 119 |
| GO:0006338 | Colorectum | AD | chromatin remodeling | 70/3918 | 255/18723 | 7.44e-03 | 4.53e-02 | 70 |
| GO:00063251 | Colorectum | SER | chromatin organization | 89/2897 | 409/18723 | 4.15e-04 | 6.17e-03 | 89 |
| GO:00063252 | Colorectum | MSS | chromatin organization | 107/3467 | 409/18723 | 7.22e-05 | 1.21e-03 | 107 |
| GO:00063253 | Colorectum | FAP | chromatin organization | 84/2622 | 409/18723 | 1.62e-04 | 2.47e-03 | 84 |
| GO:0009952 | Colorectum | FAP | anterior/posterior pattern specification | 41/2622 | 201/18723 | 7.82e-03 | 4.63e-02 | 41 |
| GO:00063254 | Colorectum | CRC | chromatin organization | 74/2078 | 409/18723 | 1.48e-05 | 4.61e-04 | 74 |
| GO:00099521 | Colorectum | CRC | anterior/posterior pattern specification | 36/2078 | 201/18723 | 2.56e-03 | 2.40e-02 | 36 |
| GO:00063258 | Endometrium | AEH | chromatin organization | 64/2100 | 409/18723 | 3.69e-03 | 2.52e-02 | 64 |
| GO:000632513 | Endometrium | EEC | chromatin organization | 65/2168 | 409/18723 | 4.98e-03 | 3.14e-02 | 65 |
| GO:000632517 | Esophagus | ESCC | chromatin organization | 240/8552 | 409/18723 | 6.52e-08 | 1.14e-06 | 240 |
| GO:00063255 | Liver | NAFLD | chromatin organization | 64/1882 | 409/18723 | 2.31e-04 | 3.89e-03 | 64 |
| GO:000632511 | Liver | HCC | chromatin organization | 206/7958 | 409/18723 | 7.23e-04 | 4.41e-03 | 206 |
| GO:00063256 | Lung | IAC | chromatin organization | 69/2061 | 409/18723 | 2.01e-04 | 3.53e-03 | 69 |
| GO:000632512 | Lung | AIS | chromatin organization | 62/1849 | 409/18723 | 4.24e-04 | 7.29e-03 | 62 |
| GO:00063259 | Prostate | BPH | chromatin organization | 101/3107 | 409/18723 | 1.52e-05 | 1.94e-04 | 101 |
| GO:00063382 | Prostate | BPH | chromatin remodeling | 62/3107 | 255/18723 | 9.47e-04 | 5.97e-03 | 62 |
| Page: 1 |
| Pathway ID | Tissue | Disease Stage | Description | Gene Ratio | Bg Ratio | pvalue | p.adjust | qvalue | Count |
| Page: 1 |
Top |
Cell-cell communication analysis |
| Identification of potential cell-cell interactions between two cell types and their ligand-receptor pairs for different disease states |
| Ligand | Receptor | LRpair | Pathway | Tissue | Disease Stage |
| Page: 1 |
Top |
Single-cell gene regulatory network inference analysis |
| Find out the significant the regulons (TFs) and the target genes of each regulon across cell types for different disease states |
| TF | Cell Type | Tissue | Disease Stage | Target Gene | RSS | Regulon Activity |
| SCMH1 | NK | Endometrium | EEC | LDB2,DIAPH3,LINC01572, etc. | 2.51e-02 |  |
| ∗The dot plots of a searched regulon are shown for all cell subpopulations in each disease state of each tissue based on the regulon specific score inferred using pySCENIC and by calculating the average expression. |
| Page: 1 |
Top |
Somatic mutation of malignant transformation related genes |
| Annotation of somatic variants for genes involved in malignant transformation |
| Hugo Symbol | Variant Class | Variant Classification | dbSNP RS | HGVSc | HGVSp | HGVSp Short | SWISSPROT | BIOTYPE | SIFT | PolyPhen | Tumor Sample Barcode | Tissue | Histology | Sex | Age | Stage | Therapy Types | Drugs | Outcome |
| SCMH1 | SNV | Missense_Mutation | novel | c.869C>T | p.Ser290Phe | p.S290F | Q96GD3 | protein_coding | deleterious(0.05) | benign(0.017) | TCGA-A2-A0CR-01 | Breast | breast invasive carcinoma | Female | <65 | I/II | Chemotherapy | adriamycin | CR |
| SCMH1 | SNV | Missense_Mutation | novel | c.1702A>C | p.Asn568His | p.N568H | Q96GD3 | protein_coding | tolerated(0.22) | benign(0.001) | TCGA-AN-A046-01 | Breast | breast invasive carcinoma | Female | >=65 | I/II | Unknown | Unknown | SD |
| SCMH1 | SNV | Missense_Mutation | c.833N>A | p.Gly278Glu | p.G278E | Q96GD3 | protein_coding | deleterious(0.05) | probably_damaging(0.96) | TCGA-AO-A0JC-01 | Breast | breast invasive carcinoma | Female | <65 | I/II | Chemotherapy | fluorouracil | SD | |
| SCMH1 | SNV | Missense_Mutation | c.1681N>G | p.Met561Val | p.M561V | Q96GD3 | protein_coding | tolerated(0.57) | benign(0) | TCGA-C8-A27B-01 | Breast | breast invasive carcinoma | Female | <65 | I/II | Chemotherapy | 5-fluorouracil | CR | |
| SCMH1 | insertion | Nonsense_Mutation | novel | c.157_158insTATTACAGTGAGTCTCAATGGGGGACCGAGAGAGTTA | p.Pro53LeufsTer4 | p.P53Lfs*4 | Q96GD3 | protein_coding | TCGA-AO-A03R-01 | Breast | breast invasive carcinoma | Female | <65 | I/II | Chemotherapy | doxorubicin | SD | ||
| SCMH1 | deletion | Frame_Shift_Del | novel | c.668delG | p.Gly223AlafsTer5 | p.G223Afs*5 | Q96GD3 | protein_coding | TCGA-D8-A27V-01 | Breast | breast invasive carcinoma | Female | <65 | I/II | Hormone Therapy | tamoxiphen | SD | ||
| SCMH1 | deletion | Frame_Shift_Del | novel | c.1160delC | p.Pro387GlnfsTer92 | p.P387Qfs*92 | Q96GD3 | protein_coding | TCGA-EW-A2FV-01 | Breast | breast invasive carcinoma | Female | <65 | III/IV | Chemotherapy | docetaxel | SD | ||
| SCMH1 | SNV | Missense_Mutation | novel | c.1157G>A | p.Gly386Glu | p.G386E | Q96GD3 | protein_coding | deleterious(0) | probably_damaging(1) | TCGA-C5-A8XH-01 | Cervix | cervical & endocervical cancer | Female | <65 | I/II | Unknown | Unknown | SD |
| SCMH1 | SNV | Missense_Mutation | c.1621T>G | p.Ser541Ala | p.S541A | Q96GD3 | protein_coding | tolerated(0.17) | benign(0.001) | TCGA-FU-A3HZ-01 | Cervix | cervical & endocervical cancer | Female | <65 | I/II | Chemotherapy | cisplatin | CR | |
| SCMH1 | SNV | Missense_Mutation | c.286G>A | p.Asp96Asn | p.D96N | Q96GD3 | protein_coding | deleterious(0.01) | probably_damaging(0.995) | TCGA-CM-4746-01 | Colorectum | colon adenocarcinoma | Male | <65 | I/II | Unknown | Unknown | SD |
| Page: 1 2 3 4 5 |
Top |
Related drugs of malignant transformation related genes |
| Identification of chemicals and drugs interact with genes involved in malignant transfromation |
| (DGIdb 4.0) |
| Entrez ID | Symbol | Category | Interaction Types | Drug Claim Name | Drug Name | PMIDs |
| Page: 1 |

Copyright 2023-Present -The University of Texas Health Science Center at Houston |