
|
|||||
|
 | |
| |
| |
| |
| |
| |
|
Gene: SCD5 |
Gene summary for SCD5 |
| Gene information | Species | Human | Gene symbol | SCD5 | Gene ID | 79966 |
| Gene name | stearoyl-CoA desaturase 5 | |
| Gene Alias | ACOD4 | |
| Cytomap | 4q21.22 | |
| Gene Type | protein-coding | GO ID | GO:0006082 | UniProtAcc | Q86SK9 |
Top |
Malignant transformation analysis |
| Identification of the aberrant gene expression in precancerous and cancerous lesions by comparing the gene expression of stem-like cells in diseased tissues with normal stem cells |
| Entrez ID | Symbol | Replicates | Species | Organ | Tissue | Adj P-value | Log2FC | Malignancy |
| 79966 | SCD5 | C46 | Human | Oral cavity | OSCC | 4.29e-15 | 3.86e-01 | 0.1673 |
| 79966 | SCD5 | C51 | Human | Oral cavity | OSCC | 3.26e-04 | 3.14e-01 | 0.2674 |
| 79966 | SCD5 | C08 | Human | Oral cavity | OSCC | 8.25e-24 | 4.99e-01 | 0.1919 |
| 79966 | SCD5 | C09 | Human | Oral cavity | OSCC | 5.09e-23 | 6.43e-01 | 0.1431 |
| 79966 | SCD5 | LN46 | Human | Oral cavity | OSCC | 1.74e-10 | 4.41e-01 | 0.1666 |
| 79966 | SCD5 | LP15 | Human | Oral cavity | LP | 1.65e-05 | 6.98e-01 | 0.2174 |
| 79966 | SCD5 | SYSMH1 | Human | Oral cavity | OSCC | 1.00e-10 | 1.27e-01 | 0.1127 |
| 79966 | SCD5 | SYSMH2 | Human | Oral cavity | OSCC | 4.39e-03 | 7.23e-02 | 0.2326 |
| 79966 | SCD5 | SYSMH3 | Human | Oral cavity | OSCC | 3.58e-10 | 2.26e-01 | 0.2442 |
| 79966 | SCD5 | SYSMH6 | Human | Oral cavity | OSCC | 8.67e-09 | 3.11e-01 | 0.1275 |
| 79966 | SCD5 | HTA12-23-1 | Human | Pancreas | PDAC | 2.51e-03 | 6.40e-01 | 0.3405 |
| 79966 | SCD5 | HTA12-26-1 | Human | Pancreas | PDAC | 3.71e-09 | 6.60e-01 | 0.3728 |
| 79966 | SCD5 | HTA12-29-1 | Human | Pancreas | PDAC | 8.93e-27 | 7.08e-01 | 0.3722 |
| 79966 | SCD5 | male-WTA | Human | Thyroid | PTC | 1.85e-55 | 5.85e-01 | 0.1037 |
| 79966 | SCD5 | PTC01 | Human | Thyroid | PTC | 3.19e-21 | 4.30e-01 | 0.1899 |
| 79966 | SCD5 | PTC03 | Human | Thyroid | PTC | 3.33e-02 | 7.09e-02 | 0.1784 |
| 79966 | SCD5 | PTC04 | Human | Thyroid | PTC | 4.32e-06 | 1.42e-01 | 0.1927 |
| 79966 | SCD5 | PTC05 | Human | Thyroid | PTC | 1.07e-17 | 8.87e-01 | 0.2065 |
| 79966 | SCD5 | PTC06 | Human | Thyroid | PTC | 2.30e-30 | 8.26e-01 | 0.2057 |
| 79966 | SCD5 | PTC07 | Human | Thyroid | PTC | 4.34e-24 | 5.63e-01 | 0.2044 |
| Page: 1 2 3 4 5 |
| Tissue | Expression Dynamics | Abbreviation |
| Cervix | 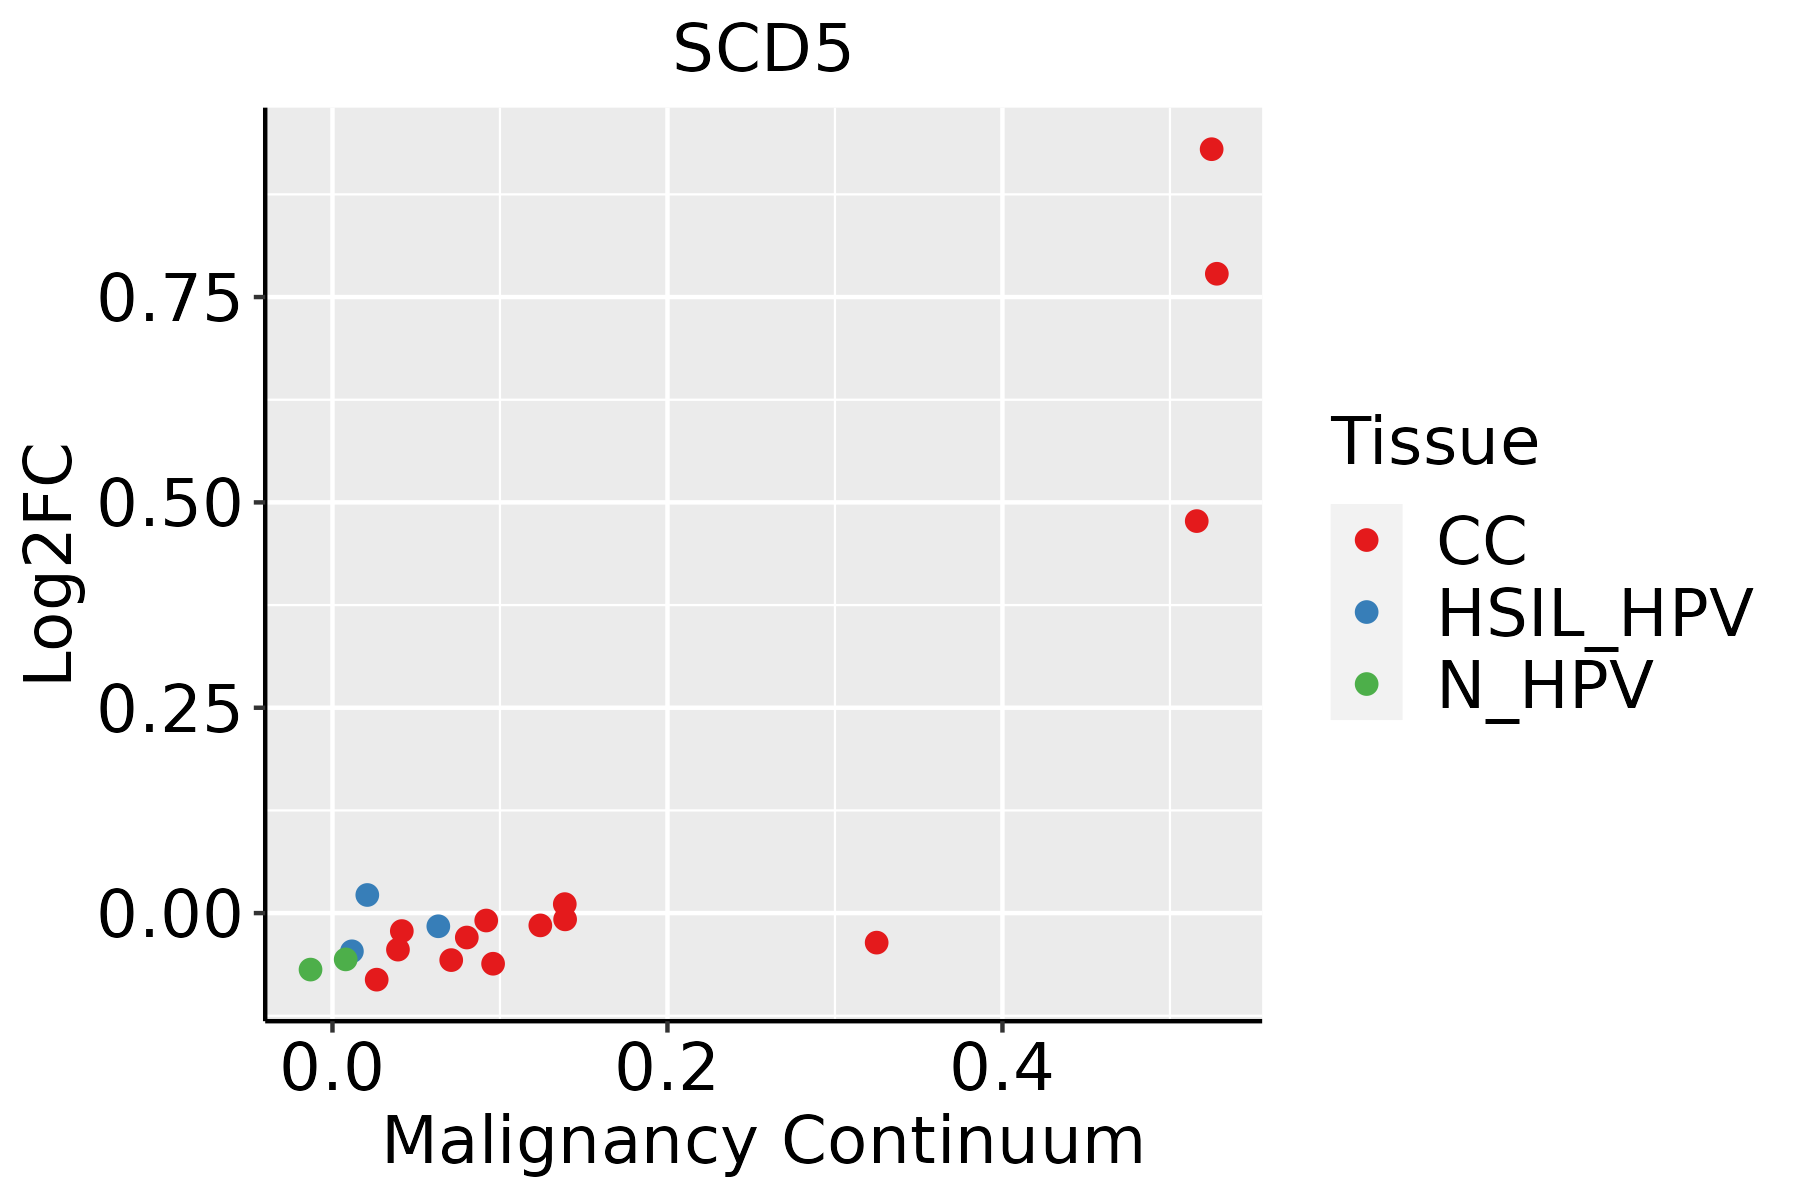 | CC: Cervix cancer |
| HSIL_HPV: HPV-infected high-grade squamous intraepithelial lesions | ||
| N_HPV: HPV-infected normal cervix | ||
| Esophagus |  | ESCC: Esophageal squamous cell carcinoma |
| HGIN: High-grade intraepithelial neoplasias | ||
| LGIN: Low-grade intraepithelial neoplasias | ||
| Oral Cavity | 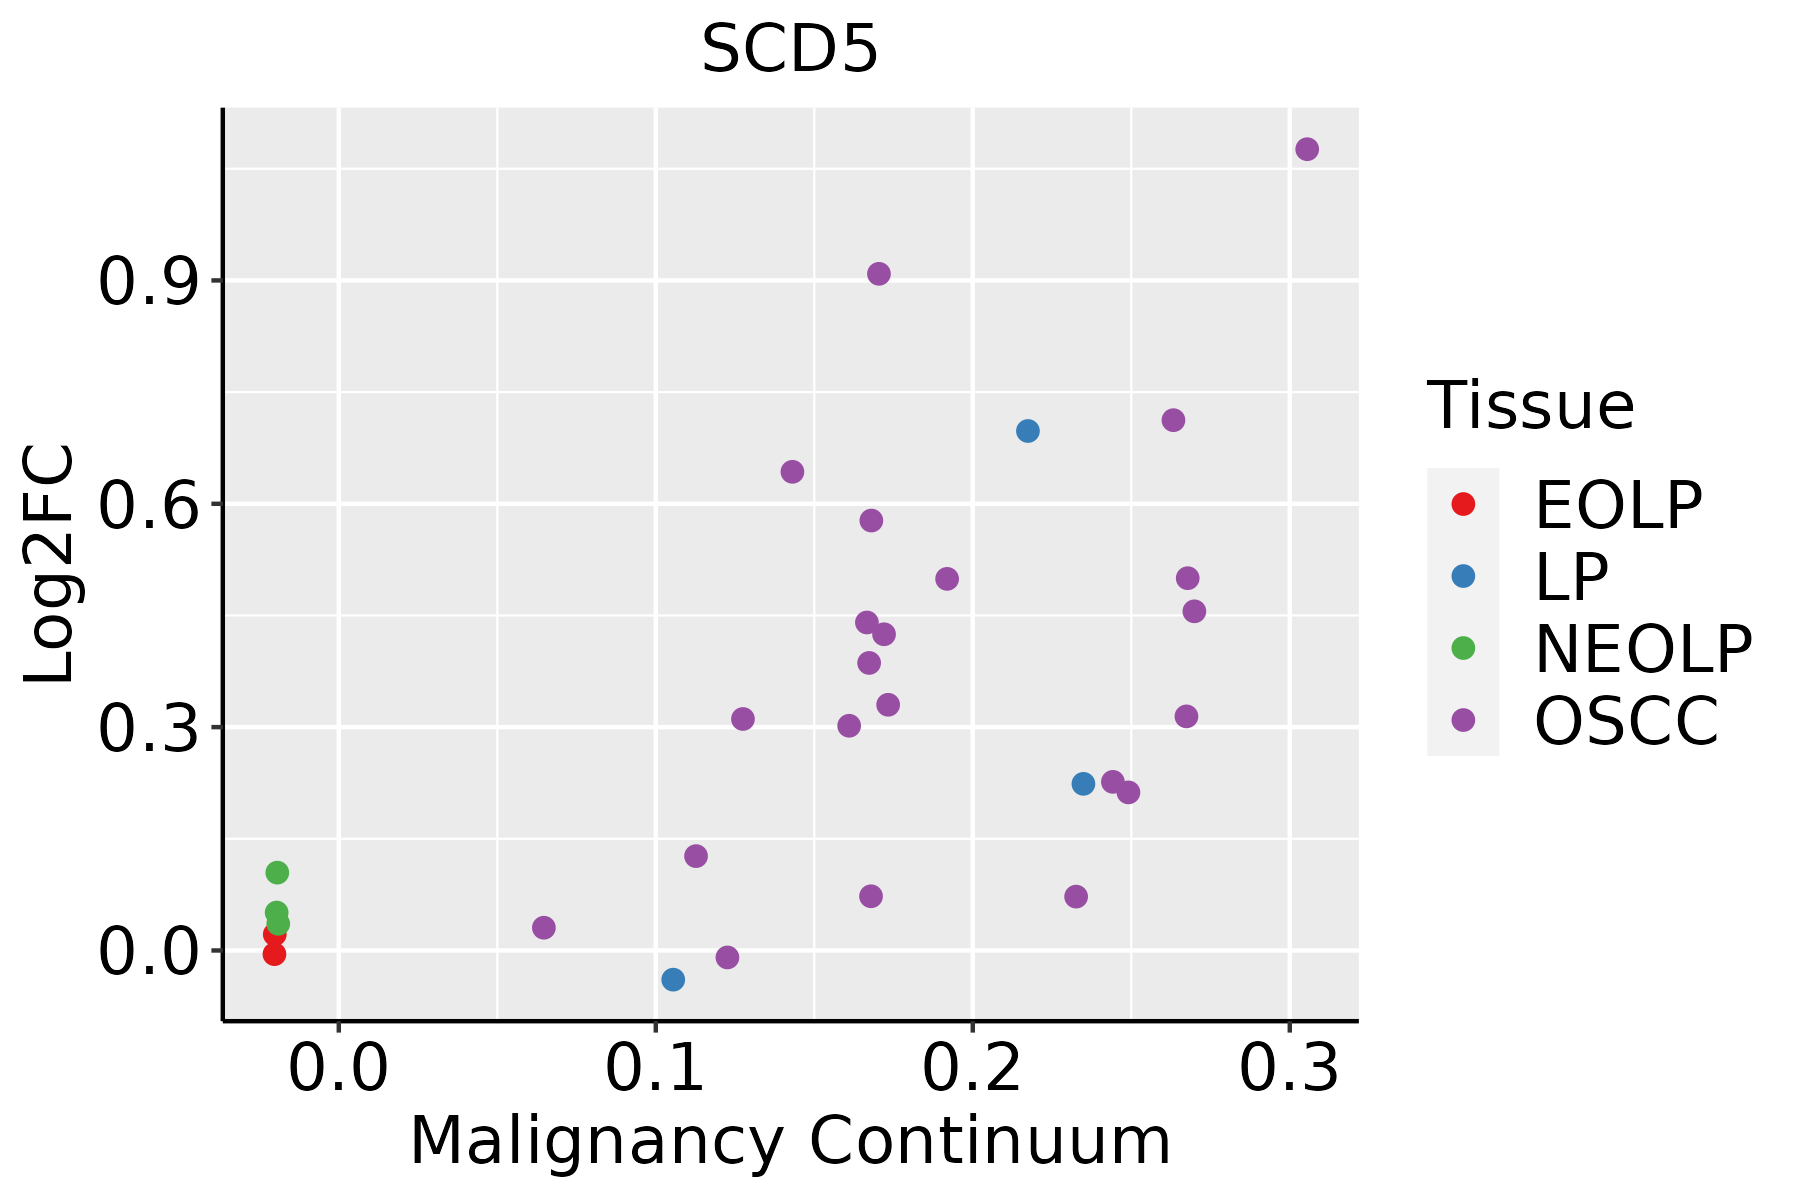 | EOLP: Erosive Oral lichen planus |
| LP: leukoplakia | ||
| NEOLP: Non-erosive oral lichen planus | ||
| OSCC: Oral squamous cell carcinoma | ||
| Thyroid | 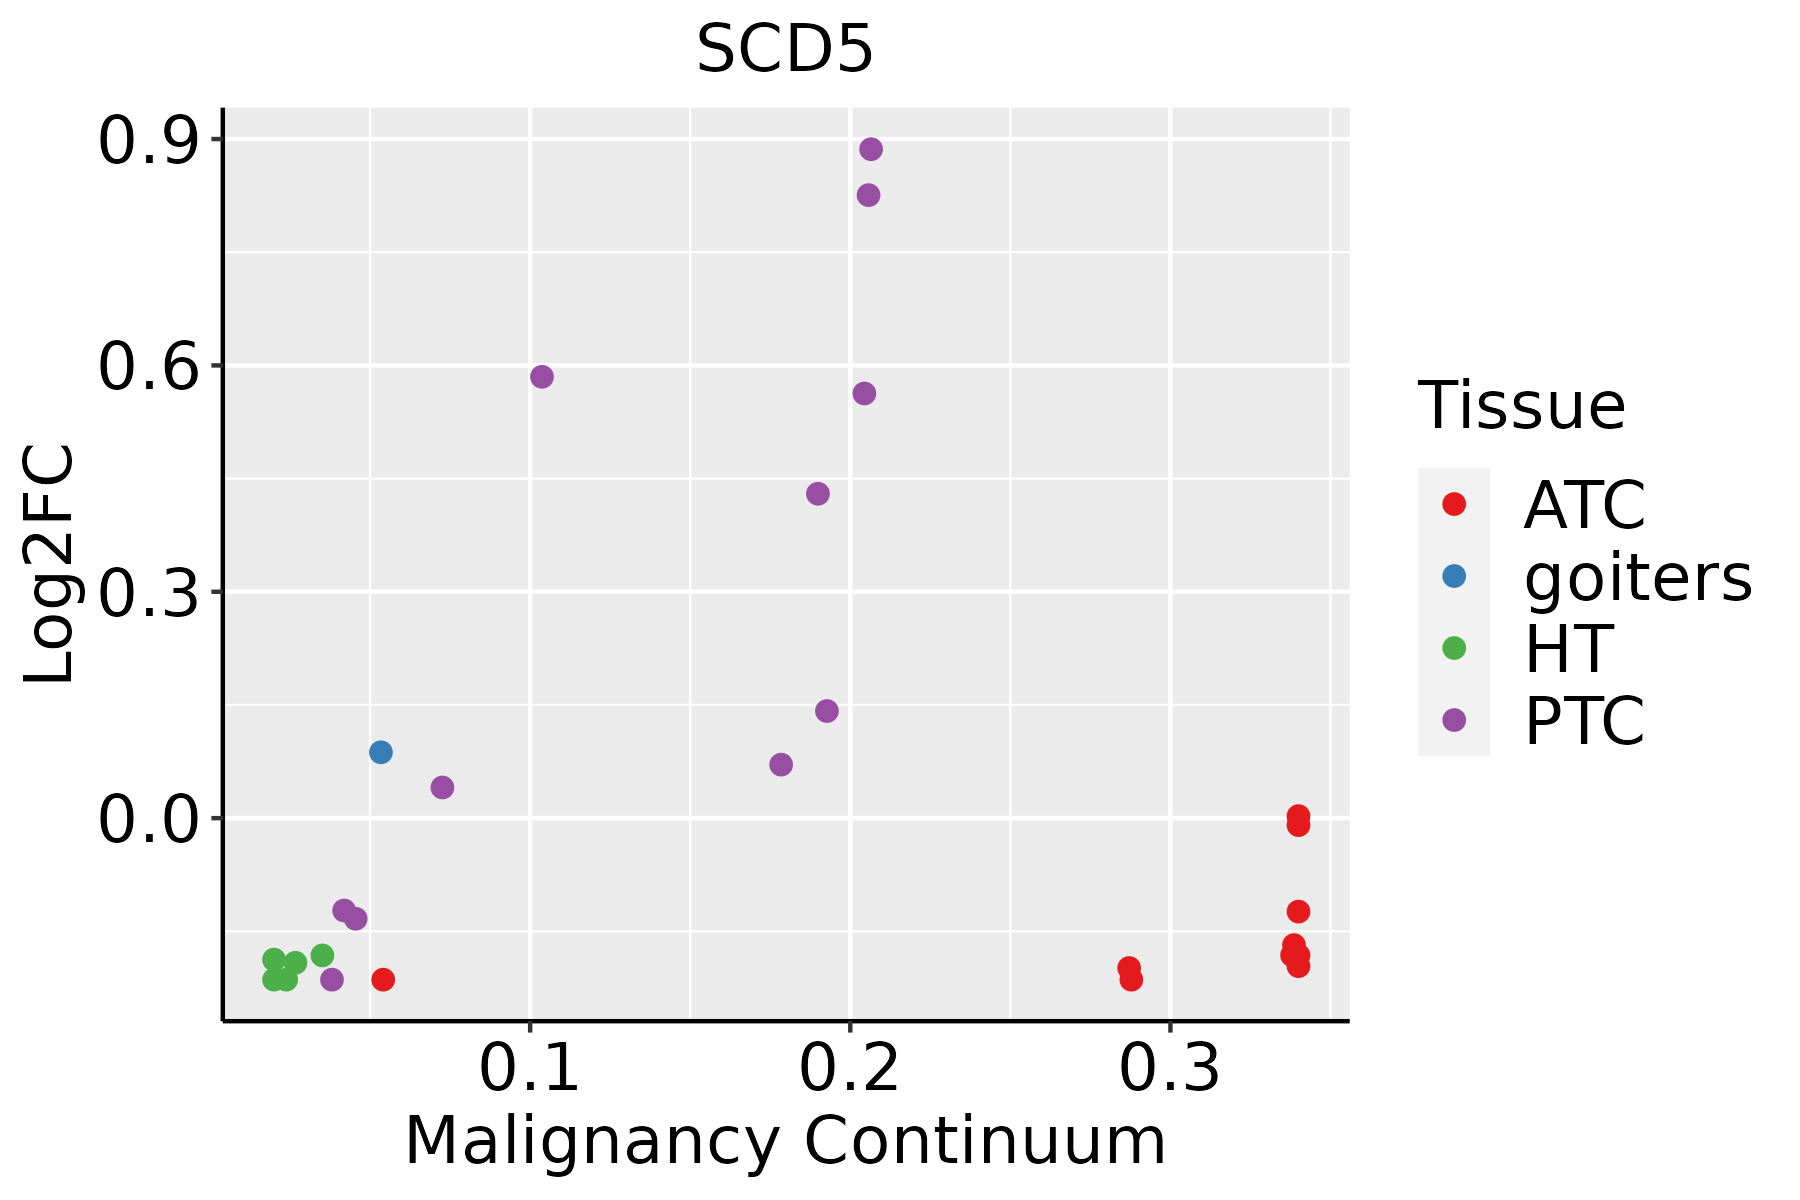 | ATC: Anaplastic thyroid cancer |
| HT: Hashimoto's thyroiditis | ||
| PTC: Papillary thyroid cancer |
| ∗log2FC in expression of this searched gene in stem-like cells from each diseased tissue sample relative to stem-like cells in normal samples in each tissue plotted against the malignancy continuum. Samples are colored based on if they are from different disease stage. |
Top |
Malignant transformation related pathway analysis |
| Find out the enriched GO biological processes and KEGG pathways involved in transition from healthy to precancer to cancer |
| Tissue | Disease Stage | Enriched GO biological Processes |
| Colorectum | AD |  |
| Colorectum | SER |  |
| Colorectum | MSS |  |
| Colorectum | MSI-H |  |
| Colorectum | FAP |  |
| ∗Top 15 enriched GO BP terms are showed in the bar plot of each disease state in each tissue. Each row represents a significant GO biological process which is colored according to the -log10(p.adjust). |
| Page: 1 2 3 4 5 6 7 8 9 |
| GO ID | Tissue | Disease Stage | Description | Gene Ratio | Bg Ratio | pvalue | p.adjust | Count |
| GO:00066318 | Esophagus | ESCC | fatty acid metabolic process | 217/8552 | 390/18723 | 4.21e-05 | 3.39e-04 | 217 |
| GO:00463948 | Esophagus | ESCC | carboxylic acid biosynthetic process | 175/8552 | 314/18723 | 1.98e-04 | 1.26e-03 | 175 |
| GO:00160538 | Esophagus | ESCC | organic acid biosynthetic process | 175/8552 | 316/18723 | 3.04e-04 | 1.82e-03 | 175 |
| GO:00160537 | Oral cavity | OSCC | organic acid biosynthetic process | 155/7305 | 316/18723 | 1.64e-04 | 1.13e-03 | 155 |
| GO:00463947 | Oral cavity | OSCC | carboxylic acid biosynthetic process | 154/7305 | 314/18723 | 1.73e-04 | 1.19e-03 | 154 |
| GO:00066317 | Oral cavity | OSCC | fatty acid metabolic process | 186/7305 | 390/18723 | 2.65e-04 | 1.69e-03 | 186 |
| GO:00066363 | Oral cavity | OSCC | unsaturated fatty acid biosynthetic process | 28/7305 | 51/18723 | 1.54e-02 | 4.99e-02 | 28 |
| Page: 1 |
| Pathway ID | Tissue | Disease Stage | Description | Gene Ratio | Bg Ratio | pvalue | p.adjust | qvalue | Count |
| hsa0415210 | Esophagus | ESCC | AMPK signaling pathway | 80/4205 | 121/8465 | 1.73e-04 | 6.67e-04 | 3.42e-04 | 80 |
| hsa012129 | Esophagus | ESCC | Fatty acid metabolism | 41/4205 | 57/8465 | 5.13e-04 | 1.75e-03 | 8.98e-04 | 41 |
| hsa0415213 | Esophagus | ESCC | AMPK signaling pathway | 80/4205 | 121/8465 | 1.73e-04 | 6.67e-04 | 3.42e-04 | 80 |
| hsa0121214 | Esophagus | ESCC | Fatty acid metabolism | 41/4205 | 57/8465 | 5.13e-04 | 1.75e-03 | 8.98e-04 | 41 |
| hsa041529 | Oral cavity | OSCC | AMPK signaling pathway | 71/3704 | 121/8465 | 6.29e-04 | 1.86e-03 | 9.49e-04 | 71 |
| hsa049365 | Oral cavity | OSCC | Alcoholic liver disease | 78/3704 | 142/8465 | 4.53e-03 | 1.12e-02 | 5.68e-03 | 78 |
| hsa012128 | Oral cavity | OSCC | Fatty acid metabolism | 35/3704 | 57/8465 | 5.37e-03 | 1.29e-02 | 6.55e-03 | 35 |
| hsa0415212 | Oral cavity | OSCC | AMPK signaling pathway | 71/3704 | 121/8465 | 6.29e-04 | 1.86e-03 | 9.49e-04 | 71 |
| hsa0493612 | Oral cavity | OSCC | Alcoholic liver disease | 78/3704 | 142/8465 | 4.53e-03 | 1.12e-02 | 5.68e-03 | 78 |
| hsa0121213 | Oral cavity | OSCC | Fatty acid metabolism | 35/3704 | 57/8465 | 5.37e-03 | 1.29e-02 | 6.55e-03 | 35 |
| Page: 1 |
Top |
Cell-cell communication analysis |
| Identification of potential cell-cell interactions between two cell types and their ligand-receptor pairs for different disease states |
| Ligand | Receptor | LRpair | Pathway | Tissue | Disease Stage |
| Page: 1 |
Top |
Single-cell gene regulatory network inference analysis |
| Find out the significant the regulons (TFs) and the target genes of each regulon across cell types for different disease states |
| TF | Cell Type | Tissue | Disease Stage | Target Gene | RSS | Regulon Activity |
| ∗The dot plots of a searched regulon are shown for all cell subpopulations in each disease state of each tissue based on the regulon specific score inferred using pySCENIC and by calculating the average expression. |
| Page: 1 |
Top |
Somatic mutation of malignant transformation related genes |
| Annotation of somatic variants for genes involved in malignant transformation |
| Hugo Symbol | Variant Class | Variant Classification | dbSNP RS | HGVSc | HGVSp | HGVSp Short | SWISSPROT | BIOTYPE | SIFT | PolyPhen | Tumor Sample Barcode | Tissue | Histology | Sex | Age | Stage | Therapy Types | Drugs | Outcome |
| SCD5 | SNV | Missense_Mutation | c.88N>T | p.Gly30Cys | p.G30C | Q86SK9 | protein_coding | tolerated(0.06) | benign(0.374) | TCGA-A1-A0SK-01 | Breast | breast invasive carcinoma | Female | <65 | I/II | Unknown | Unknown | PD | |
| SCD5 | SNV | Missense_Mutation | rs369204191 | c.223N>G | p.Leu75Val | p.L75V | Q86SK9 | protein_coding | tolerated(0.37) | benign(0.1) | TCGA-AC-A23H-01 | Breast | breast invasive carcinoma | Female | >=65 | I/II | Unknown | Unknown | PD |
| SCD5 | SNV | Missense_Mutation | rs781504369 | c.484C>T | p.Arg162Cys | p.R162C | Q86SK9 | protein_coding | deleterious(0) | probably_damaging(0.996) | TCGA-AN-A046-01 | Breast | breast invasive carcinoma | Female | >=65 | I/II | Unknown | Unknown | SD |
| SCD5 | SNV | Missense_Mutation | rs868598058 | c.265N>A | p.Val89Met | p.V89M | Q86SK9 | protein_coding | deleterious(0) | probably_damaging(0.977) | TCGA-AN-A0AK-01 | Breast | breast invasive carcinoma | Female | >=65 | I/II | Unknown | Unknown | SD |
| SCD5 | SNV | Missense_Mutation | rs200922750 | c.445N>T | p.Arg149Trp | p.R149W | Q86SK9 | protein_coding | deleterious(0) | probably_damaging(1) | TCGA-AA-3696-01 | Colorectum | colon adenocarcinoma | Female | >=65 | III/IV | Unknown | Unknown | PD |
| SCD5 | SNV | Missense_Mutation | rs770103071 | c.742C>T | p.Arg248Trp | p.R248W | Q86SK9 | protein_coding | deleterious(0) | probably_damaging(0.994) | TCGA-AA-3710-01 | Colorectum | colon adenocarcinoma | Female | >=65 | I/II | Unknown | Unknown | SD |
| SCD5 | SNV | Missense_Mutation | c.289N>C | p.Trp97Arg | p.W97R | Q86SK9 | protein_coding | deleterious(0) | probably_damaging(1) | TCGA-G4-6586-01 | Colorectum | colon adenocarcinoma | Female | >=65 | I/II | Unknown | Unknown | SD | |
| SCD5 | SNV | Missense_Mutation | c.884N>G | p.Thr295Ser | p.T295S | Q86SK9 | protein_coding | deleterious(0.03) | benign(0.411) | TCGA-RU-A8FL-01 | Colorectum | colon adenocarcinoma | Male | <65 | III/IV | Chemotherapy | folfox | PD | |
| SCD5 | SNV | Missense_Mutation | rs762891080 | c.557N>A | p.Arg186Gln | p.R186Q | Q86SK9 | protein_coding | tolerated(0.15) | benign(0.025) | TCGA-AF-6136-01 | Colorectum | rectum adenocarcinoma | Female | >=65 | III/IV | Chemotherapy | 5-fluorouracil | PD |
| SCD5 | SNV | Missense_Mutation | rs770103071 | c.742C>T | p.Arg248Trp | p.R248W | Q86SK9 | protein_coding | deleterious(0) | probably_damaging(0.994) | TCGA-AJ-A3BG-01 | Endometrium | uterine corpus endometrioid carcinoma | Female | >=65 | I/II | Chemotherapy | carboplatin | PD |
| Page: 1 2 3 4 |
Top |
Related drugs of malignant transformation related genes |
| Identification of chemicals and drugs interact with genes involved in malignant transfromation |
| (DGIdb 4.0) |
| Entrez ID | Symbol | Category | Interaction Types | Drug Claim Name | Drug Name | PMIDs |
| Page: 1 |

Copyright 2023-Present -The University of Texas Health Science Center at Houston |