
|
|||||
|
 | |
| |
| |
| |
| |
| |
|
Gene: SBNO1 |
Gene summary for SBNO1 |
| Gene information | Species | Human | Gene symbol | SBNO1 | Gene ID | 55206 |
| Gene name | strawberry notch homolog 1 | |
| Gene Alias | MOP3 | |
| Cytomap | 12q24.31 | |
| Gene Type | protein-coding | GO ID | GO:0006139 | UniProtAcc | A3KN83 |
Top |
Malignant transformation analysis |
| Identification of the aberrant gene expression in precancerous and cancerous lesions by comparing the gene expression of stem-like cells in diseased tissues with normal stem cells |
| Entrez ID | Symbol | Replicates | Species | Organ | Tissue | Adj P-value | Log2FC | Malignancy |
| 55206 | SBNO1 | P42T-E | Human | Esophagus | ESCC | 2.30e-19 | 3.45e-01 | 0.1175 |
| 55206 | SBNO1 | P44T-E | Human | Esophagus | ESCC | 1.49e-11 | 3.35e-01 | 0.1096 |
| 55206 | SBNO1 | P47T-E | Human | Esophagus | ESCC | 9.66e-13 | 1.88e-01 | 0.1067 |
| 55206 | SBNO1 | P48T-E | Human | Esophagus | ESCC | 1.42e-18 | 3.59e-01 | 0.0959 |
| 55206 | SBNO1 | P49T-E | Human | Esophagus | ESCC | 9.17e-07 | 9.84e-01 | 0.1768 |
| 55206 | SBNO1 | P52T-E | Human | Esophagus | ESCC | 1.71e-18 | 4.26e-01 | 0.1555 |
| 55206 | SBNO1 | P54T-E | Human | Esophagus | ESCC | 4.54e-26 | 6.60e-01 | 0.0975 |
| 55206 | SBNO1 | P56T-E | Human | Esophagus | ESCC | 4.64e-04 | 9.57e-01 | 0.1613 |
| 55206 | SBNO1 | P57T-E | Human | Esophagus | ESCC | 1.30e-12 | 2.40e-01 | 0.0926 |
| 55206 | SBNO1 | P61T-E | Human | Esophagus | ESCC | 1.07e-15 | 3.78e-01 | 0.099 |
| 55206 | SBNO1 | P62T-E | Human | Esophagus | ESCC | 1.17e-36 | 7.37e-01 | 0.1302 |
| 55206 | SBNO1 | P65T-E | Human | Esophagus | ESCC | 5.74e-12 | 2.89e-01 | 0.0978 |
| 55206 | SBNO1 | P74T-E | Human | Esophagus | ESCC | 9.62e-28 | 7.12e-01 | 0.1479 |
| 55206 | SBNO1 | P75T-E | Human | Esophagus | ESCC | 3.16e-23 | 4.75e-01 | 0.1125 |
| 55206 | SBNO1 | P76T-E | Human | Esophagus | ESCC | 1.04e-26 | 5.11e-01 | 0.1207 |
| 55206 | SBNO1 | P79T-E | Human | Esophagus | ESCC | 2.85e-35 | 6.40e-01 | 0.1154 |
| 55206 | SBNO1 | P80T-E | Human | Esophagus | ESCC | 2.75e-46 | 1.23e+00 | 0.155 |
| 55206 | SBNO1 | P82T-E | Human | Esophagus | ESCC | 1.47e-12 | 5.04e-01 | 0.1072 |
| 55206 | SBNO1 | P83T-E | Human | Esophagus | ESCC | 1.21e-22 | 7.15e-01 | 0.1738 |
| 55206 | SBNO1 | P84T-E | Human | Esophagus | ESCC | 6.34e-14 | 5.91e-01 | 0.0933 |
| Page: 1 2 3 4 5 6 7 |
| Tissue | Expression Dynamics | Abbreviation |
| Colorectum (GSE201348) |  | FAP: Familial adenomatous polyposis |
| CRC: Colorectal cancer | ||
| Colorectum (HTA11) | 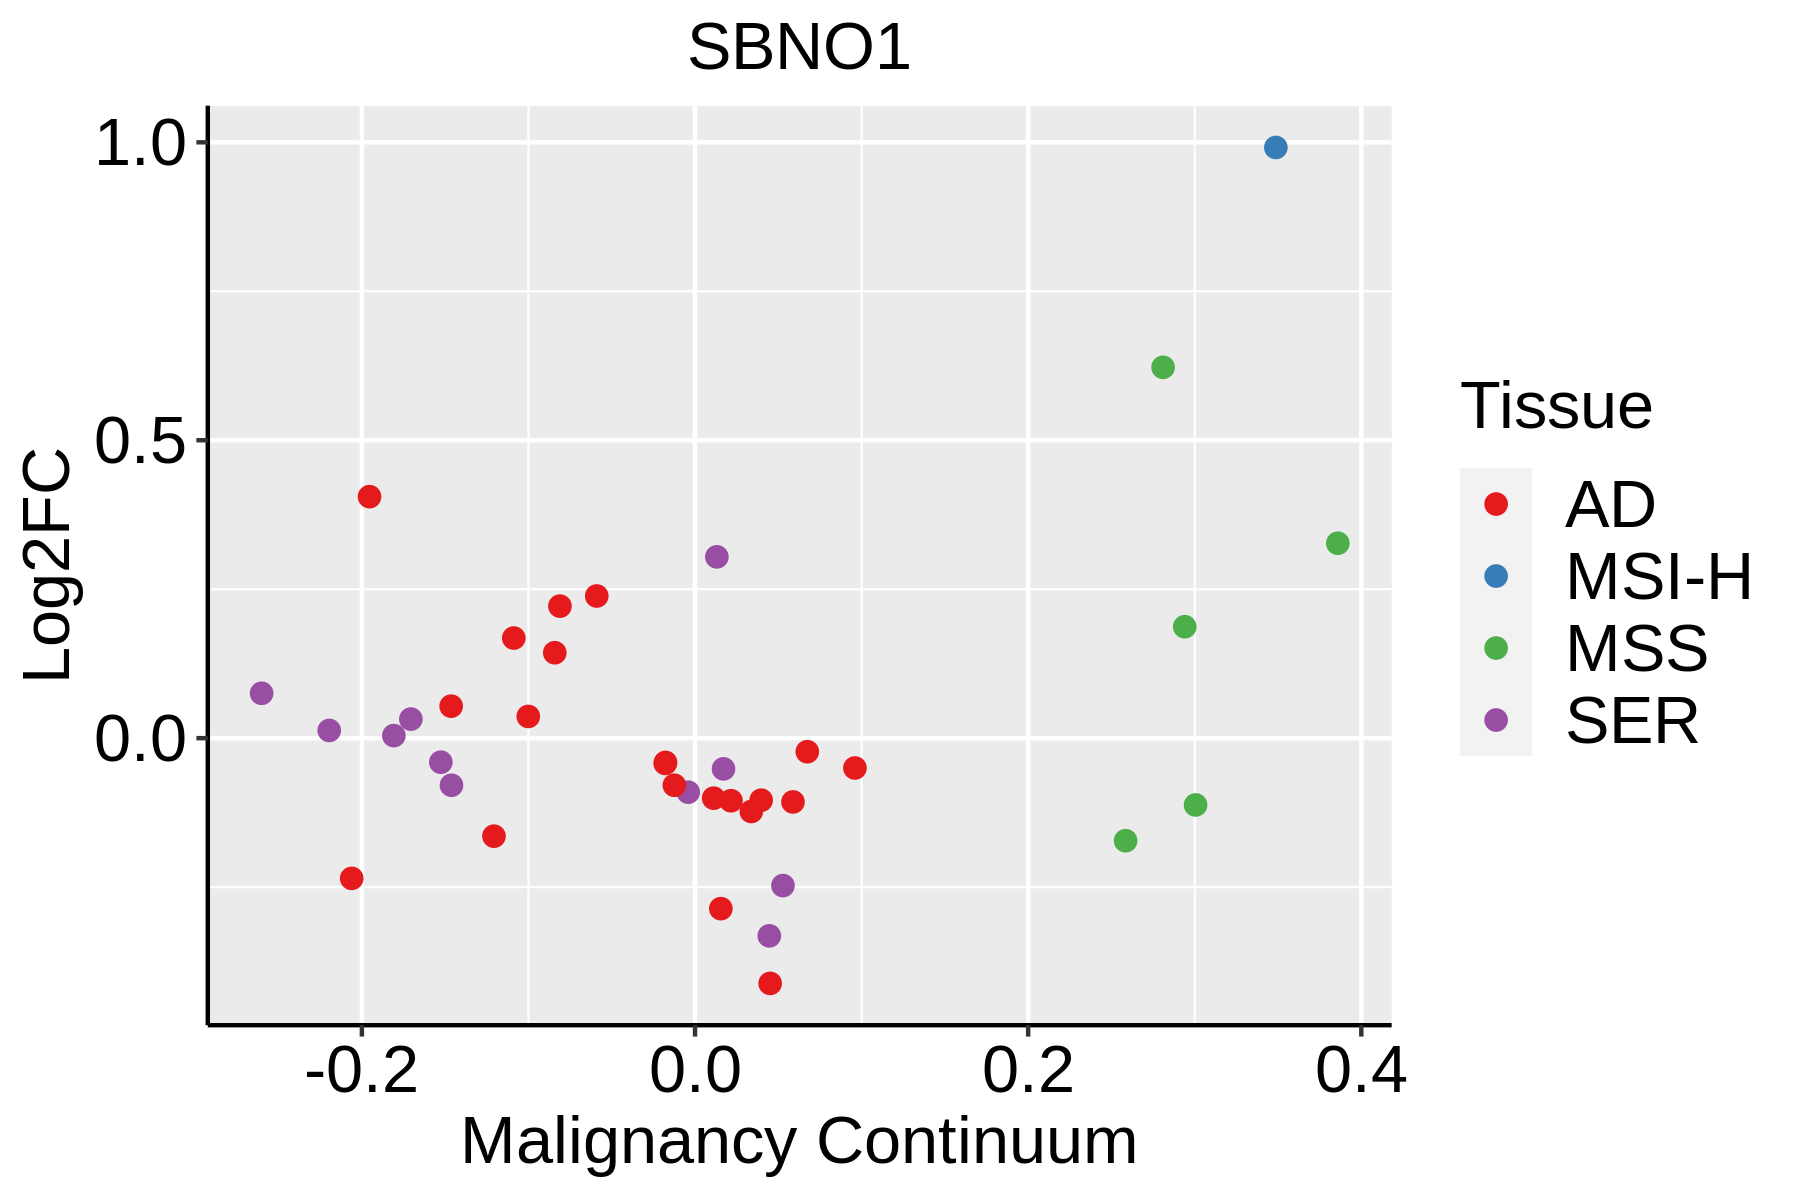 | AD: Adenomas |
| SER: Sessile serrated lesions | ||
| MSI-H: Microsatellite-high colorectal cancer | ||
| MSS: Microsatellite stable colorectal cancer | ||
| Esophagus | 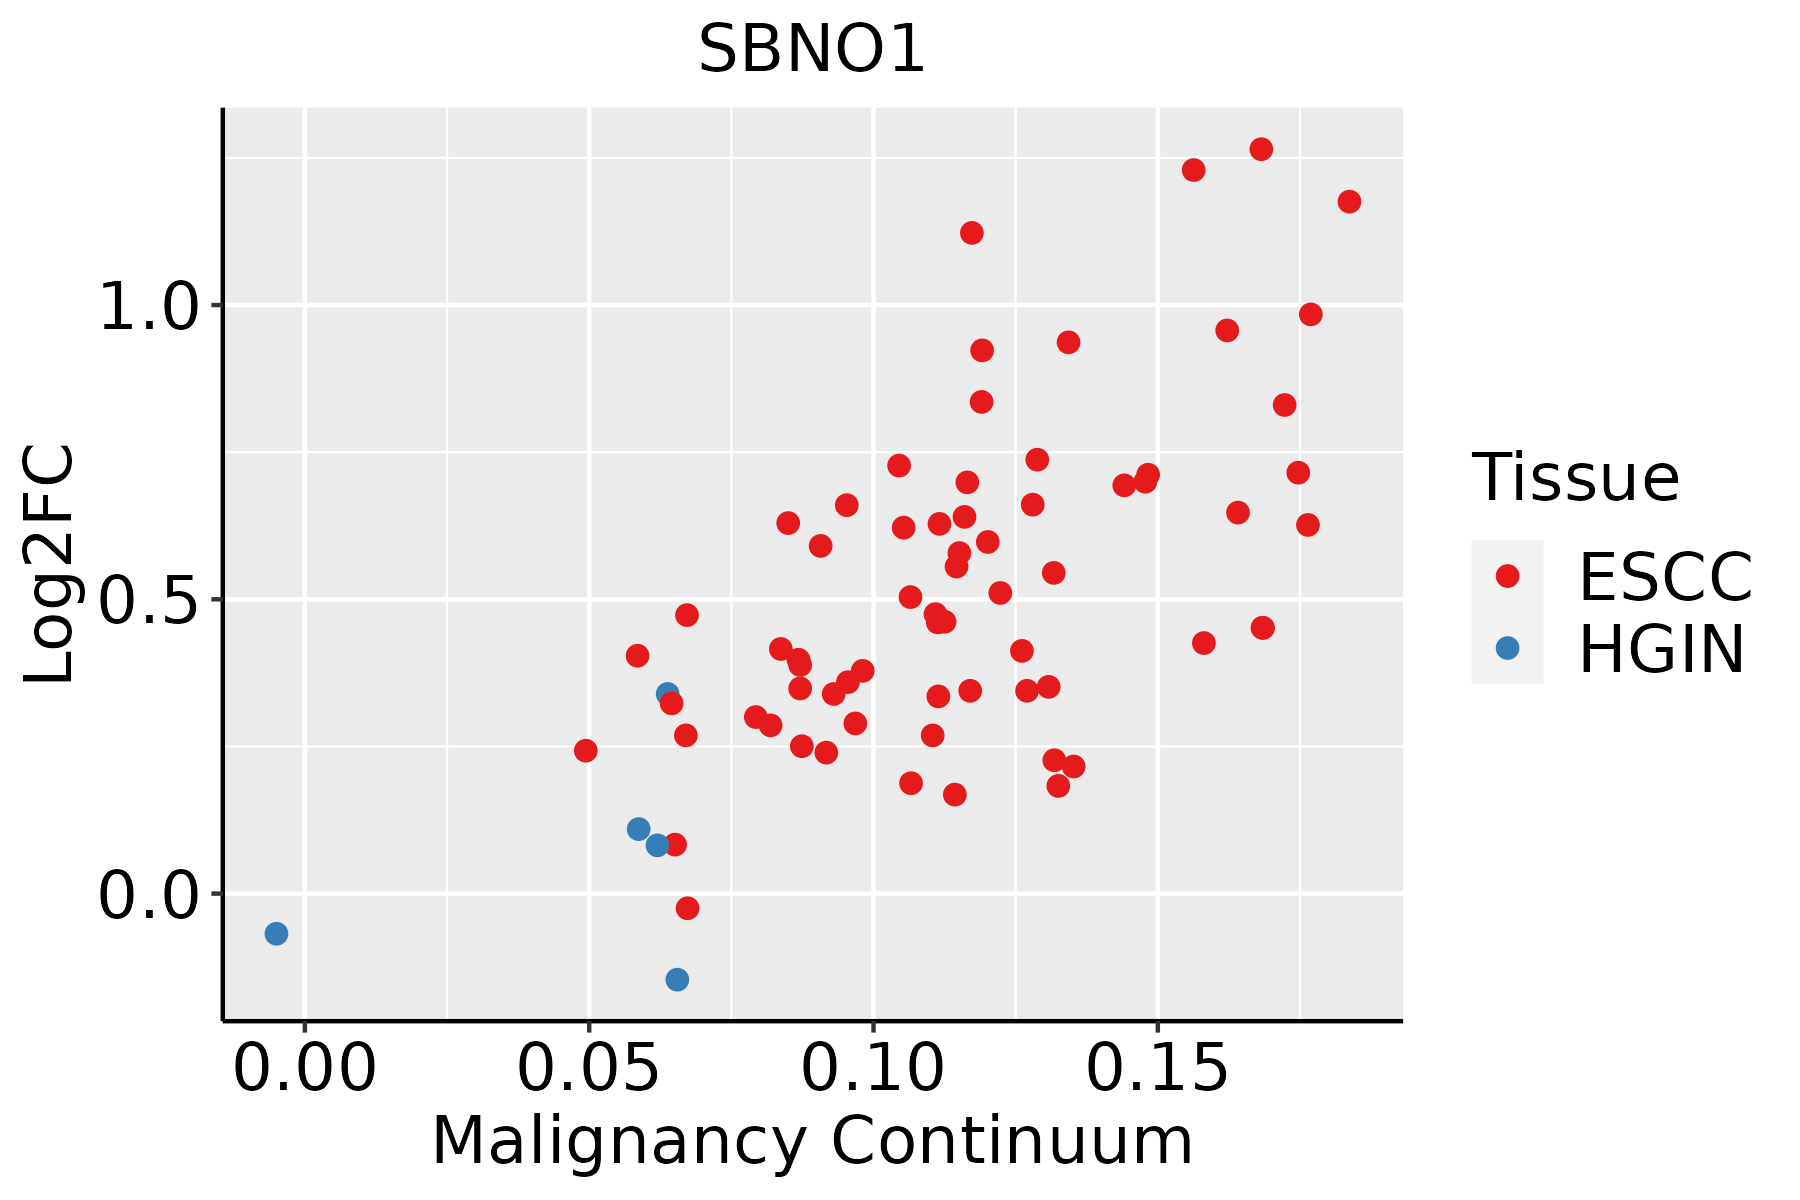 | ESCC: Esophageal squamous cell carcinoma |
| HGIN: High-grade intraepithelial neoplasias | ||
| LGIN: Low-grade intraepithelial neoplasias | ||
| Liver | 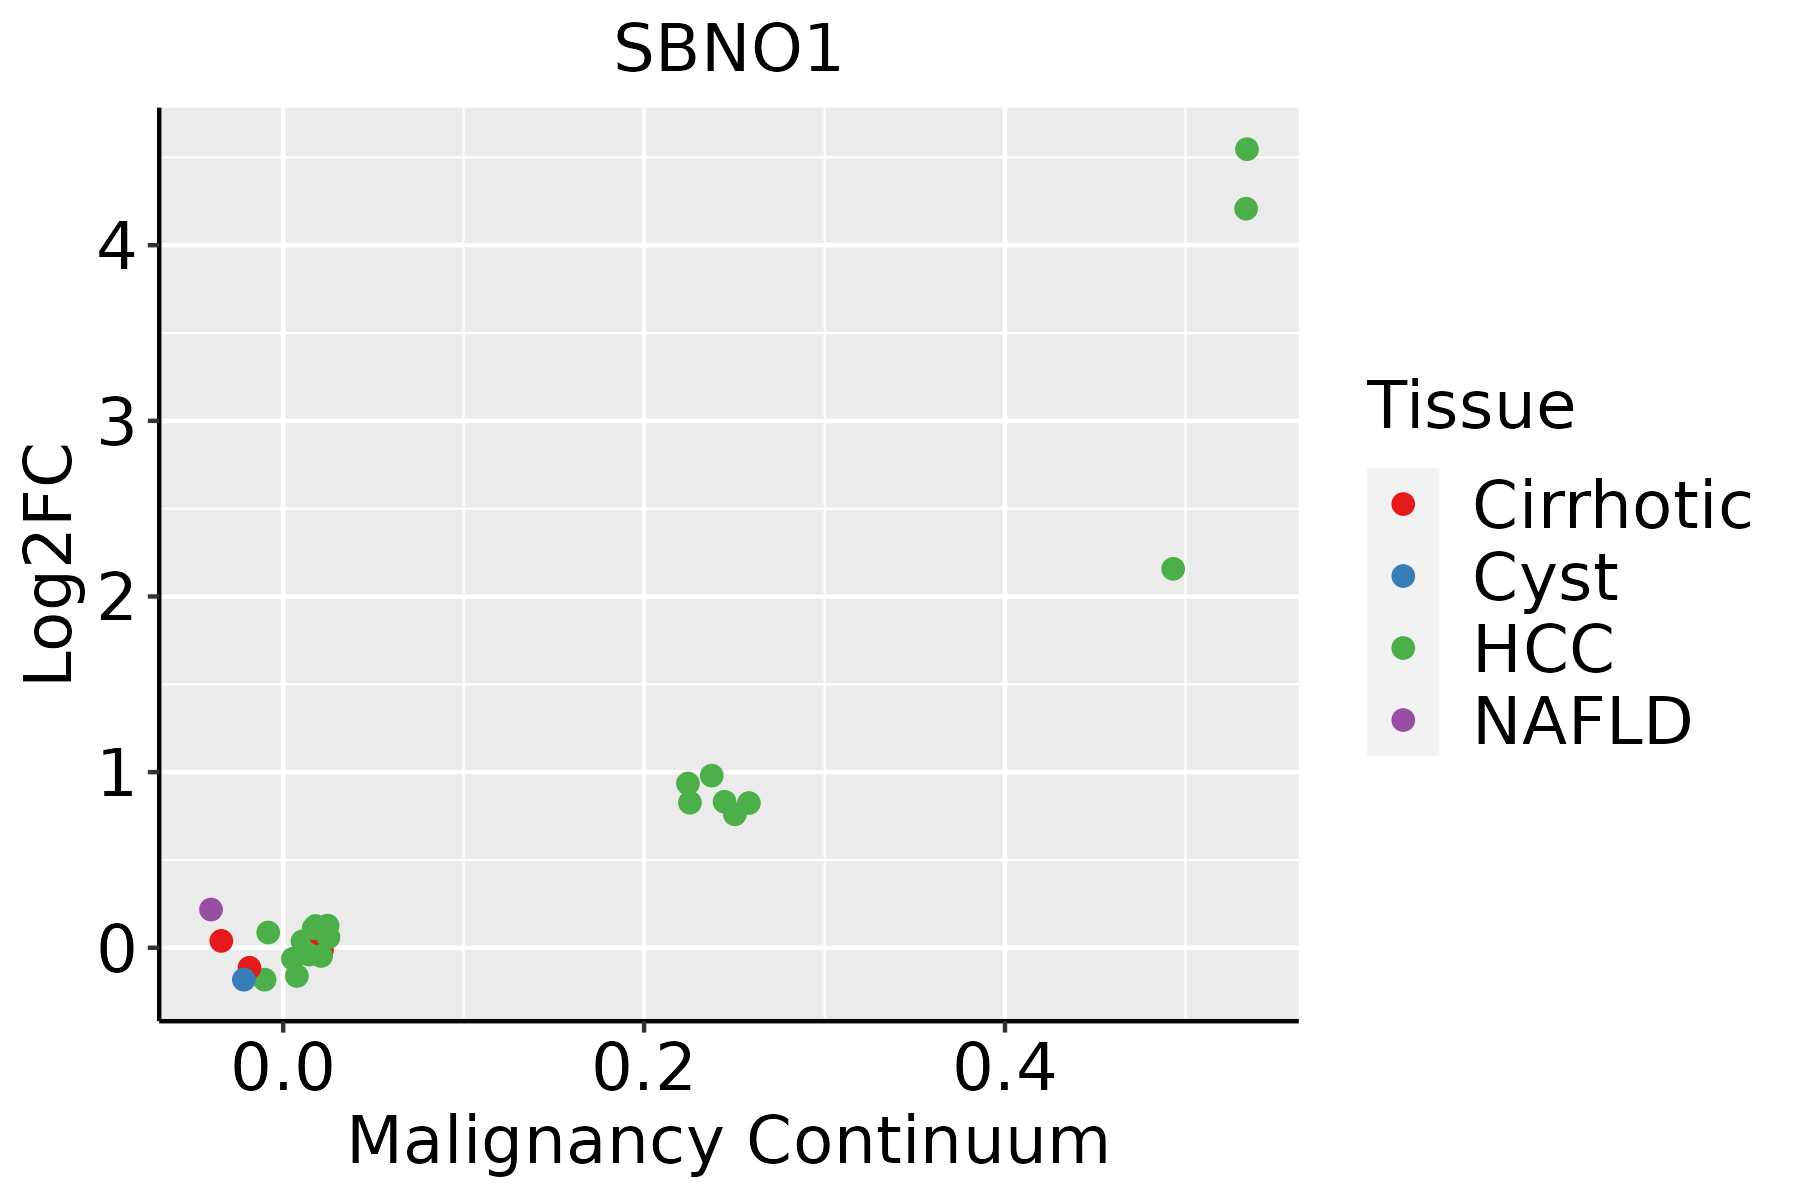 | HCC: Hepatocellular carcinoma |
| NAFLD: Non-alcoholic fatty liver disease | ||
| Oral Cavity | 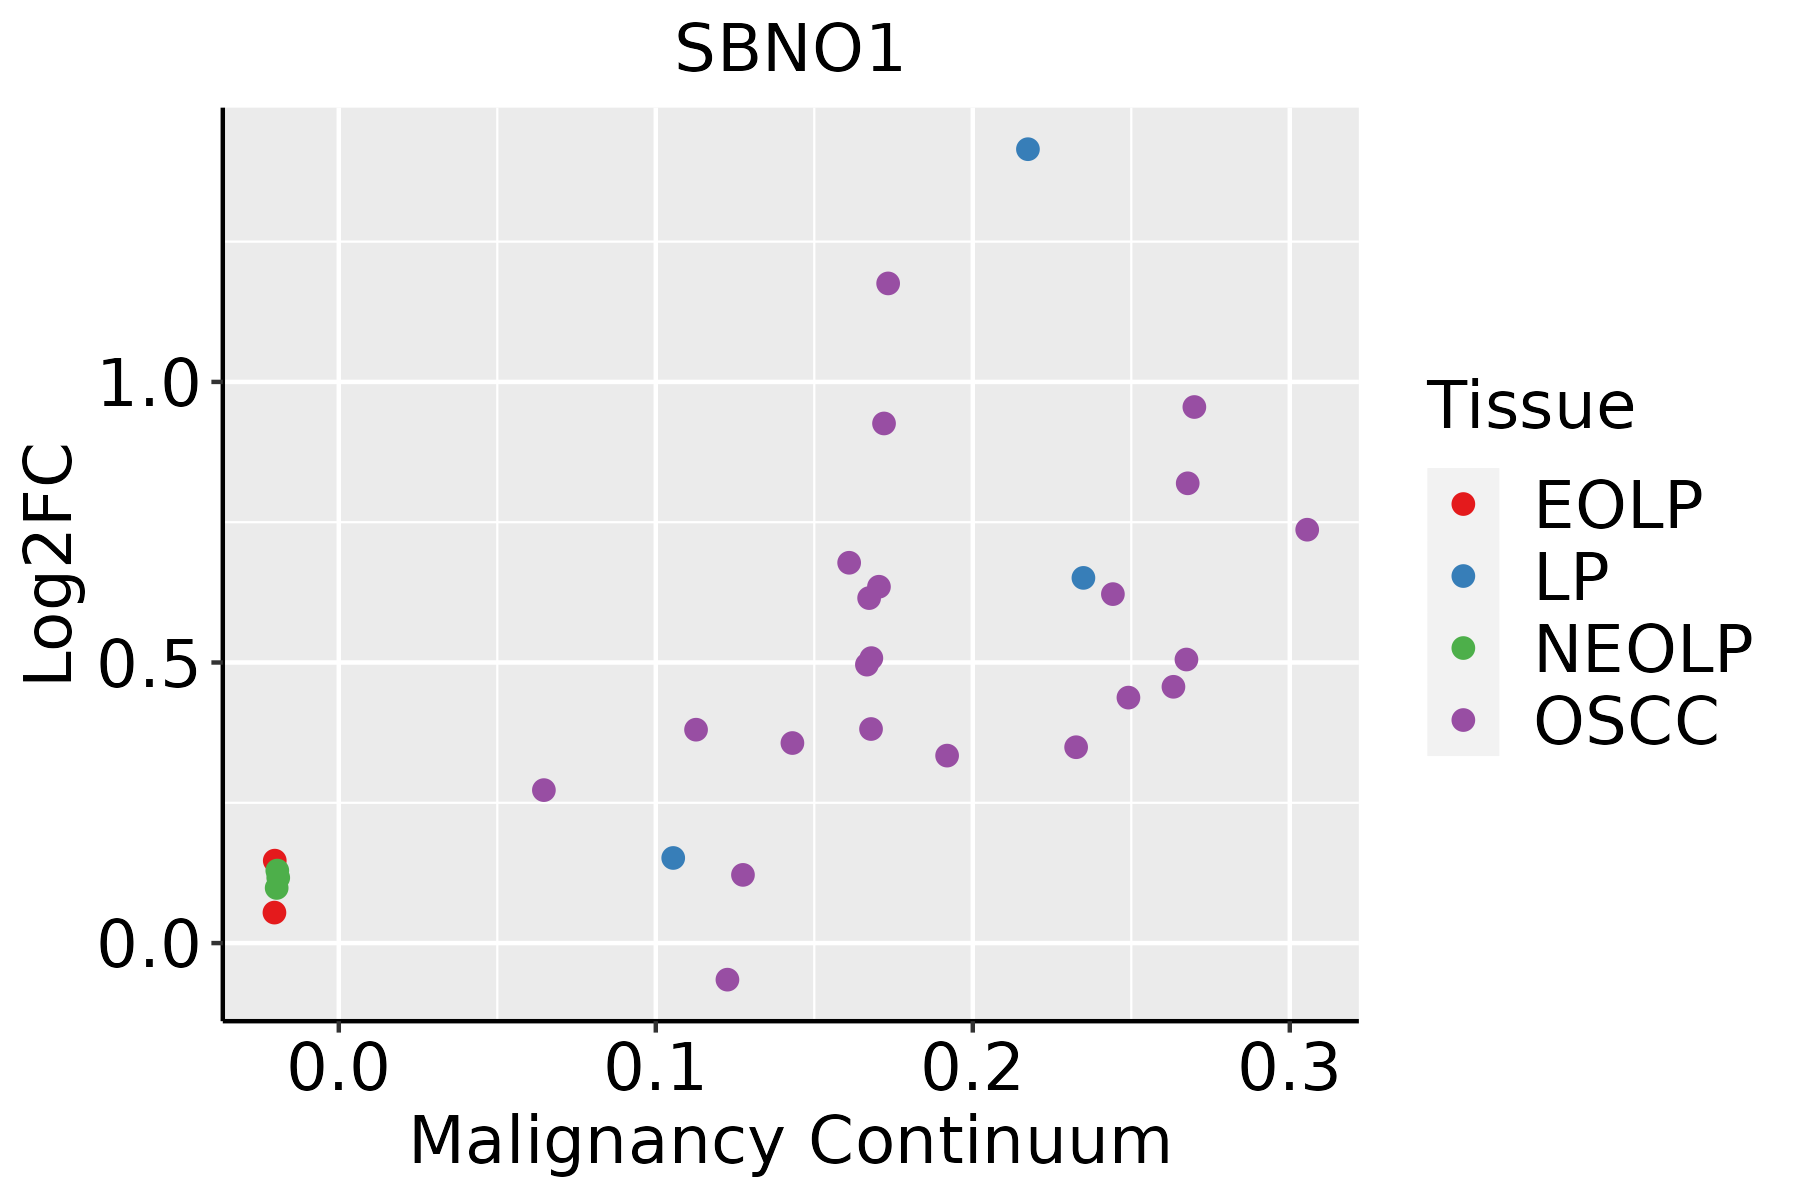 | EOLP: Erosive Oral lichen planus |
| LP: leukoplakia | ||
| NEOLP: Non-erosive oral lichen planus | ||
| OSCC: Oral squamous cell carcinoma | ||
| Skin |  | AK: Actinic keratosis |
| cSCC: Cutaneous squamous cell carcinoma | ||
| SCCIS:squamous cell carcinoma in situ | ||
| Thyroid | 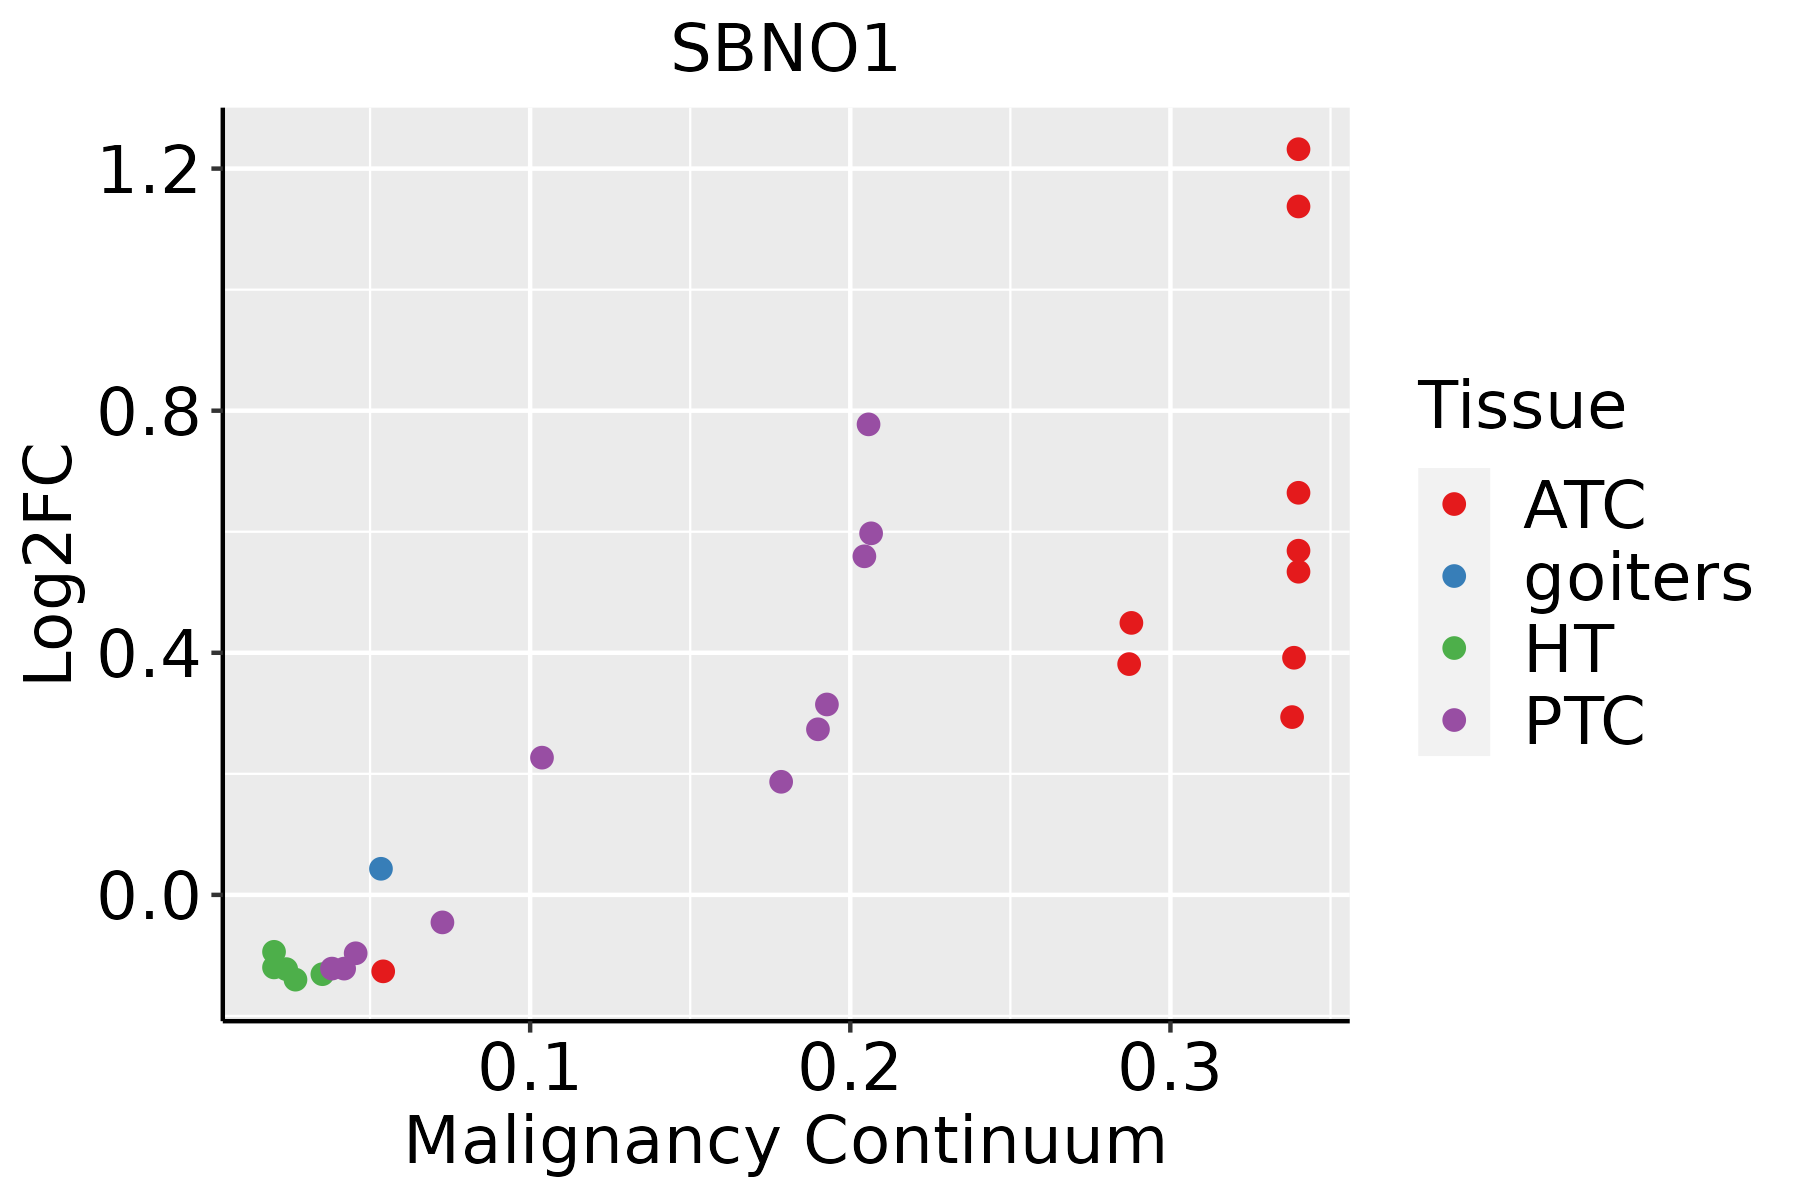 | ATC: Anaplastic thyroid cancer |
| HT: Hashimoto's thyroiditis | ||
| PTC: Papillary thyroid cancer |
| ∗log2FC in expression of this searched gene in stem-like cells from each diseased tissue sample relative to stem-like cells in normal samples in each tissue plotted against the malignancy continuum. Samples are colored based on if they are from different disease stage. |
Top |
Malignant transformation related pathway analysis |
| Find out the enriched GO biological processes and KEGG pathways involved in transition from healthy to precancer to cancer |
| Tissue | Disease Stage | Enriched GO biological Processes |
| Colorectum | AD |  |
| Colorectum | SER |  |
| Colorectum | MSS |  |
| Colorectum | MSI-H |  |
| Colorectum | FAP |  |
| ∗Top 15 enriched GO BP terms are showed in the bar plot of each disease state in each tissue. Each row represents a significant GO biological process which is colored according to the -log10(p.adjust). |
| Page: 1 2 3 4 5 6 7 8 9 |
| GO ID | Tissue | Disease Stage | Description | Gene Ratio | Bg Ratio | pvalue | p.adjust | Count |
| Page: 1 |
| Pathway ID | Tissue | Disease Stage | Description | Gene Ratio | Bg Ratio | pvalue | p.adjust | qvalue | Count |
| Page: 1 |
Top |
Cell-cell communication analysis |
| Identification of potential cell-cell interactions between two cell types and their ligand-receptor pairs for different disease states |
| Ligand | Receptor | LRpair | Pathway | Tissue | Disease Stage |
| Page: 1 |
Top |
Single-cell gene regulatory network inference analysis |
| Find out the significant the regulons (TFs) and the target genes of each regulon across cell types for different disease states |
| TF | Cell Type | Tissue | Disease Stage | Target Gene | RSS | Regulon Activity |
| ∗The dot plots of a searched regulon are shown for all cell subpopulations in each disease state of each tissue based on the regulon specific score inferred using pySCENIC and by calculating the average expression. |
| Page: 1 |
Top |
Somatic mutation of malignant transformation related genes |
| Annotation of somatic variants for genes involved in malignant transformation |
| Hugo Symbol | Variant Class | Variant Classification | dbSNP RS | HGVSc | HGVSp | HGVSp Short | SWISSPROT | BIOTYPE | SIFT | PolyPhen | Tumor Sample Barcode | Tissue | Histology | Sex | Age | Stage | Therapy Types | Drugs | Outcome |
| SBNO1 | SNV | Missense_Mutation | c.3455N>C | p.Gly1152Ala | p.G1152A | A3KN83 | protein_coding | tolerated(0.17) | benign(0.057) | TCGA-A1-A0SO-01 | Breast | breast invasive carcinoma | Female | >=65 | I/II | Chemotherapy | SD | ||
| SBNO1 | SNV | Missense_Mutation | c.1601N>A | p.Arg534Gln | p.R534Q | A3KN83 | protein_coding | deleterious(0) | probably_damaging(0.999) | TCGA-A8-A0A9-01 | Breast | breast invasive carcinoma | Female | >=65 | I/II | Hormone Therapy | anastrozole | SD | |
| SBNO1 | SNV | Missense_Mutation | c.2533N>G | p.Gln845Glu | p.Q845E | A3KN83 | protein_coding | tolerated(0.62) | benign(0.025) | TCGA-AC-A23H-01 | Breast | breast invasive carcinoma | Female | >=65 | I/II | Unknown | Unknown | PD | |
| SBNO1 | SNV | Missense_Mutation | c.2288N>A | p.Pro763Gln | p.P763Q | A3KN83 | protein_coding | deleterious(0.03) | probably_damaging(0.982) | TCGA-AC-A23H-01 | Breast | breast invasive carcinoma | Female | >=65 | I/II | Unknown | Unknown | PD | |
| SBNO1 | SNV | Missense_Mutation | novel | c.868N>G | p.Leu290Val | p.L290V | A3KN83 | protein_coding | deleterious(0) | possibly_damaging(0.888) | TCGA-BH-A1F2-01 | Breast | breast invasive carcinoma | Female | <65 | III/IV | Unknown | Unknown | SD |
| SBNO1 | SNV | Missense_Mutation | c.637N>G | p.Phe213Val | p.F213V | A3KN83 | protein_coding | tolerated(0.08) | benign(0.13) | TCGA-BH-A1FC-01 | Breast | breast invasive carcinoma | Female | >=65 | I/II | Unknown | Unknown | SD | |
| SBNO1 | SNV | Missense_Mutation | c.1000N>C | p.Ile334Leu | p.I334L | A3KN83 | protein_coding | tolerated(0.24) | benign(0.074) | TCGA-D8-A1JG-01 | Breast | breast invasive carcinoma | Female | <65 | I/II | Chemotherapy | doxorubicin | SD | |
| SBNO1 | SNV | Missense_Mutation | c.3212N>A | p.Phe1071Tyr | p.F1071Y | A3KN83 | protein_coding | deleterious(0) | probably_damaging(0.926) | TCGA-D8-A1Y0-01 | Breast | breast invasive carcinoma | Female | >=65 | III/IV | Chemotherapy | cyclophosphamide+methotrexatum+fluorouracillum | SD | |
| SBNO1 | SNV | Missense_Mutation | novel | c.868N>G | p.Leu290Val | p.L290V | A3KN83 | protein_coding | deleterious(0) | possibly_damaging(0.888) | TCGA-D8-A1Y1-01 | Breast | breast invasive carcinoma | Female | >=65 | III/IV | Hormone Therapy | tamoxiphen | PD |
| SBNO1 | SNV | Missense_Mutation | novel | c.2935G>A | p.Gly979Arg | p.G979R | A3KN83 | protein_coding | deleterious(0) | probably_damaging(1) | TCGA-OL-A66J-01 | Breast | breast invasive carcinoma | Female | >=65 | I/II | Unknown | Unknown | SD |
| Page: 1 2 3 4 5 6 7 8 9 10 11 12 13 14 15 |
Top |
Related drugs of malignant transformation related genes |
| Identification of chemicals and drugs interact with genes involved in malignant transfromation |
| (DGIdb 4.0) |
| Entrez ID | Symbol | Category | Interaction Types | Drug Claim Name | Drug Name | PMIDs |
| Page: 1 |

Copyright 2023-Present -The University of Texas Health Science Center at Houston |