
|
|||||
|
 | |
| |
| |
| |
| |
| |
|
Gene: RSRP1 |
Gene summary for RSRP1 |
| Gene information | Species | Human | Gene symbol | RSRP1 | Gene ID | 57035 |
| Gene name | arginine and serine rich protein 1 | |
| Gene Alias | C1orf63 | |
| Cytomap | 1p36.11 | |
| Gene Type | protein-coding | GO ID | GO:0003674 | UniProtAcc | A0A024RAH6 |
Top |
Malignant transformation analysis |
| Identification of the aberrant gene expression in precancerous and cancerous lesions by comparing the gene expression of stem-like cells in diseased tissues with normal stem cells |
| Entrez ID | Symbol | Replicates | Species | Organ | Tissue | Adj P-value | Log2FC | Malignancy |
| 57035 | RSRP1 | P20T-E | Human | Esophagus | ESCC | 3.42e-61 | 1.80e+00 | 0.1124 |
| 57035 | RSRP1 | P21T-E | Human | Esophagus | ESCC | 9.10e-29 | 8.09e-01 | 0.1617 |
| 57035 | RSRP1 | P22T-E | Human | Esophagus | ESCC | 3.37e-31 | 6.74e-01 | 0.1236 |
| 57035 | RSRP1 | P23T-E | Human | Esophagus | ESCC | 7.50e-46 | 1.43e+00 | 0.108 |
| 57035 | RSRP1 | P24T-E | Human | Esophagus | ESCC | 2.28e-23 | 6.22e-01 | 0.1287 |
| 57035 | RSRP1 | P26T-E | Human | Esophagus | ESCC | 5.10e-37 | 7.73e-01 | 0.1276 |
| 57035 | RSRP1 | P27T-E | Human | Esophagus | ESCC | 8.45e-83 | 1.90e+00 | 0.1055 |
| 57035 | RSRP1 | P28T-E | Human | Esophagus | ESCC | 1.28e-60 | 1.34e+00 | 0.1149 |
| 57035 | RSRP1 | P30T-E | Human | Esophagus | ESCC | 4.08e-29 | 1.19e+00 | 0.137 |
| 57035 | RSRP1 | P31T-E | Human | Esophagus | ESCC | 1.06e-51 | 9.72e-01 | 0.1251 |
| 57035 | RSRP1 | P32T-E | Human | Esophagus | ESCC | 3.31e-34 | 8.76e-01 | 0.1666 |
| 57035 | RSRP1 | P36T-E | Human | Esophagus | ESCC | 5.12e-42 | 1.46e+00 | 0.1187 |
| 57035 | RSRP1 | P37T-E | Human | Esophagus | ESCC | 3.29e-44 | 9.92e-01 | 0.1371 |
| 57035 | RSRP1 | P38T-E | Human | Esophagus | ESCC | 2.79e-03 | 4.53e-02 | 0.127 |
| 57035 | RSRP1 | P39T-E | Human | Esophagus | ESCC | 1.68e-18 | 5.48e-01 | 0.0894 |
| 57035 | RSRP1 | P40T-E | Human | Esophagus | ESCC | 1.75e-18 | 7.31e-01 | 0.109 |
| 57035 | RSRP1 | P42T-E | Human | Esophagus | ESCC | 1.25e-40 | 1.29e+00 | 0.1175 |
| 57035 | RSRP1 | P44T-E | Human | Esophagus | ESCC | 2.24e-18 | 7.14e-01 | 0.1096 |
| 57035 | RSRP1 | P47T-E | Human | Esophagus | ESCC | 2.85e-49 | 1.11e+00 | 0.1067 |
| 57035 | RSRP1 | P48T-E | Human | Esophagus | ESCC | 2.48e-60 | 1.24e+00 | 0.0959 |
| Page: 1 2 3 4 5 6 7 8 9 10 11 12 |
| Tissue | Expression Dynamics | Abbreviation |
| Breast | 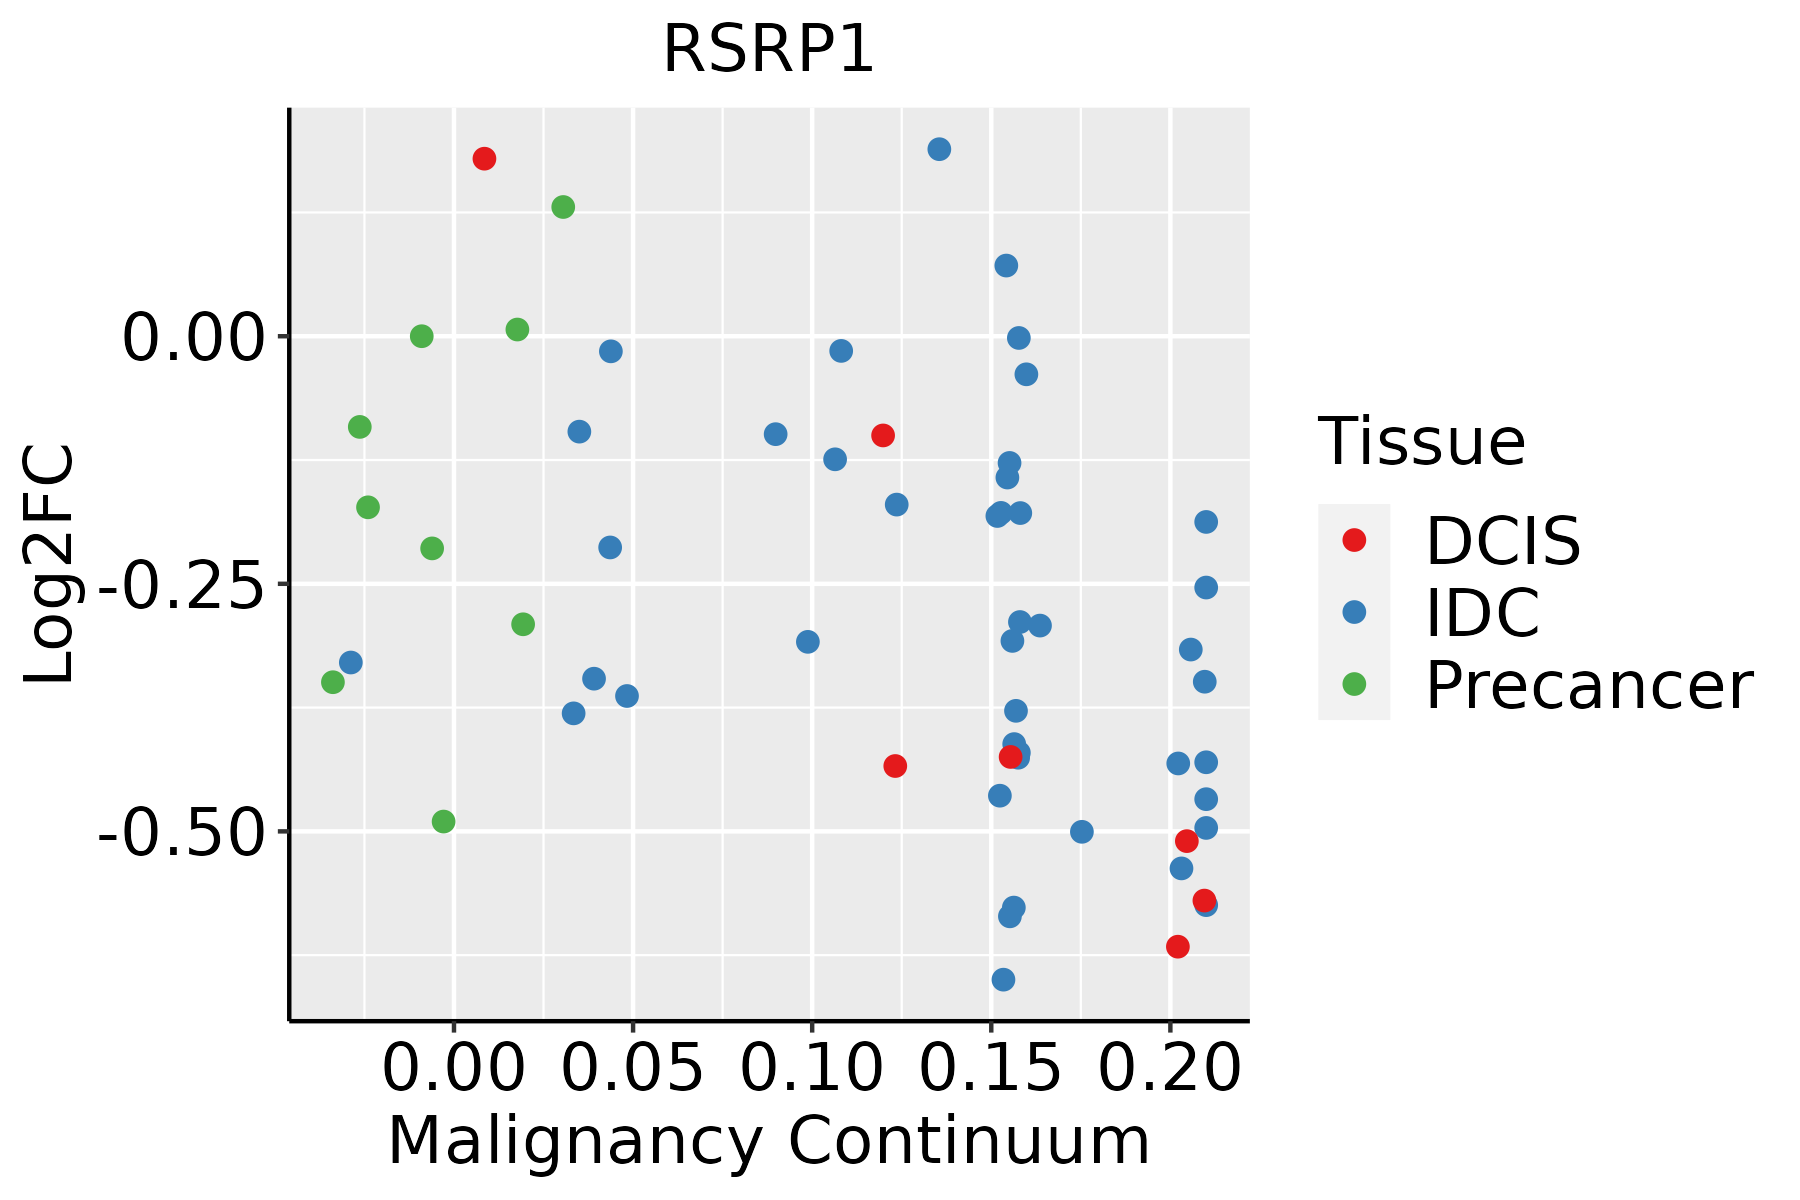 | IDC: Invasive ductal carcinoma |
| DCIS: Ductal carcinoma in situ | ||
| Precancer(BRCA1-mut): Precancerous lesion from BRCA1 mutation carriers | ||
| Endometrium | 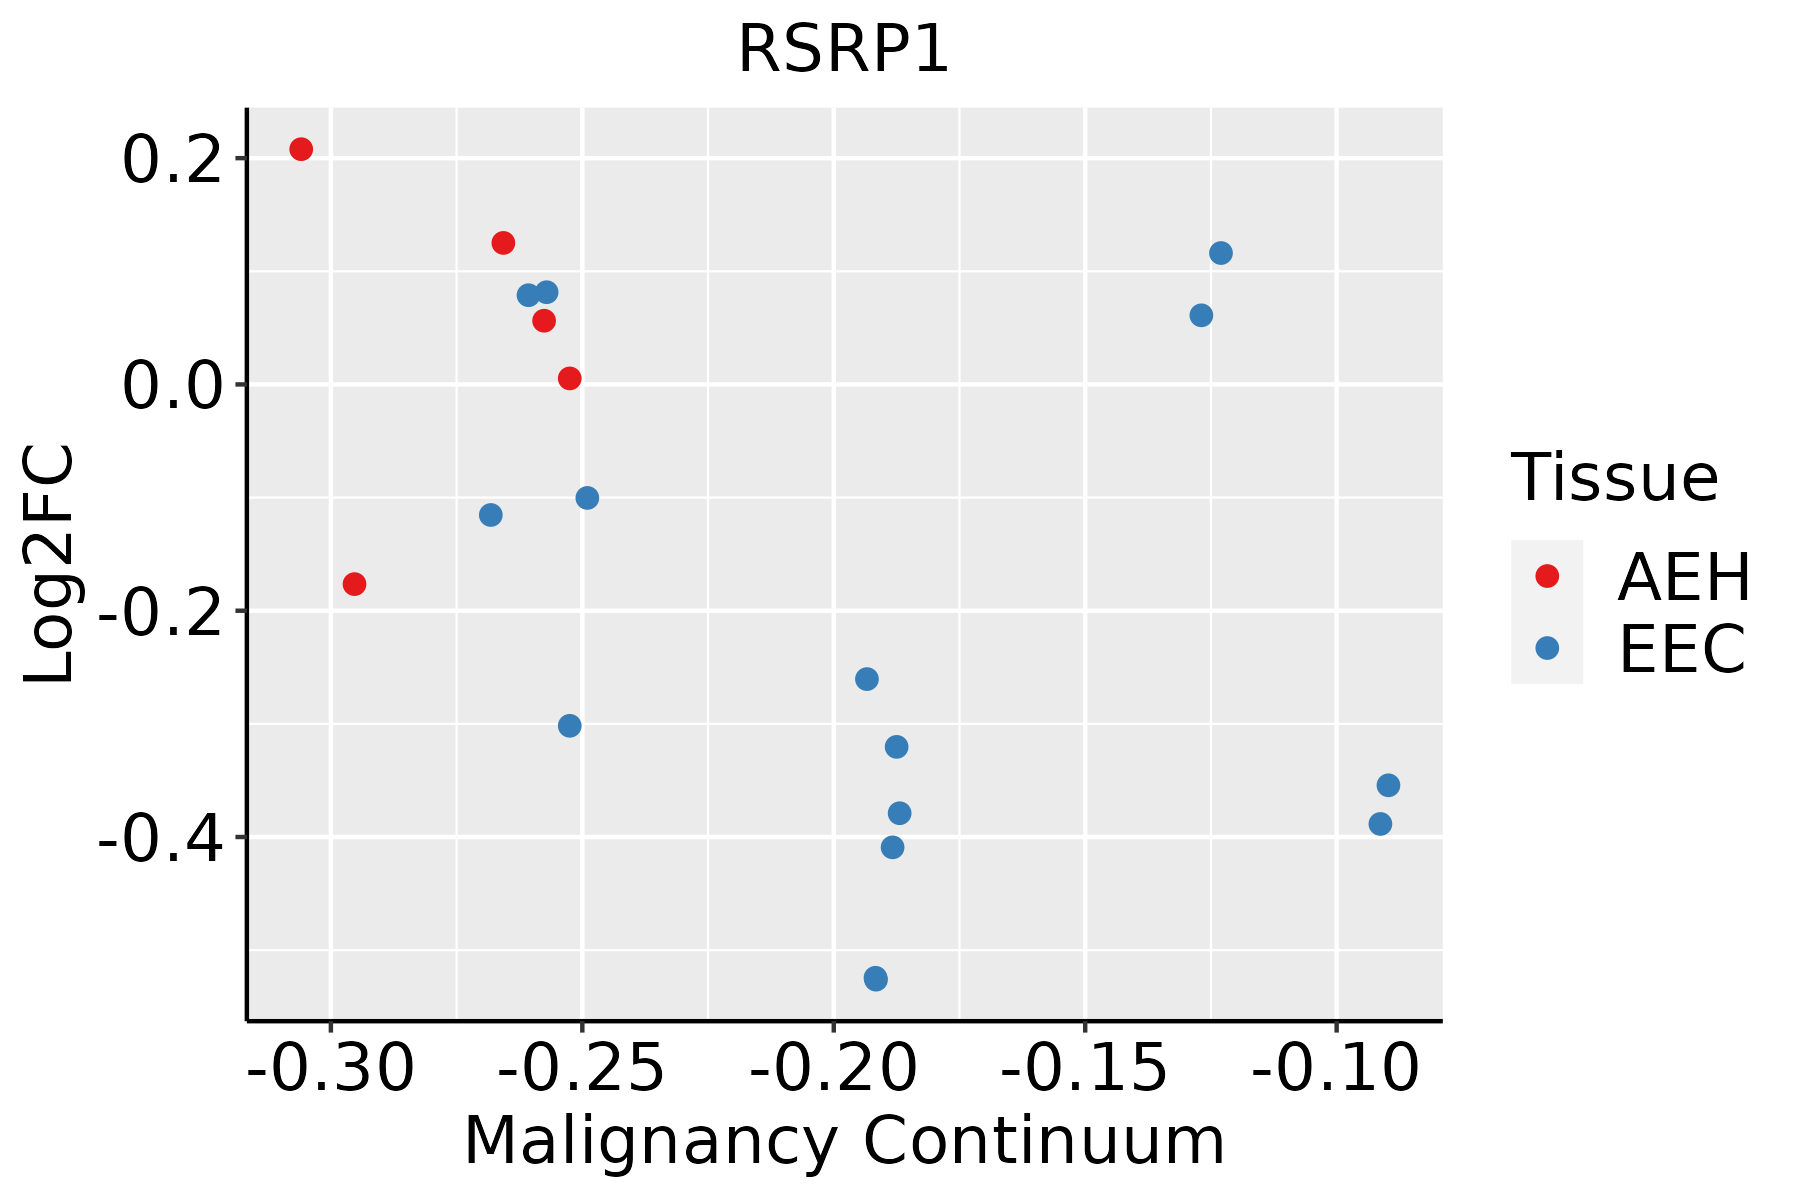 | AEH: Atypical endometrial hyperplasia |
| EEC: Endometrioid Cancer | ||
| Esophagus |  | ESCC: Esophageal squamous cell carcinoma |
| HGIN: High-grade intraepithelial neoplasias | ||
| LGIN: Low-grade intraepithelial neoplasias | ||
| Liver | 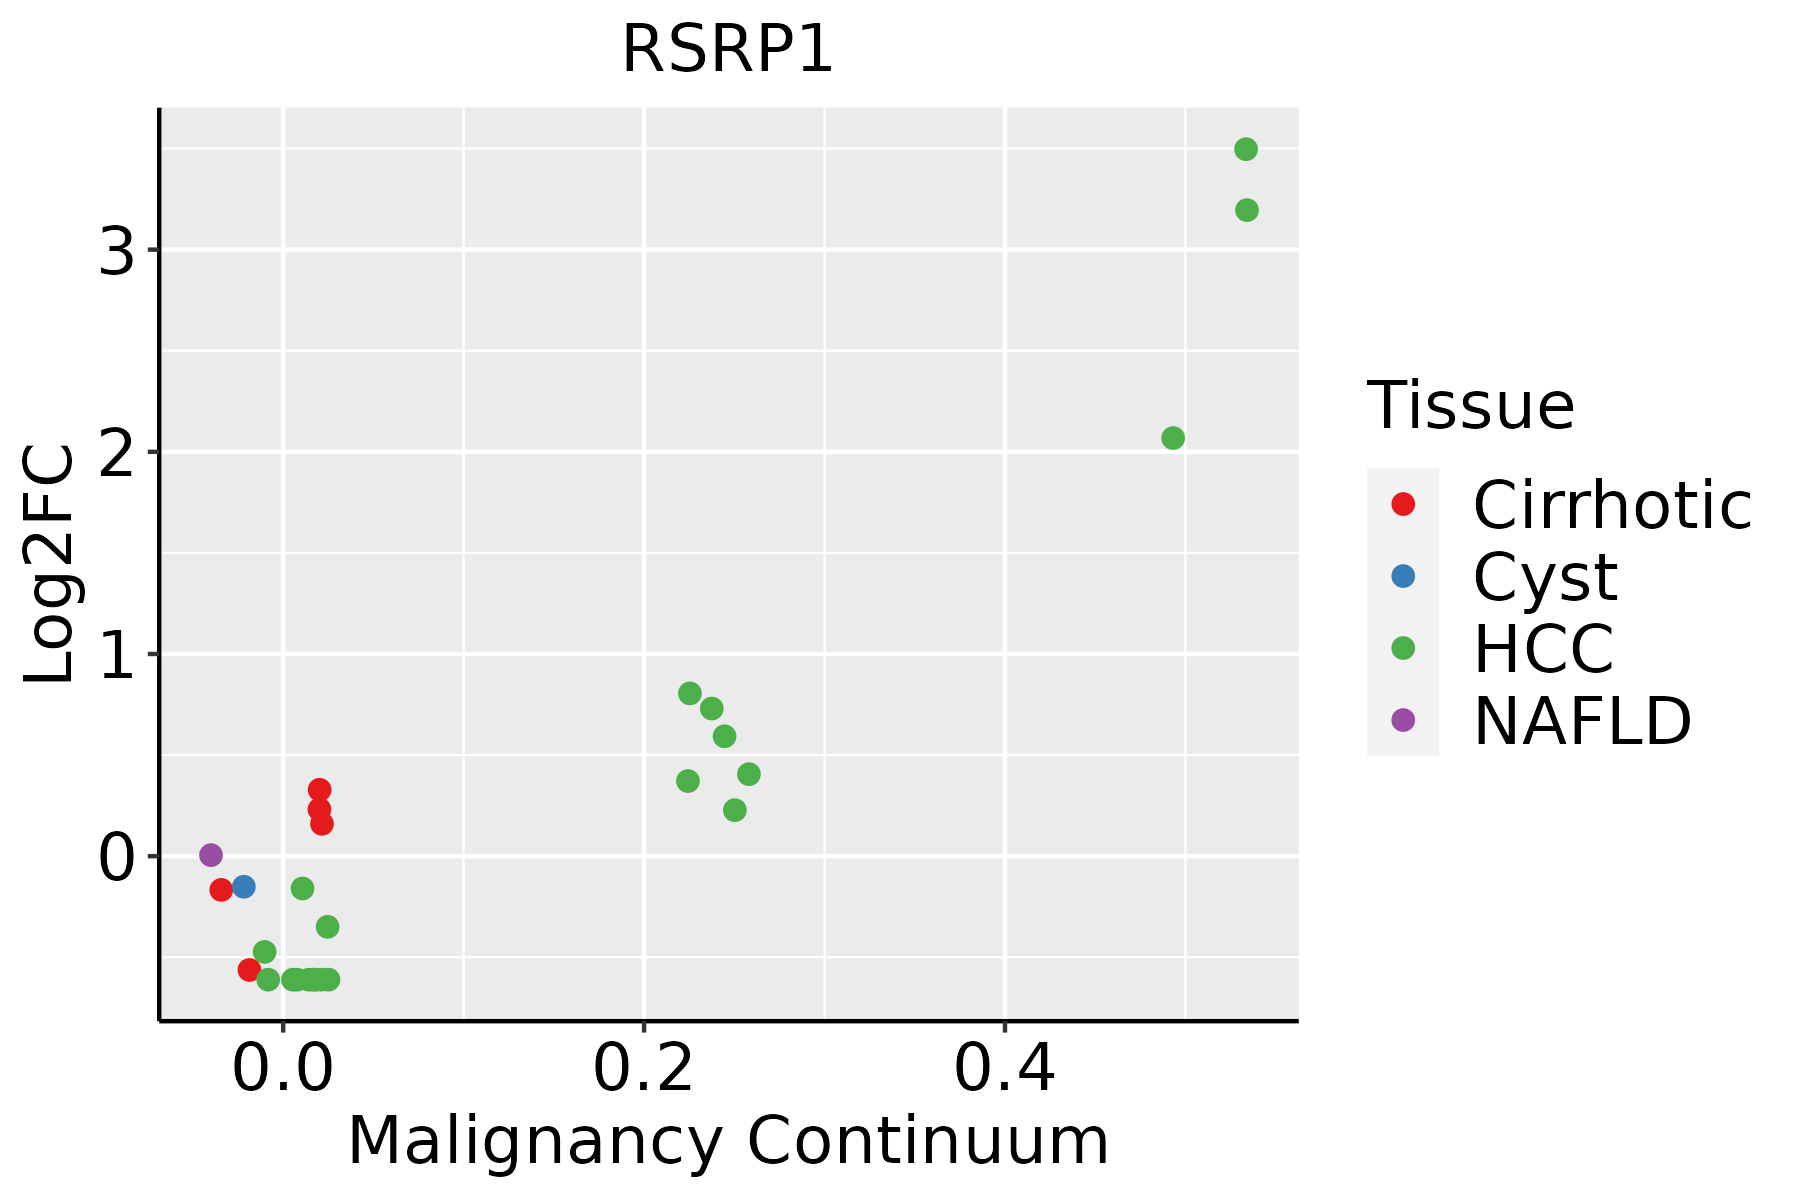 | HCC: Hepatocellular carcinoma |
| NAFLD: Non-alcoholic fatty liver disease | ||
| Lung | 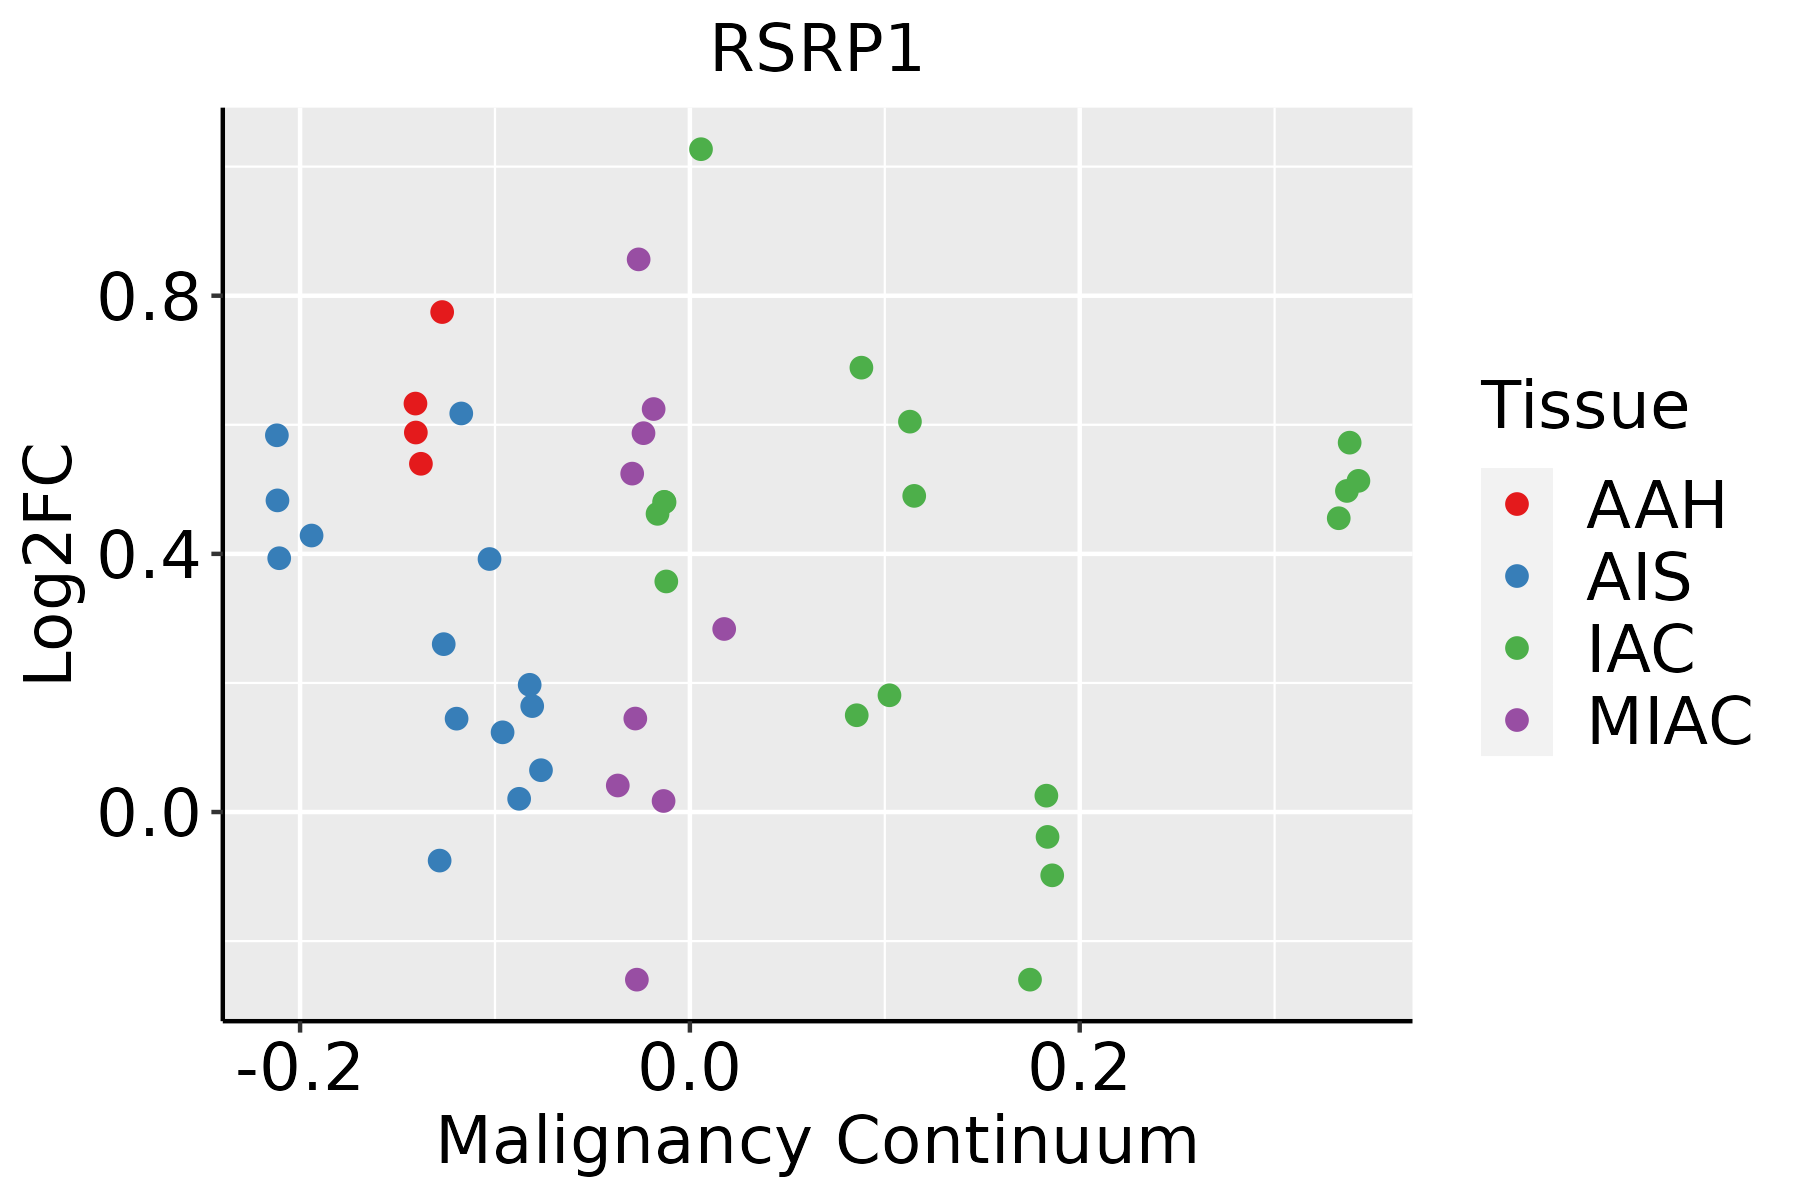 | AAH: Atypical adenomatous hyperplasia |
| AIS: Adenocarcinoma in situ | ||
| IAC: Invasive lung adenocarcinoma | ||
| MIA: Minimally invasive adenocarcinoma | ||
| Oral Cavity |  | EOLP: Erosive Oral lichen planus |
| LP: leukoplakia | ||
| NEOLP: Non-erosive oral lichen planus | ||
| OSCC: Oral squamous cell carcinoma | ||
| Prostate |  | BPH: Benign Prostatic Hyperplasia |
| Skin | 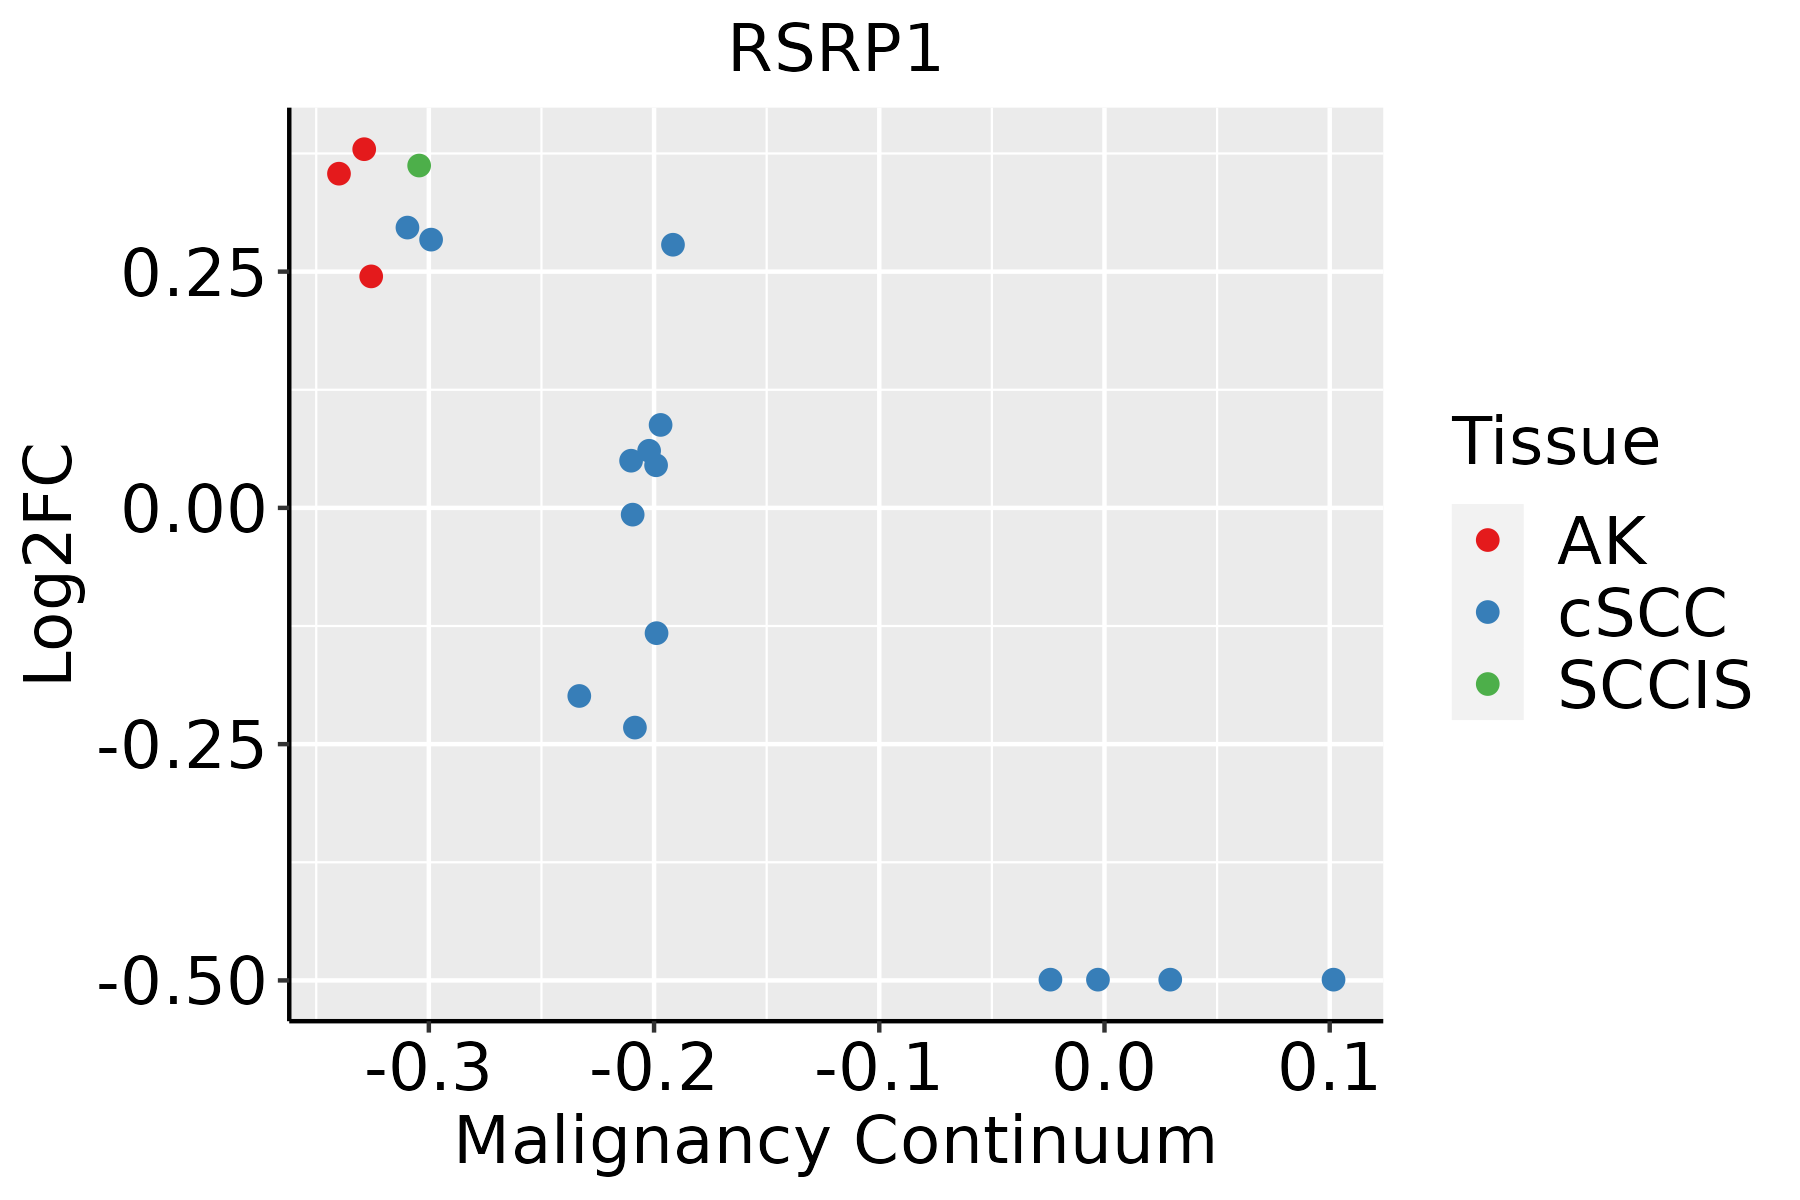 | AK: Actinic keratosis |
| cSCC: Cutaneous squamous cell carcinoma | ||
| SCCIS:squamous cell carcinoma in situ | ||
| Thyroid |  | ATC: Anaplastic thyroid cancer |
| HT: Hashimoto's thyroiditis | ||
| PTC: Papillary thyroid cancer |
| ∗log2FC in expression of this searched gene in stem-like cells from each diseased tissue sample relative to stem-like cells in normal samples in each tissue plotted against the malignancy continuum. Samples are colored based on if they are from different disease stage. |
Top |
Malignant transformation related pathway analysis |
| Find out the enriched GO biological processes and KEGG pathways involved in transition from healthy to precancer to cancer |
| Tissue | Disease Stage | Enriched GO biological Processes |
| Colorectum | AD |  |
| Colorectum | SER |  |
| Colorectum | MSS |  |
| Colorectum | MSI-H |  |
| Colorectum | FAP |  |
| ∗Top 15 enriched GO BP terms are showed in the bar plot of each disease state in each tissue. Each row represents a significant GO biological process which is colored according to the -log10(p.adjust). |
| Page: 1 2 3 4 5 6 7 8 9 |
| GO ID | Tissue | Disease Stage | Description | Gene Ratio | Bg Ratio | pvalue | p.adjust | Count |
| Page: 1 |
| Pathway ID | Tissue | Disease Stage | Description | Gene Ratio | Bg Ratio | pvalue | p.adjust | qvalue | Count |
| Page: 1 |
Top |
Cell-cell communication analysis |
| Identification of potential cell-cell interactions between two cell types and their ligand-receptor pairs for different disease states |
| Ligand | Receptor | LRpair | Pathway | Tissue | Disease Stage |
| Page: 1 |
Top |
Single-cell gene regulatory network inference analysis |
| Find out the significant the regulons (TFs) and the target genes of each regulon across cell types for different disease states |
| TF | Cell Type | Tissue | Disease Stage | Target Gene | RSS | Regulon Activity |
| ∗The dot plots of a searched regulon are shown for all cell subpopulations in each disease state of each tissue based on the regulon specific score inferred using pySCENIC and by calculating the average expression. |
| Page: 1 |
Top |
Somatic mutation of malignant transformation related genes |
| Annotation of somatic variants for genes involved in malignant transformation |
| Hugo Symbol | Variant Class | Variant Classification | dbSNP RS | HGVSc | HGVSp | HGVSp Short | SWISSPROT | BIOTYPE | SIFT | PolyPhen | Tumor Sample Barcode | Tissue | Histology | Sex | Age | Stage | Therapy Types | Drugs | Outcome |
| RSRP1 | SNV | Missense_Mutation | c.215N>A | p.Arg72Gln | p.R72Q | Q9BUV0 | protein_coding | deleterious_low_confidence(0.01) | probably_damaging(0.998) | TCGA-BH-A0HF-01 | Breast | breast invasive carcinoma | Female | >=65 | I/II | Hormone Therapy | arimidex | SD | |
| RSRP1 | SNV | Missense_Mutation | c.364C>T | p.Arg122Trp | p.R122W | Q9BUV0 | protein_coding | deleterious(0) | probably_damaging(0.969) | TCGA-AD-5900-01 | Colorectum | colon adenocarcinoma | Male | >=65 | I/II | Unknown | Unknown | SD | |
| RSRP1 | SNV | Missense_Mutation | c.419A>G | p.Tyr140Cys | p.Y140C | Q9BUV0 | protein_coding | deleterious(0) | probably_damaging(0.999) | TCGA-CK-5913-01 | Colorectum | colon adenocarcinoma | Female | <65 | I/II | Unknown | Unknown | SD | |
| RSRP1 | SNV | Missense_Mutation | c.794C>T | p.Ala265Val | p.A265V | Q9BUV0 | protein_coding | tolerated(0.29) | benign(0.046) | TCGA-CM-6168-01 | Colorectum | colon adenocarcinoma | Female | >=65 | I/II | Unknown | Unknown | SD | |
| RSRP1 | deletion | Frame_Shift_Del | rs754096516 | c.844delN | p.Ser282ValfsTer20 | p.S282Vfs*20 | Q9BUV0 | protein_coding | TCGA-CK-6746-01 | Colorectum | colon adenocarcinoma | Female | >=65 | I/II | Unknown | Unknown | SD | ||
| RSRP1 | SNV | Missense_Mutation | novel | c.447N>T | p.Glu149Asp | p.E149D | Q9BUV0 | protein_coding | deleterious(0.02) | possibly_damaging(0.826) | TCGA-A5-A0G1-01 | Endometrium | uterine corpus endometrioid carcinoma | Female | >=65 | I/II | Unknown | Unknown | SD |
| RSRP1 | SNV | Missense_Mutation | novel | c.447N>T | p.Glu149Asp | p.E149D | Q9BUV0 | protein_coding | deleterious(0.02) | possibly_damaging(0.826) | TCGA-A5-A0GG-01 | Endometrium | uterine corpus endometrioid carcinoma | Female | >=65 | I/II | Unknown | Unknown | SD |
| RSRP1 | SNV | Missense_Mutation | c.704G>A | p.Arg235Gln | p.R235Q | Q9BUV0 | protein_coding | deleterious(0.01) | benign(0.039) | TCGA-AP-A056-01 | Endometrium | uterine corpus endometrioid carcinoma | Female | <65 | I/II | Unknown | Unknown | SD | |
| RSRP1 | SNV | Missense_Mutation | rs746772570 | c.544N>A | p.Ala182Thr | p.A182T | Q9BUV0 | protein_coding | deleterious(0) | probably_damaging(0.998) | TCGA-AX-A05Z-01 | Endometrium | uterine corpus endometrioid carcinoma | Female | <65 | III/IV | Chemotherapy | adriamycin | SD |
| RSRP1 | SNV | Missense_Mutation | rs372977000 | c.560C>T | p.Ala187Val | p.A187V | Q9BUV0 | protein_coding | deleterious(0.01) | benign(0.191) | TCGA-AX-A2HC-01 | Endometrium | uterine corpus endometrioid carcinoma | Female | <65 | III/IV | Chemotherapy | paclitaxel | PD |
| Page: 1 2 |
Top |
Related drugs of malignant transformation related genes |
| Identification of chemicals and drugs interact with genes involved in malignant transfromation |
| (DGIdb 4.0) |
| Entrez ID | Symbol | Category | Interaction Types | Drug Claim Name | Drug Name | PMIDs |
| Page: 1 |

Copyright 2023-Present -The University of Texas Health Science Center at Houston |