
|
|||||
|
 | |
| |
| |
| |
| |
| |
|
Gene: RRM1 |
Gene summary for RRM1 |
| Gene information | Species | Human | Gene symbol | RRM1 | Gene ID | 6240 |
| Gene name | ribonucleotide reductase catalytic subunit M1 | |
| Gene Alias | R1 | |
| Cytomap | 11p15.4 | |
| Gene Type | protein-coding | GO ID | GO:0000003 | UniProtAcc | P23921 |
Top |
Malignant transformation analysis |
| Identification of the aberrant gene expression in precancerous and cancerous lesions by comparing the gene expression of stem-like cells in diseased tissues with normal stem cells |
| Entrez ID | Symbol | Replicates | Species | Organ | Tissue | Adj P-value | Log2FC | Malignancy |
| 6240 | RRM1 | HCC1_Meng | Human | Liver | HCC | 8.43e-45 | 6.45e-02 | 0.0246 |
| 6240 | RRM1 | HCC2_Meng | Human | Liver | HCC | 4.35e-10 | 1.11e-01 | 0.0107 |
| 6240 | RRM1 | HCC1 | Human | Liver | HCC | 1.47e-04 | 3.10e+00 | 0.5336 |
| 6240 | RRM1 | HCC2 | Human | Liver | HCC | 3.63e-06 | 2.39e+00 | 0.5341 |
| 6240 | RRM1 | Pt13.b | Human | Liver | HCC | 1.24e-04 | 6.25e-02 | 0.0251 |
| 6240 | RRM1 | S014 | Human | Liver | HCC | 1.11e-18 | 6.29e-01 | 0.2254 |
| 6240 | RRM1 | S015 | Human | Liver | HCC | 1.34e-05 | 4.01e-01 | 0.2375 |
| 6240 | RRM1 | S016 | Human | Liver | HCC | 2.87e-16 | 6.15e-01 | 0.2243 |
| 6240 | RRM1 | S027 | Human | Liver | HCC | 1.26e-05 | 4.99e-01 | 0.2446 |
| 6240 | RRM1 | S028 | Human | Liver | HCC | 5.73e-12 | 6.53e-01 | 0.2503 |
| 6240 | RRM1 | S029 | Human | Liver | HCC | 3.31e-13 | 7.68e-01 | 0.2581 |
| 6240 | RRM1 | C04 | Human | Oral cavity | OSCC | 8.14e-12 | 1.04e+00 | 0.2633 |
| 6240 | RRM1 | C21 | Human | Oral cavity | OSCC | 4.11e-29 | 1.41e+00 | 0.2678 |
| 6240 | RRM1 | C30 | Human | Oral cavity | OSCC | 1.05e-27 | 1.73e+00 | 0.3055 |
| 6240 | RRM1 | C38 | Human | Oral cavity | OSCC | 3.45e-11 | 1.48e+00 | 0.172 |
| 6240 | RRM1 | C43 | Human | Oral cavity | OSCC | 7.43e-40 | 9.30e-01 | 0.1704 |
| 6240 | RRM1 | C46 | Human | Oral cavity | OSCC | 1.15e-37 | 1.05e+00 | 0.1673 |
| 6240 | RRM1 | C51 | Human | Oral cavity | OSCC | 5.09e-11 | 1.15e+00 | 0.2674 |
| 6240 | RRM1 | C57 | Human | Oral cavity | OSCC | 1.85e-02 | 3.60e-01 | 0.1679 |
| 6240 | RRM1 | C08 | Human | Oral cavity | OSCC | 3.43e-09 | 4.52e-01 | 0.1919 |
| Page: 1 2 3 4 5 6 |
| Tissue | Expression Dynamics | Abbreviation |
| Colorectum (GSE201348) |  | FAP: Familial adenomatous polyposis |
| CRC: Colorectal cancer | ||
| Colorectum (HTA11) | 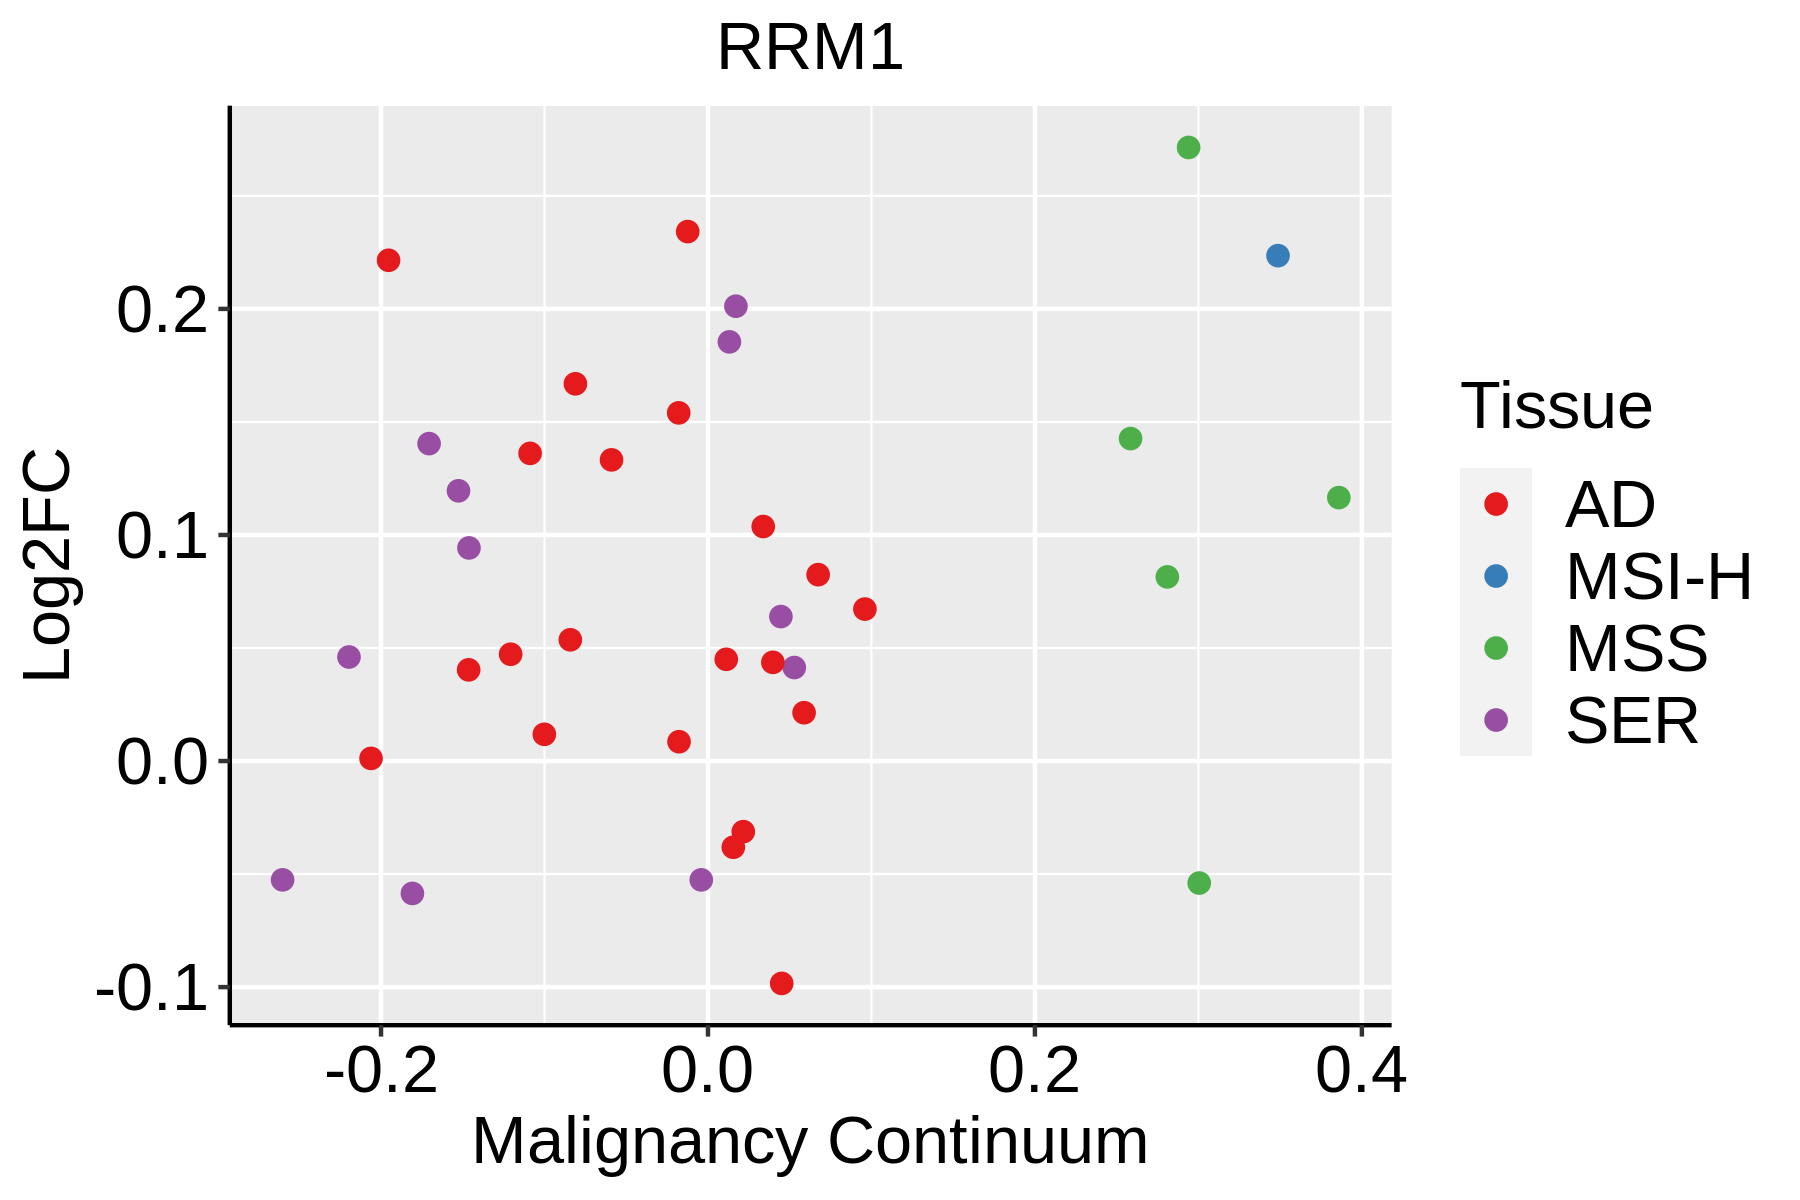 | AD: Adenomas |
| SER: Sessile serrated lesions | ||
| MSI-H: Microsatellite-high colorectal cancer | ||
| MSS: Microsatellite stable colorectal cancer | ||
| Esophagus | 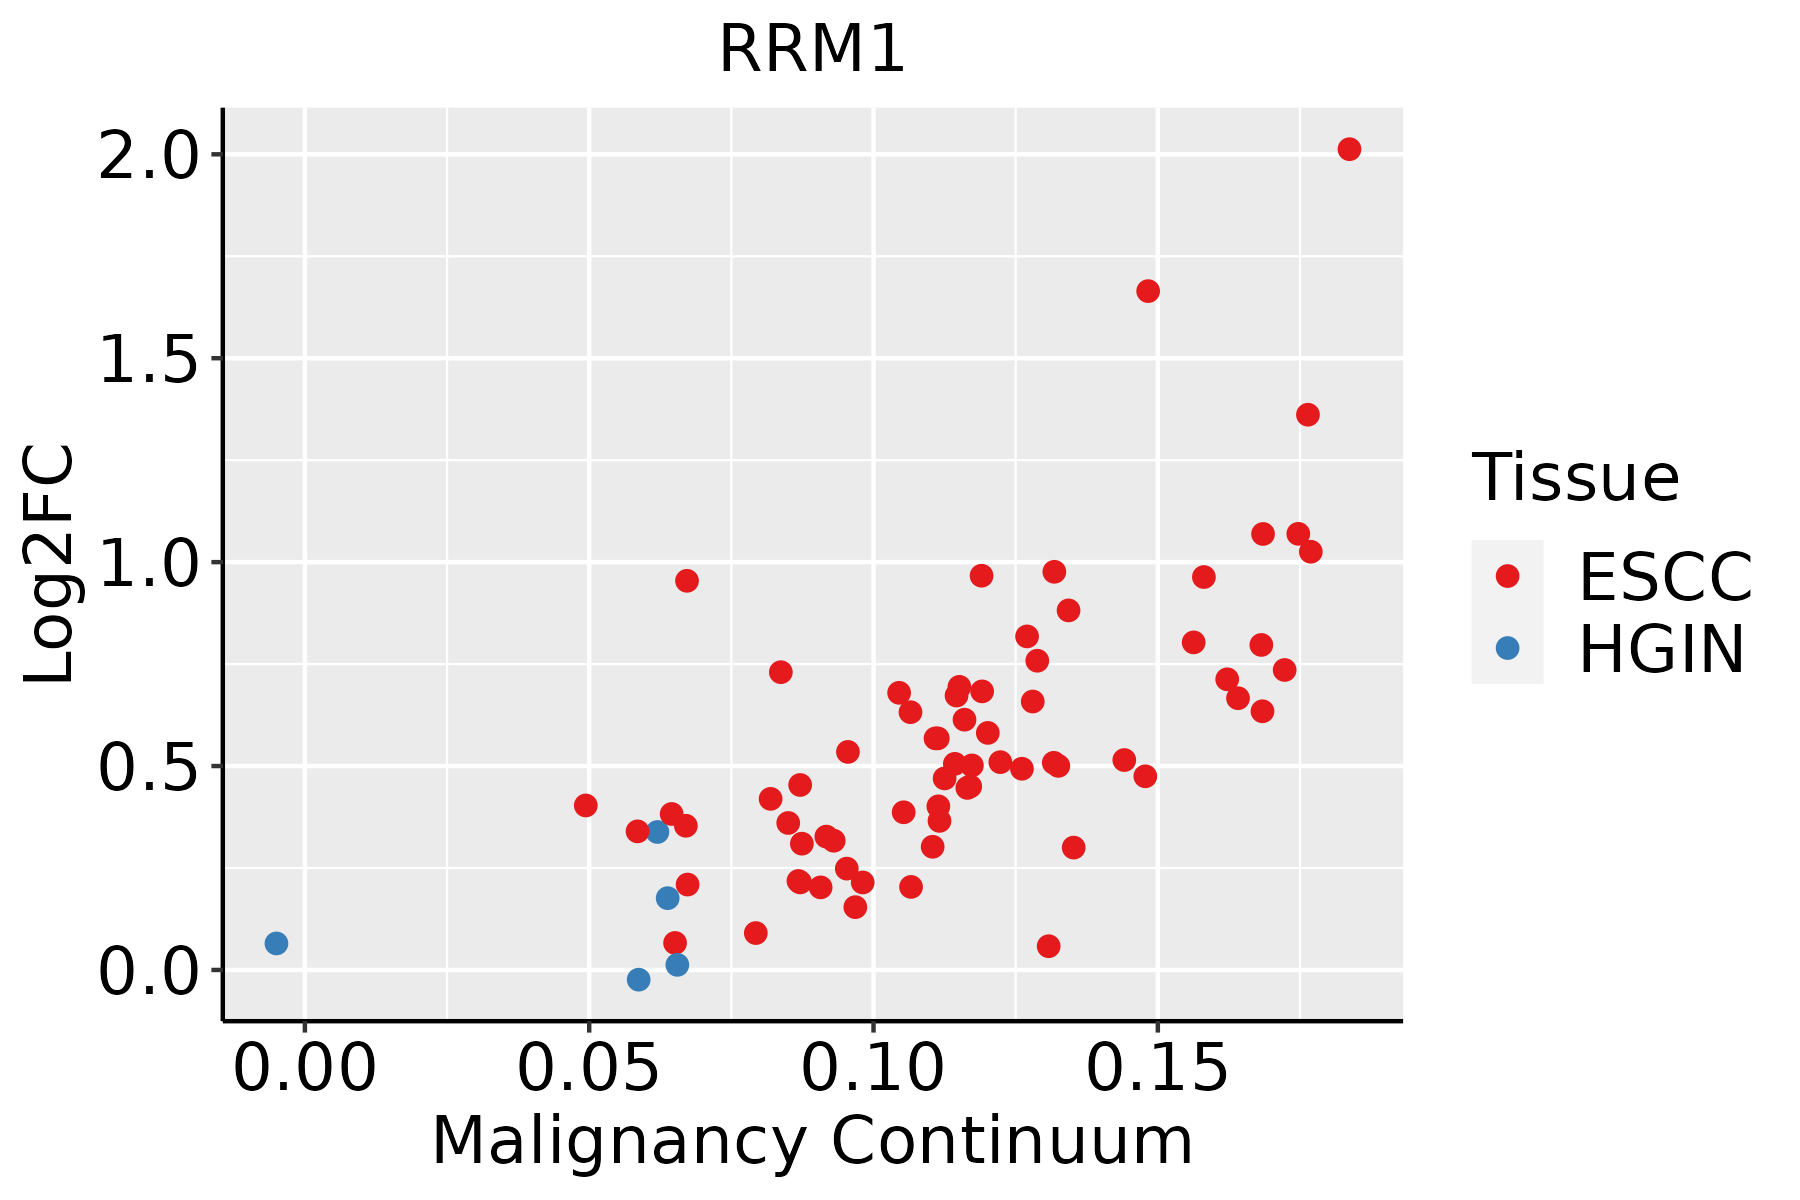 | ESCC: Esophageal squamous cell carcinoma |
| HGIN: High-grade intraepithelial neoplasias | ||
| LGIN: Low-grade intraepithelial neoplasias | ||
| Liver |  | HCC: Hepatocellular carcinoma |
| NAFLD: Non-alcoholic fatty liver disease | ||
| Oral Cavity | 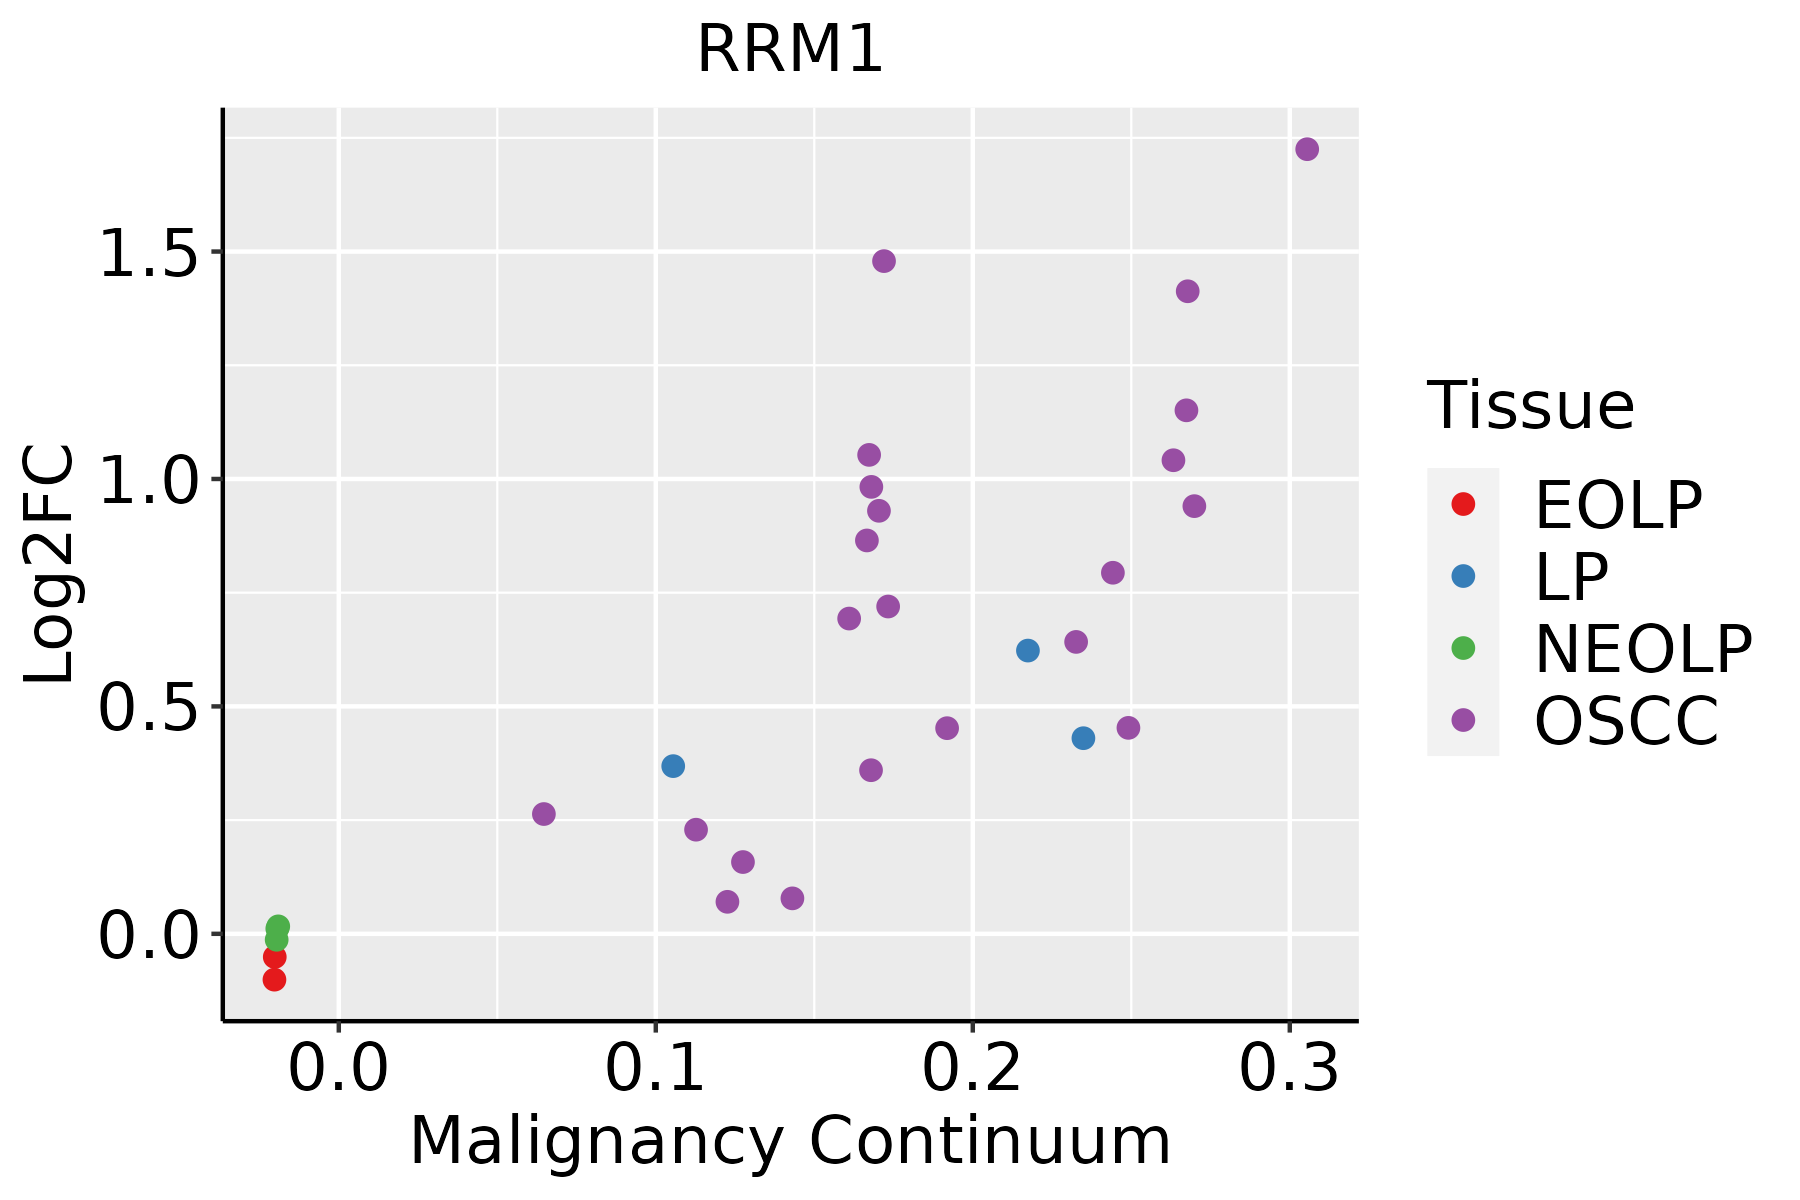 | EOLP: Erosive Oral lichen planus |
| LP: leukoplakia | ||
| NEOLP: Non-erosive oral lichen planus | ||
| OSCC: Oral squamous cell carcinoma | ||
| Skin |  | AK: Actinic keratosis |
| cSCC: Cutaneous squamous cell carcinoma | ||
| SCCIS:squamous cell carcinoma in situ | ||
| Thyroid | 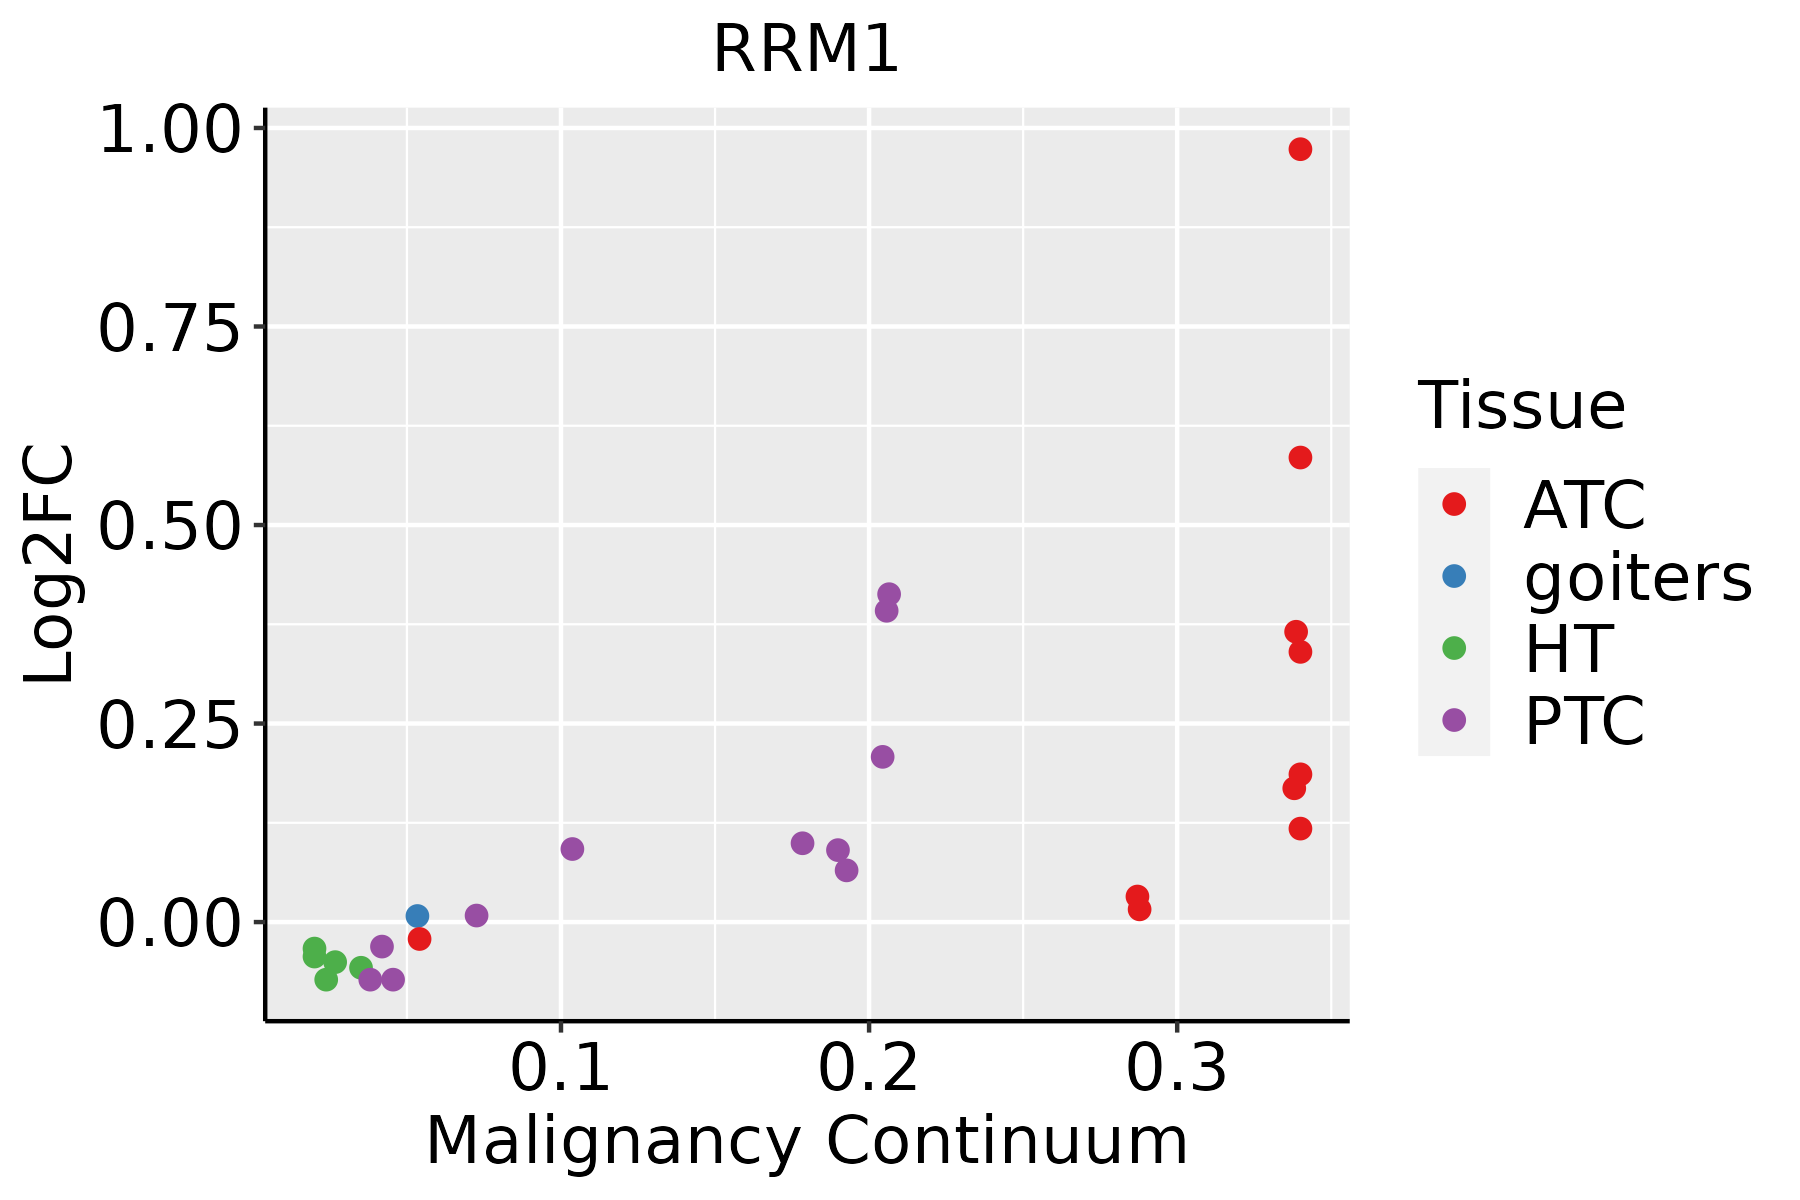 | ATC: Anaplastic thyroid cancer |
| HT: Hashimoto's thyroiditis | ||
| PTC: Papillary thyroid cancer |
| ∗log2FC in expression of this searched gene in stem-like cells from each diseased tissue sample relative to stem-like cells in normal samples in each tissue plotted against the malignancy continuum. Samples are colored based on if they are from different disease stage. |
Top |
Malignant transformation related pathway analysis |
| Find out the enriched GO biological processes and KEGG pathways involved in transition from healthy to precancer to cancer |
| Tissue | Disease Stage | Enriched GO biological Processes |
| Colorectum | AD |  |
| Colorectum | SER |  |
| Colorectum | MSS |  |
| Colorectum | MSI-H |  |
| Colorectum | FAP |  |
| ∗Top 15 enriched GO BP terms are showed in the bar plot of each disease state in each tissue. Each row represents a significant GO biological process which is colored according to the -log10(p.adjust). |
| Page: 1 2 3 4 5 6 7 8 9 |
| GO ID | Tissue | Disease Stage | Description | Gene Ratio | Bg Ratio | pvalue | p.adjust | Count |
| GO:0008380 | Colorectum | AD | RNA splicing | 169/3918 | 434/18723 | 3.59e-18 | 2.04e-15 | 169 |
| GO:0000377 | Colorectum | AD | RNA splicing, via transesterification reactions with bulged adenosine as nucleophile | 130/3918 | 320/18723 | 5.88e-16 | 2.16e-13 | 130 |
| GO:0000398 | Colorectum | AD | mRNA splicing, via spliceosome | 130/3918 | 320/18723 | 5.88e-16 | 2.16e-13 | 130 |
| GO:0000375 | Colorectum | AD | RNA splicing, via transesterification reactions | 131/3918 | 324/18723 | 7.11e-16 | 2.22e-13 | 131 |
| GO:0009117 | Colorectum | AD | nucleotide metabolic process | 168/3918 | 489/18723 | 2.20e-12 | 3.36e-10 | 168 |
| GO:0006753 | Colorectum | AD | nucleoside phosphate metabolic process | 169/3918 | 497/18723 | 4.99e-12 | 6.98e-10 | 169 |
| GO:1901293 | Colorectum | AD | nucleoside phosphate biosynthetic process | 80/3918 | 256/18723 | 6.31e-05 | 1.05e-03 | 80 |
| GO:0009165 | Colorectum | AD | nucleotide biosynthetic process | 79/3918 | 254/18723 | 8.33e-05 | 1.30e-03 | 79 |
| GO:0061458 | Colorectum | AD | reproductive system development | 116/3918 | 427/18723 | 1.11e-03 | 1.01e-02 | 116 |
| GO:0048608 | Colorectum | AD | reproductive structure development | 114/3918 | 424/18723 | 1.78e-03 | 1.47e-02 | 114 |
| GO:00091172 | Colorectum | MSS | nucleotide metabolic process | 144/3467 | 489/18723 | 1.87e-09 | 1.35e-07 | 144 |
| GO:00067532 | Colorectum | MSS | nucleoside phosphate metabolic process | 145/3467 | 497/18723 | 3.25e-09 | 2.23e-07 | 145 |
| GO:00614582 | Colorectum | MSS | reproductive system development | 115/3467 | 427/18723 | 9.86e-06 | 2.39e-04 | 115 |
| GO:00486082 | Colorectum | MSS | reproductive structure development | 113/3467 | 424/18723 | 1.94e-05 | 4.18e-04 | 113 |
| GO:19012932 | Colorectum | MSS | nucleoside phosphate biosynthetic process | 71/3467 | 256/18723 | 1.80e-04 | 2.56e-03 | 71 |
| GO:00091652 | Colorectum | MSS | nucleotide biosynthetic process | 70/3467 | 254/18723 | 2.44e-04 | 3.34e-03 | 70 |
| GO:00083804 | Colorectum | FAP | RNA splicing | 108/2622 | 434/18723 | 7.90e-10 | 1.86e-07 | 108 |
| GO:00003754 | Colorectum | FAP | RNA splicing, via transesterification reactions | 84/2622 | 324/18723 | 8.06e-09 | 1.10e-06 | 84 |
| GO:00003774 | Colorectum | FAP | RNA splicing, via transesterification reactions with bulged adenosine as nucleophile | 83/2622 | 320/18723 | 9.66e-09 | 1.23e-06 | 83 |
| GO:00003984 | Colorectum | FAP | mRNA splicing, via spliceosome | 83/2622 | 320/18723 | 9.66e-09 | 1.23e-06 | 83 |
| Page: 1 2 3 4 5 6 7 8 9 10 |
| Pathway ID | Tissue | Disease Stage | Description | Gene Ratio | Bg Ratio | pvalue | p.adjust | qvalue | Count |
| hsa004802 | Colorectum | MSS | Glutathione metabolism | 22/1875 | 57/8465 | 3.58e-03 | 1.64e-02 | 1.01e-02 | 22 |
| hsa004803 | Colorectum | MSS | Glutathione metabolism | 22/1875 | 57/8465 | 3.58e-03 | 1.64e-02 | 1.01e-02 | 22 |
| hsa0048018 | Esophagus | ESCC | Glutathione metabolism | 44/4205 | 57/8465 | 1.81e-05 | 9.03e-05 | 4.63e-05 | 44 |
| hsa012325 | Esophagus | ESCC | Nucleotide metabolism | 59/4205 | 85/8465 | 1.67e-04 | 6.58e-04 | 3.37e-04 | 59 |
| hsa002405 | Esophagus | ESCC | Pyrimidine metabolism | 41/4205 | 58/8465 | 9.14e-04 | 2.92e-03 | 1.49e-03 | 41 |
| hsa0048019 | Esophagus | ESCC | Glutathione metabolism | 44/4205 | 57/8465 | 1.81e-05 | 9.03e-05 | 4.63e-05 | 44 |
| hsa0123212 | Esophagus | ESCC | Nucleotide metabolism | 59/4205 | 85/8465 | 1.67e-04 | 6.58e-04 | 3.37e-04 | 59 |
| hsa0024012 | Esophagus | ESCC | Pyrimidine metabolism | 41/4205 | 58/8465 | 9.14e-04 | 2.92e-03 | 1.49e-03 | 41 |
| hsa002402 | Liver | HCC | Pyrimidine metabolism | 44/4020 | 58/8465 | 9.34e-06 | 7.11e-05 | 3.95e-05 | 44 |
| hsa012322 | Liver | HCC | Nucleotide metabolism | 59/4020 | 85/8465 | 3.30e-05 | 1.88e-04 | 1.04e-04 | 59 |
| hsa0048022 | Liver | HCC | Glutathione metabolism | 42/4020 | 57/8465 | 5.00e-05 | 2.62e-04 | 1.46e-04 | 42 |
| hsa009832 | Liver | HCC | Drug metabolism - other enzymes | 54/4020 | 80/8465 | 2.25e-04 | 1.09e-03 | 6.08e-04 | 54 |
| hsa002403 | Liver | HCC | Pyrimidine metabolism | 44/4020 | 58/8465 | 9.34e-06 | 7.11e-05 | 3.95e-05 | 44 |
| hsa012323 | Liver | HCC | Nucleotide metabolism | 59/4020 | 85/8465 | 3.30e-05 | 1.88e-04 | 1.04e-04 | 59 |
| hsa0048032 | Liver | HCC | Glutathione metabolism | 42/4020 | 57/8465 | 5.00e-05 | 2.62e-04 | 1.46e-04 | 42 |
| hsa009833 | Liver | HCC | Drug metabolism - other enzymes | 54/4020 | 80/8465 | 2.25e-04 | 1.09e-03 | 6.08e-04 | 54 |
| hsa012324 | Oral cavity | OSCC | Nucleotide metabolism | 54/3704 | 85/8465 | 1.78e-04 | 5.95e-04 | 3.03e-04 | 54 |
| hsa002404 | Oral cavity | OSCC | Pyrimidine metabolism | 37/3704 | 58/8465 | 1.62e-03 | 4.45e-03 | 2.26e-03 | 37 |
| hsa0048016 | Oral cavity | OSCC | Glutathione metabolism | 36/3704 | 57/8465 | 2.41e-03 | 6.41e-03 | 3.26e-03 | 36 |
| hsa0123211 | Oral cavity | OSCC | Nucleotide metabolism | 54/3704 | 85/8465 | 1.78e-04 | 5.95e-04 | 3.03e-04 | 54 |
| Page: 1 2 |
Top |
Cell-cell communication analysis |
| Identification of potential cell-cell interactions between two cell types and their ligand-receptor pairs for different disease states |
| Ligand | Receptor | LRpair | Pathway | Tissue | Disease Stage |
| Page: 1 |
Top |
Single-cell gene regulatory network inference analysis |
| Find out the significant the regulons (TFs) and the target genes of each regulon across cell types for different disease states |
| TF | Cell Type | Tissue | Disease Stage | Target Gene | RSS | Regulon Activity |
| ∗The dot plots of a searched regulon are shown for all cell subpopulations in each disease state of each tissue based on the regulon specific score inferred using pySCENIC and by calculating the average expression. |
| Page: 1 |
Top |
Somatic mutation of malignant transformation related genes |
| Annotation of somatic variants for genes involved in malignant transformation |
| Hugo Symbol | Variant Class | Variant Classification | dbSNP RS | HGVSc | HGVSp | HGVSp Short | SWISSPROT | BIOTYPE | SIFT | PolyPhen | Tumor Sample Barcode | Tissue | Histology | Sex | Age | Stage | Therapy Types | Drugs | Outcome |
| RRM1 | SNV | Missense_Mutation | c.613N>T | p.Leu205Phe | p.L205F | P23921 | protein_coding | deleterious_low_confidence(0) | probably_damaging(0.994) | TCGA-A2-A0CX-01 | Breast | breast invasive carcinoma | Female | <65 | I/II | Chemotherapy | adriamycin | SD | |
| RRM1 | SNV | Missense_Mutation | novel | c.1880N>A | p.Arg627His | p.R627H | P23921 | protein_coding | deleterious_low_confidence(0) | probably_damaging(0.941) | TCGA-AN-A046-01 | Breast | breast invasive carcinoma | Female | >=65 | I/II | Unknown | Unknown | SD |
| RRM1 | SNV | Missense_Mutation | novel | c.562N>C | p.Glu188Gln | p.E188Q | P23921 | protein_coding | tolerated_low_confidence(0.09) | benign(0.125) | TCGA-BH-A0B6-01 | Breast | breast invasive carcinoma | Female | <65 | I/II | Unknown | Unknown | SD |
| RRM1 | SNV | Missense_Mutation | c.7N>T | p.Val3Leu | p.V3L | P23921 | protein_coding | deleterious_low_confidence(0) | possibly_damaging(0.87) | TCGA-C8-A131-01 | Breast | breast invasive carcinoma | Female | >=65 | III/IV | Chemotherapy | 5-fluorouracil | CR | |
| RRM1 | SNV | Missense_Mutation | c.251N>G | p.Ser84Cys | p.S84C | P23921 | protein_coding | deleterious_low_confidence(0) | possibly_damaging(0.729) | TCGA-D8-A1XS-01 | Breast | breast invasive carcinoma | Male | <65 | III/IV | Chemotherapy | adriamycin+cyclophosphamide | SD | |
| RRM1 | deletion | Frame_Shift_Del | novel | c.1415delN | p.Val472AlafsTer6 | p.V472Afs*6 | P23921 | protein_coding | TCGA-D8-A27V-01 | Breast | breast invasive carcinoma | Female | <65 | I/II | Hormone Therapy | tamoxiphen | SD | ||
| RRM1 | SNV | Missense_Mutation | novel | c.739N>A | p.Gly247Arg | p.G247R | P23921 | protein_coding | deleterious_low_confidence(0) | possibly_damaging(0.908) | TCGA-2W-A8YY-01 | Cervix | cervical & endocervical cancer | Female | <65 | I/II | Chemotherapy | cisplatin | CR |
| RRM1 | SNV | Missense_Mutation | c.979G>T | p.Asp327Tyr | p.D327Y | P23921 | protein_coding | deleterious_low_confidence(0) | probably_damaging(0.997) | TCGA-UC-A7PF-01 | Cervix | cervical & endocervical cancer | Female | <65 | I/II | Unknown | Unknown | SD | |
| RRM1 | SNV | Missense_Mutation | c.2254N>G | p.Leu752Val | p.L752V | P23921 | protein_coding | tolerated_low_confidence(1) | benign(0) | TCGA-AA-3854-01 | Colorectum | colon adenocarcinoma | Female | >=65 | I/II | Unknown | Unknown | SD | |
| RRM1 | SNV | Missense_Mutation | novel | c.2180G>A | p.Gly727Asp | p.G727D | P23921 | protein_coding | deleterious_low_confidence(0) | probably_damaging(0.995) | TCGA-AA-3947-01 | Colorectum | colon adenocarcinoma | Female | <65 | I/II | Unknown | Unknown | SD |
| Page: 1 2 3 4 5 6 7 |
Top |
Related drugs of malignant transformation related genes |
| Identification of chemicals and drugs interact with genes involved in malignant transfromation |
| (DGIdb 4.0) |
| Entrez ID | Symbol | Category | Interaction Types | Drug Claim Name | Drug Name | PMIDs |
| 6240 | RRM1 | DRUGGABLE GENOME, ENZYME, DNA REPAIR | VINORELBINE | VINORELBINE | 23038758,24647522 | |
| 6240 | RRM1 | DRUGGABLE GENOME, ENZYME, DNA REPAIR | MOTEXAFIN GADOLINIUM | |||
| 6240 | RRM1 | DRUGGABLE GENOME, ENZYME, DNA REPAIR | CLOFARABINE | CLOFARABINE | ||
| 6240 | RRM1 | DRUGGABLE GENOME, ENZYME, DNA REPAIR | inhibitor | CHEMBL1200983 | GALLIUM NITRATE | |
| 6240 | RRM1 | DRUGGABLE GENOME, ENZYME, DNA REPAIR | inhibitor | CHEMBL1096882 | FLUDARABINE PHOSPHATE | |
| 6240 | RRM1 | DRUGGABLE GENOME, ENZYME, DNA REPAIR | CISPLATIN | CISPLATIN | 12917817 | |
| 6240 | RRM1 | DRUGGABLE GENOME, ENZYME, DNA REPAIR | cytarabine | CYTARABINE | 24024897 | |
| 6240 | RRM1 | DRUGGABLE GENOME, ENZYME, DNA REPAIR | inhibitor | CHEMBL467 | HYDROXYUREA | |
| 6240 | RRM1 | DRUGGABLE GENOME, ENZYME, DNA REPAIR | inhibitor | 178103428 | HYDROXYUREA | |
| 6240 | RRM1 | DRUGGABLE GENOME, ENZYME, DNA REPAIR | GTI-2501 |
| Page: 1 2 3 4 |

Copyright 2023-Present -The University of Texas Health Science Center at Houston |