
|
|||||
|
 | |
| |
| |
| |
| |
| |
|
Gene: RPS6KC1 |
Gene summary for RPS6KC1 |
| Gene information | Species | Human | Gene symbol | RPS6KC1 | Gene ID | 26750 |
| Gene name | ribosomal protein S6 kinase C1 | |
| Gene Alias | RPK118 | |
| Cytomap | 1q32.3 | |
| Gene Type | protein-coding | GO ID | GO:0006464 | UniProtAcc | Q96S38 |
Top |
Malignant transformation analysis |
| Identification of the aberrant gene expression in precancerous and cancerous lesions by comparing the gene expression of stem-like cells in diseased tissues with normal stem cells |
| Entrez ID | Symbol | Replicates | Species | Organ | Tissue | Adj P-value | Log2FC | Malignancy |
| 26750 | RPS6KC1 | P130T-E | Human | Esophagus | ESCC | 3.52e-19 | 3.25e-01 | 0.1676 |
| 26750 | RPS6KC1 | RNA-P17T-P17T-2 | Human | Lung | IAC | 4.55e-10 | 8.99e-01 | 0.3371 |
| 26750 | RPS6KC1 | RNA-P17T-P17T-4 | Human | Lung | IAC | 4.74e-07 | 7.71e-01 | 0.343 |
| 26750 | RPS6KC1 | RNA-P17T-P17T-6 | Human | Lung | IAC | 7.89e-04 | 6.31e-01 | 0.3385 |
| 26750 | RPS6KC1 | RNA-P17T-P17T-8 | Human | Lung | IAC | 4.84e-06 | 7.06e-01 | 0.3329 |
| 26750 | RPS6KC1 | RNA-P23T2-P23T2-1 | Human | Lung | MIAC | 2.73e-03 | 8.62e-01 | -0.037 |
| 26750 | RPS6KC1 | RNA-P23T2-P23T2-4 | Human | Lung | MIAC | 1.09e-03 | 9.63e-01 | -0.0272 |
| 26750 | RPS6KC1 | RNA-P25T1-P25T1-1 | Human | Lung | AIS | 1.18e-07 | 3.68e-01 | -0.2116 |
| 26750 | RPS6KC1 | RNA-P25T1-P25T1-3 | Human | Lung | AIS | 3.13e-02 | 3.93e-01 | -0.2107 |
| 26750 | RPS6KC1 | RNA-P25T1-P25T1-4 | Human | Lung | AIS | 1.91e-03 | 3.49e-01 | -0.2119 |
| 26750 | RPS6KC1 | RNA-P6T2-P6T2-1 | Human | Lung | IAC | 6.31e-07 | 3.41e-01 | -0.0166 |
| 26750 | RPS6KC1 | RNA-P6T2-P6T2-2 | Human | Lung | IAC | 1.96e-07 | 3.46e-01 | -0.0132 |
| 26750 | RPS6KC1 | RNA-P6T2-P6T2-3 | Human | Lung | IAC | 3.46e-12 | 4.32e-01 | -0.013 |
| 26750 | RPS6KC1 | RNA-P6T2-P6T2-4 | Human | Lung | IAC | 1.18e-07 | 3.73e-01 | -0.0121 |
| 26750 | RPS6KC1 | RNA-P7T1-P7T1-1 | Human | Lung | AIS | 1.24e-04 | 4.79e-01 | -0.0961 |
| 26750 | RPS6KC1 | RNA-P7T1-P7T1-2 | Human | Lung | AIS | 4.32e-05 | 5.09e-01 | -0.0876 |
| 26750 | RPS6KC1 | RNA-P7T1-P7T1-4 | Human | Lung | AIS | 1.18e-04 | 4.95e-01 | -0.0809 |
| 26750 | RPS6KC1 | HTA12-25-1 | Human | Pancreas | PDAC | 1.06e-07 | 7.31e-01 | 0.313 |
| 26750 | RPS6KC1 | HTA12-26-1 | Human | Pancreas | PDAC | 6.96e-06 | 4.41e-01 | 0.3728 |
| 26750 | RPS6KC1 | HTA12-29-1 | Human | Pancreas | PDAC | 8.51e-22 | 5.62e-01 | 0.3722 |
| Page: 1 2 3 4 |
| Tissue | Expression Dynamics | Abbreviation |
| Cervix | 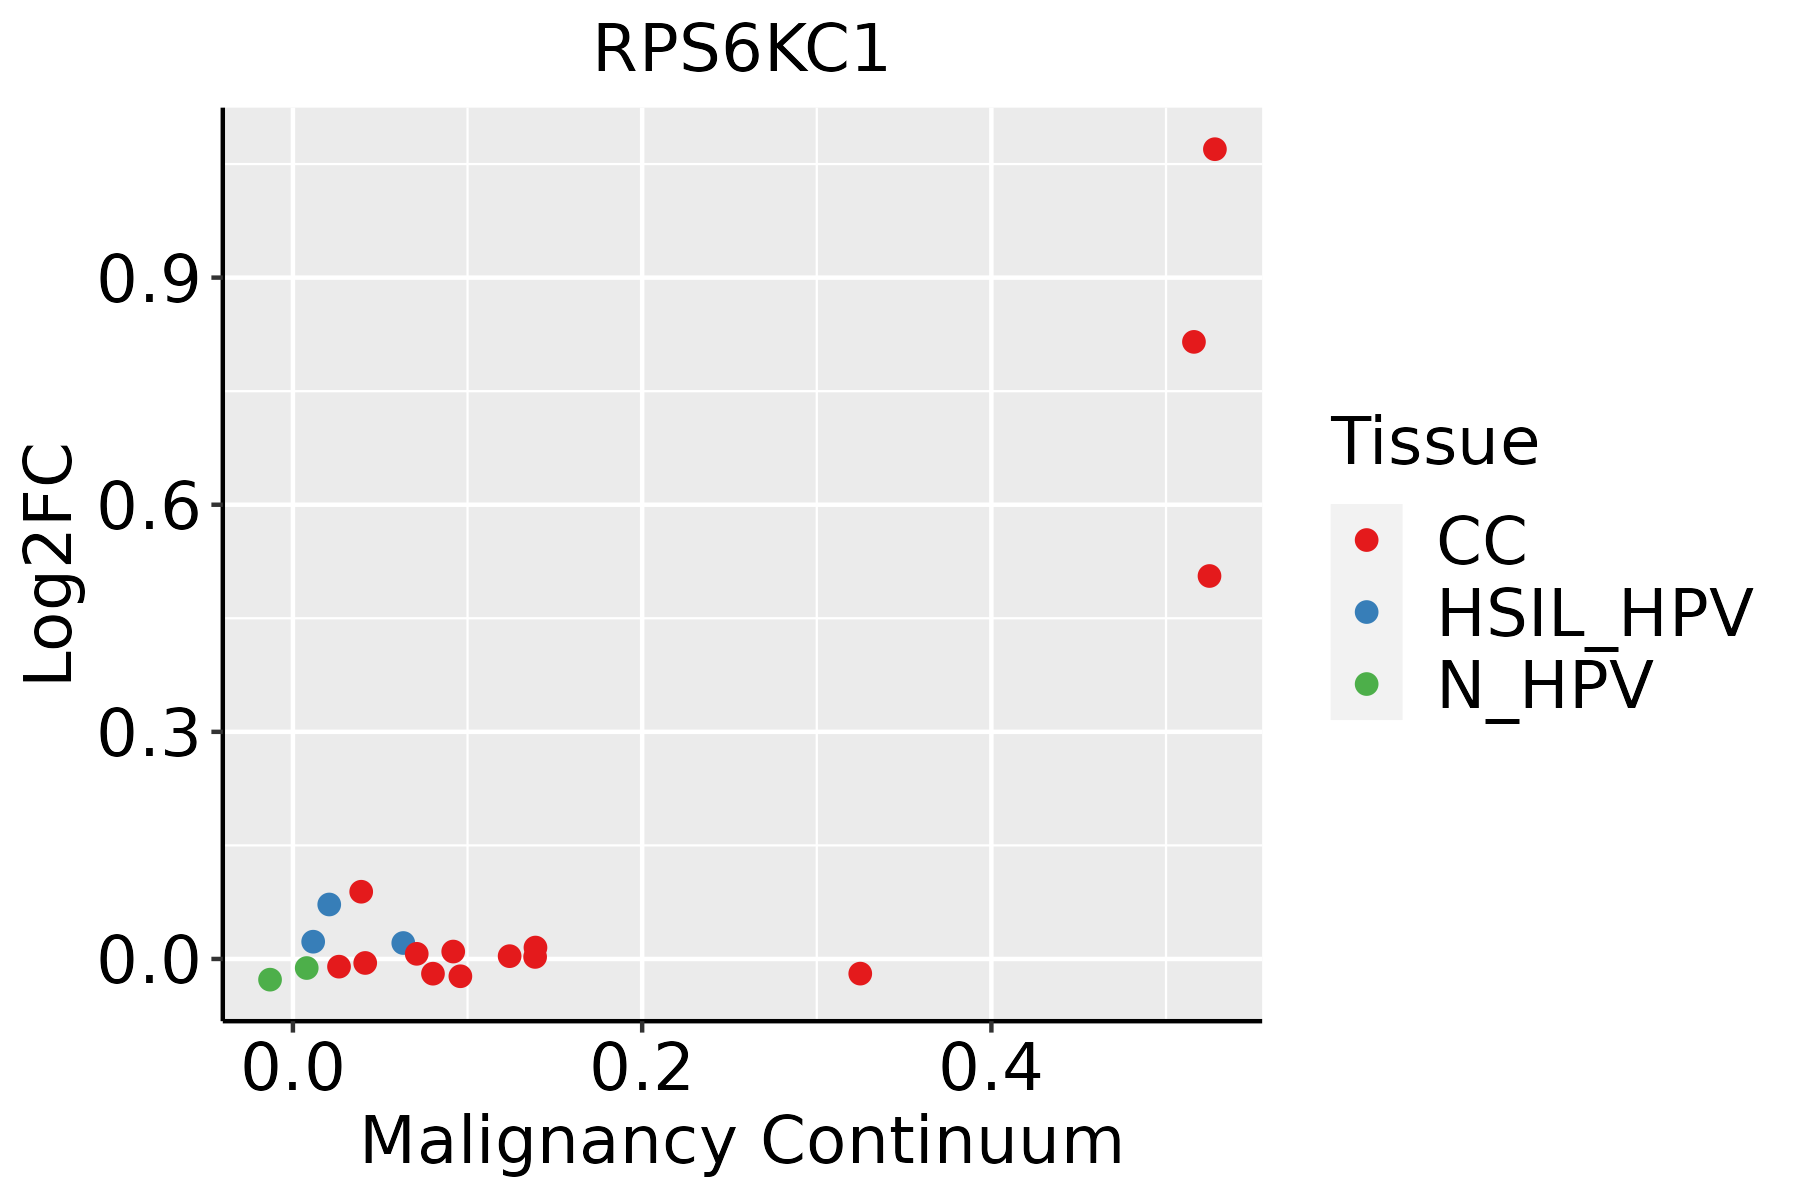 | CC: Cervix cancer |
| HSIL_HPV: HPV-infected high-grade squamous intraepithelial lesions | ||
| N_HPV: HPV-infected normal cervix | ||
| Esophagus | 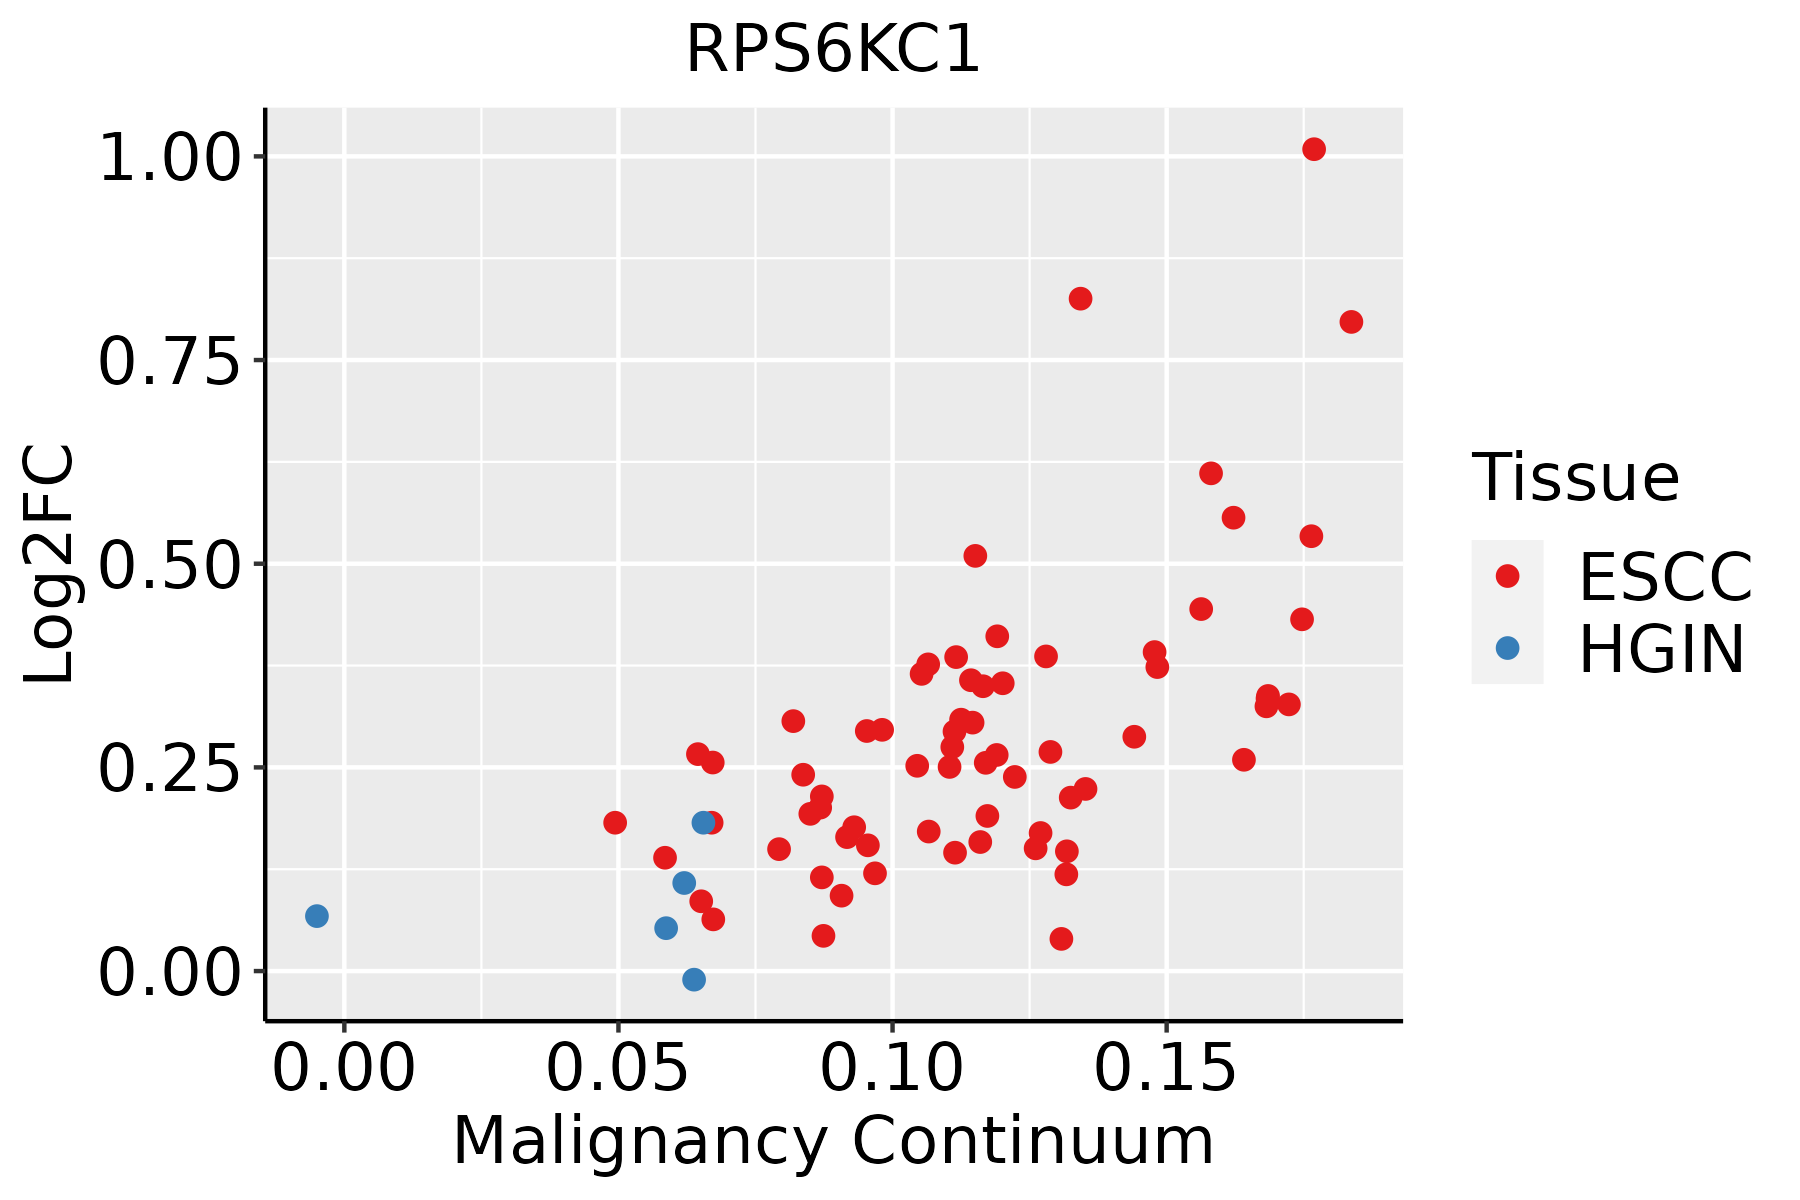 | ESCC: Esophageal squamous cell carcinoma |
| HGIN: High-grade intraepithelial neoplasias | ||
| LGIN: Low-grade intraepithelial neoplasias | ||
| Lung | 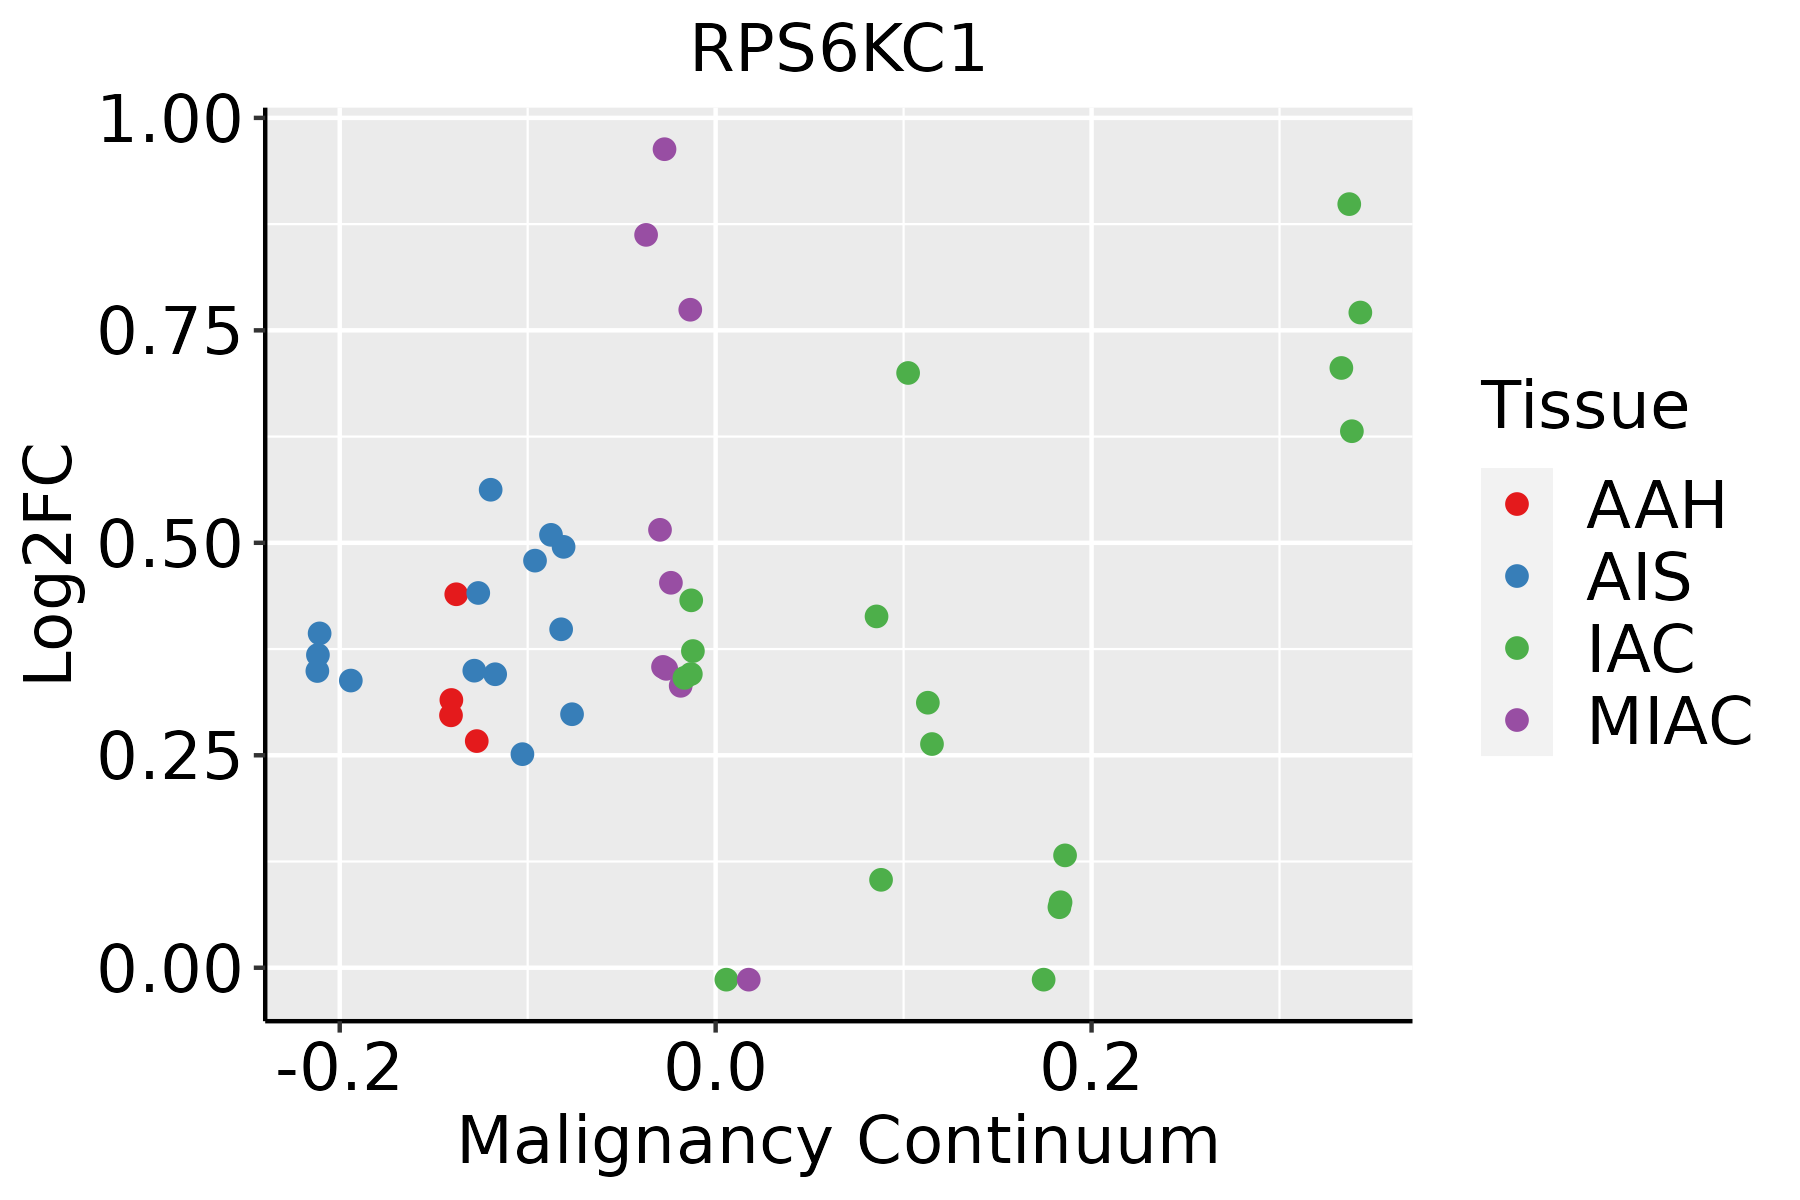 | AAH: Atypical adenomatous hyperplasia |
| AIS: Adenocarcinoma in situ | ||
| IAC: Invasive lung adenocarcinoma | ||
| MIA: Minimally invasive adenocarcinoma | ||
| Prostate |  | BPH: Benign Prostatic Hyperplasia |
| ∗log2FC in expression of this searched gene in stem-like cells from each diseased tissue sample relative to stem-like cells in normal samples in each tissue plotted against the malignancy continuum. Samples are colored based on if they are from different disease stage. |
Top |
Malignant transformation related pathway analysis |
| Find out the enriched GO biological processes and KEGG pathways involved in transition from healthy to precancer to cancer |
| Tissue | Disease Stage | Enriched GO biological Processes |
| Colorectum | AD |  |
| Colorectum | SER |  |
| Colorectum | MSS |  |
| Colorectum | MSI-H |  |
| Colorectum | FAP |  |
| ∗Top 15 enriched GO BP terms are showed in the bar plot of each disease state in each tissue. Each row represents a significant GO biological process which is colored according to the -log10(p.adjust). |
| Page: 1 2 3 4 5 6 7 8 9 |
| GO ID | Tissue | Disease Stage | Description | Gene Ratio | Bg Ratio | pvalue | p.adjust | Count |
| Page: 1 |
| Pathway ID | Tissue | Disease Stage | Description | Gene Ratio | Bg Ratio | pvalue | p.adjust | qvalue | Count |
| Page: 1 |
Top |
Cell-cell communication analysis |
| Identification of potential cell-cell interactions between two cell types and their ligand-receptor pairs for different disease states |
| Ligand | Receptor | LRpair | Pathway | Tissue | Disease Stage |
| Page: 1 |
Top |
Single-cell gene regulatory network inference analysis |
| Find out the significant the regulons (TFs) and the target genes of each regulon across cell types for different disease states |
| TF | Cell Type | Tissue | Disease Stage | Target Gene | RSS | Regulon Activity |
| ∗The dot plots of a searched regulon are shown for all cell subpopulations in each disease state of each tissue based on the regulon specific score inferred using pySCENIC and by calculating the average expression. |
| Page: 1 |
Top |
Somatic mutation of malignant transformation related genes |
| Annotation of somatic variants for genes involved in malignant transformation |
| Hugo Symbol | Variant Class | Variant Classification | dbSNP RS | HGVSc | HGVSp | HGVSp Short | SWISSPROT | BIOTYPE | SIFT | PolyPhen | Tumor Sample Barcode | Tissue | Histology | Sex | Age | Stage | Therapy Types | Drugs | Outcome |
| RPS6KC1 | SNV | Missense_Mutation | c.2983C>G | p.Leu995Val | p.L995V | Q96S38 | protein_coding | deleterious(0.03) | probably_damaging(0.936) | TCGA-AC-A23H-01 | Breast | breast invasive carcinoma | Female | >=65 | I/II | Unknown | Unknown | PD | |
| RPS6KC1 | SNV | Missense_Mutation | rs577745586 | c.429N>G | p.His143Gln | p.H143Q | Q96S38 | protein_coding | tolerated(0.11) | benign(0.05) | TCGA-AC-A3TN-01 | Breast | breast invasive carcinoma | Female | >=65 | I/II | Hormone Therapy | arimidex | SD |
| RPS6KC1 | SNV | Missense_Mutation | novel | c.2629N>A | p.Glu877Lys | p.E877K | Q96S38 | protein_coding | tolerated(0.15) | benign(0.111) | TCGA-AR-A2LE-01 | Breast | breast invasive carcinoma | Female | >=65 | I/II | Hormone Therapy | tamoxiphen | PD |
| RPS6KC1 | SNV | Missense_Mutation | novel | c.551N>T | p.Ser184Phe | p.S184F | Q96S38 | protein_coding | deleterious(0) | probably_damaging(0.999) | TCGA-BH-A1F2-01 | Breast | breast invasive carcinoma | Female | <65 | III/IV | Unknown | Unknown | SD |
| RPS6KC1 | SNV | Missense_Mutation | c.788N>G | p.Ser263Cys | p.S263C | Q96S38 | protein_coding | deleterious(0.01) | possibly_damaging(0.905) | TCGA-D8-A1JA-01 | Breast | breast invasive carcinoma | Female | <65 | III/IV | Chemotherapy | adriamycin | PD | |
| RPS6KC1 | SNV | Missense_Mutation | novel | c.1096N>G | p.Leu366Val | p.L366V | Q96S38 | protein_coding | deleterious(0.02) | probably_damaging(0.996) | TCGA-GM-A2DH-01 | Breast | breast invasive carcinoma | Female | <65 | I/II | Chemotherapy | taxol | CR |
| RPS6KC1 | SNV | Missense_Mutation | novel | c.1606N>G | p.Lys536Glu | p.K536E | Q96S38 | protein_coding | tolerated(0.08) | benign(0.164) | TCGA-C5-A8YQ-01 | Cervix | cervical & endocervical cancer | Female | >=65 | I/II | Chemotherapy | cisplatin | PD |
| RPS6KC1 | SNV | Missense_Mutation | rs752202818 | c.218G>A | p.Arg73Gln | p.R73Q | Q96S38 | protein_coding | tolerated(0.08) | benign(0.188) | TCGA-FU-A3HZ-01 | Cervix | cervical & endocervical cancer | Female | <65 | I/II | Chemotherapy | cisplatin | CR |
| RPS6KC1 | SNV | Missense_Mutation | novel | c.1564G>A | p.Glu522Lys | p.E522K | Q96S38 | protein_coding | deleterious(0) | benign(0.419) | TCGA-UC-A7PG-06 | Cervix | cervical & endocervical cancer | Female | <65 | III/IV | Chemotherapy | cisplatin | PD |
| RPS6KC1 | SNV | Missense_Mutation | rs767587139 | c.2640N>T | p.Lys880Asn | p.K880N | Q96S38 | protein_coding | tolerated(0.05) | probably_damaging(0.936) | TCGA-A6-6780-01 | Colorectum | colon adenocarcinoma | Male | >=65 | I/II | Unknown | Unknown | SD |
| Page: 1 2 3 4 5 6 7 8 9 10 11 12 13 |
Top |
Related drugs of malignant transformation related genes |
| Identification of chemicals and drugs interact with genes involved in malignant transfromation |
| (DGIdb 4.0) |
| Entrez ID | Symbol | Category | Interaction Types | Drug Claim Name | Drug Name | PMIDs |
| Page: 1 |

Copyright 2023-Present -The University of Texas Health Science Center at Houston |