Schematic overview of the cellular and molecular mechanisms involved in the cancer progression, including the proposed cellular and molecular mechanisms in cancer cells trajectory. AT1: alveolar type 1 cells; AT2: alveolar type 2 cells; AAH: atypical adenomatous hyperplasia; AIS: adenocarcinoma in situ; MIA: minimally invasive adenocarcinoma; IA: invasive adenocarcinoma; EMT: epithelial-mesenchymal transition

Home

Download

Statistics

Help

Contact

Center for Computational Systems Medicine
leaf

Gene summary

leaf

Malignant transformation analysis

leaf

Malignant transformation related pathway analysis

leaf

Cell-cell communication analysis

leaf

Single-cell gene regulatory network inference analysis

leaf

Somatic mutation of malignant transformation related genes

leaf

Related drugs of malignant transformation related genes

Gene: RNF220

Gene summary for RNF220

check button Gene summary.

Gene informationSpeciesHuman
Gene symbol

RNF220

Gene ID

55182

Gene namering finger protein 220
Gene AliasC1orf164
Cytomap1p34.1
Gene Typeprotein-coding
GO ID

GO:0003002

UniProtAcc

Q5VTB9


Top

Malignant transformation analysis

check button Identification of the aberrant gene expression in precancerous and cancerous lesions by comparing the gene expression of stem-like cells in diseased tissues with normal stem cells
check button Malignant transformation involving gene list.
Entrez IDSymbolReplicatesSpeciesOrganTissueAdj P-valueLog2FCMalignancy
55182RNF220HCC1HumanLiverHCC7.30e-042.22e+000.5336
55182RNF220HCC2HumanLiverHCC1.77e-142.88e+000.5341
55182RNF220Pt13.bHumanLiverHCC2.84e-031.01e-010.0251
55182RNF220S014HumanLiverHCC5.02e-186.43e-010.2254
55182RNF220S015HumanLiverHCC2.69e-166.96e-010.2375
55182RNF220S016HumanLiverHCC4.40e-156.25e-010.2243
55182RNF220S027HumanLiverHCC5.21e-088.61e-010.2446
55182RNF220S028HumanLiverHCC5.13e-261.06e+000.2503
55182RNF220S029HumanLiverHCC6.29e-271.26e+000.2581
55182RNF220C04HumanOral cavityOSCC4.48e-096.19e-010.2633
55182RNF220C21HumanOral cavityOSCC6.56e-267.40e-010.2678
55182RNF220C30HumanOral cavityOSCC8.77e-381.49e+000.3055
55182RNF220C43HumanOral cavityOSCC3.65e-032.20e-010.1704
55182RNF220C46HumanOral cavityOSCC5.09e-062.89e-010.1673
55182RNF220C51HumanOral cavityOSCC1.18e-034.20e-010.2674
55182RNF220C57HumanOral cavityOSCC5.03e-033.29e-010.1679
55182RNF220C06HumanOral cavityOSCC1.44e-028.44e-010.2699
55182RNF220C07HumanOral cavityOSCC1.49e-026.83e-010.2491
55182RNF220C08HumanOral cavityOSCC1.56e-073.33e-010.1919
55182RNF220LN22HumanOral cavityOSCC1.92e-054.90e-010.1733
Page: 1 2 3 4 5 

check button Transcriptomic changes along malignancy continuum.
TissueExpression DynamicsAbbreviation
EsophagusThe image shows the transcriptomic changes along malignancy continuum.log2FC in expression of this searched gene in stem-like cells from each diseased tissue sample relative to stem-like cells in normal samples in each tissue plotted against the malignancy continuum. Samples are colored based on if they are from different disease stage.ESCC: Esophageal squamous cell carcinoma
HGIN: High-grade intraepithelial neoplasias
LGIN: Low-grade intraepithelial neoplasias
LiverThe image shows the transcriptomic changes along malignancy continuum.log2FC in expression of this searched gene in stem-like cells from each diseased tissue sample relative to stem-like cells in normal samples in each tissue plotted against the malignancy continuum. Samples are colored based on if they are from different disease stage.HCC: Hepatocellular carcinoma
NAFLD: Non-alcoholic fatty liver disease
Oral CavityThe image shows the transcriptomic changes along malignancy continuum.log2FC in expression of this searched gene in stem-like cells from each diseased tissue sample relative to stem-like cells in normal samples in each tissue plotted against the malignancy continuum. Samples are colored based on if they are from different disease stage.
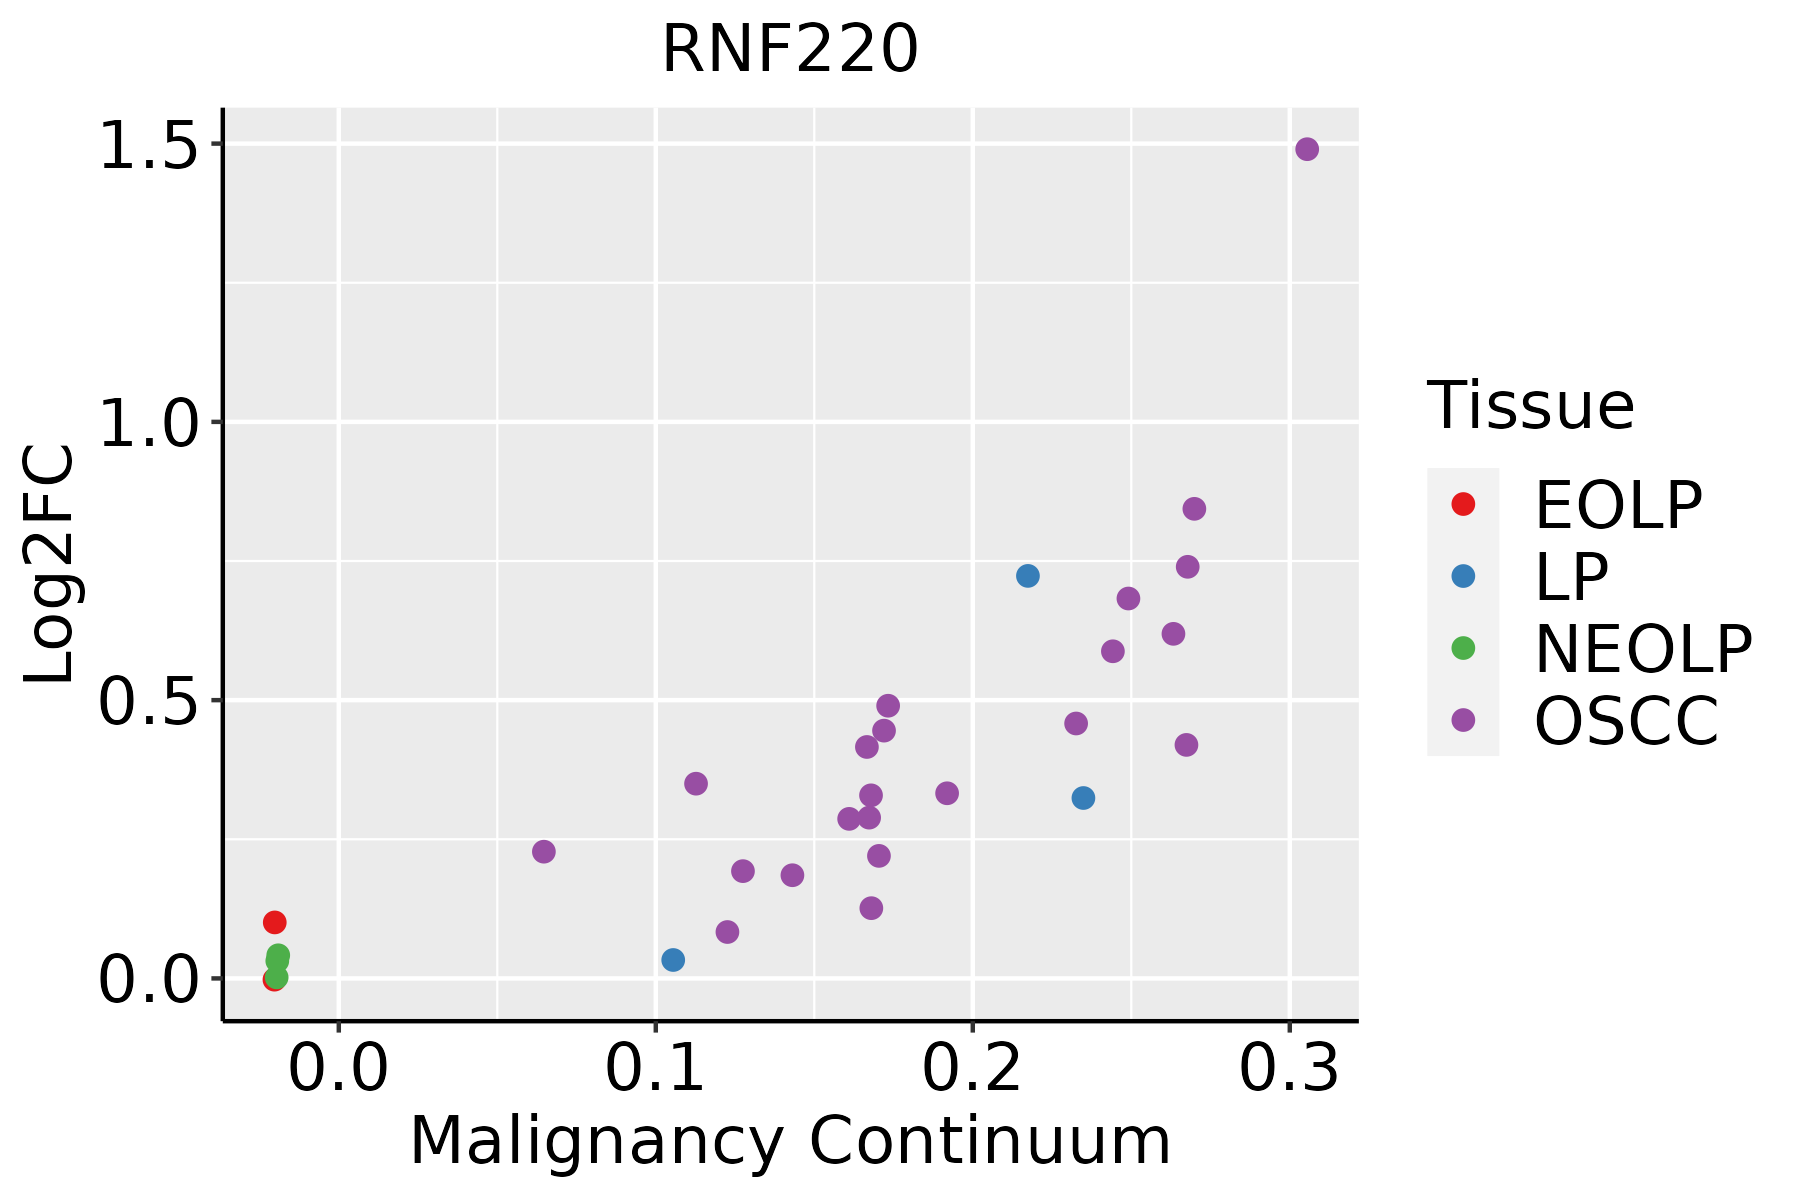
EOLP: Erosive Oral lichen planus
LP: leukoplakia
NEOLP: Non-erosive oral lichen planus
OSCC: Oral squamous cell carcinoma
ThyroidThe image shows the transcriptomic changes along malignancy continuum.log2FC in expression of this searched gene in stem-like cells from each diseased tissue sample relative to stem-like cells in normal samples in each tissue plotted against the malignancy continuum. Samples are colored based on if they are from different disease stage.
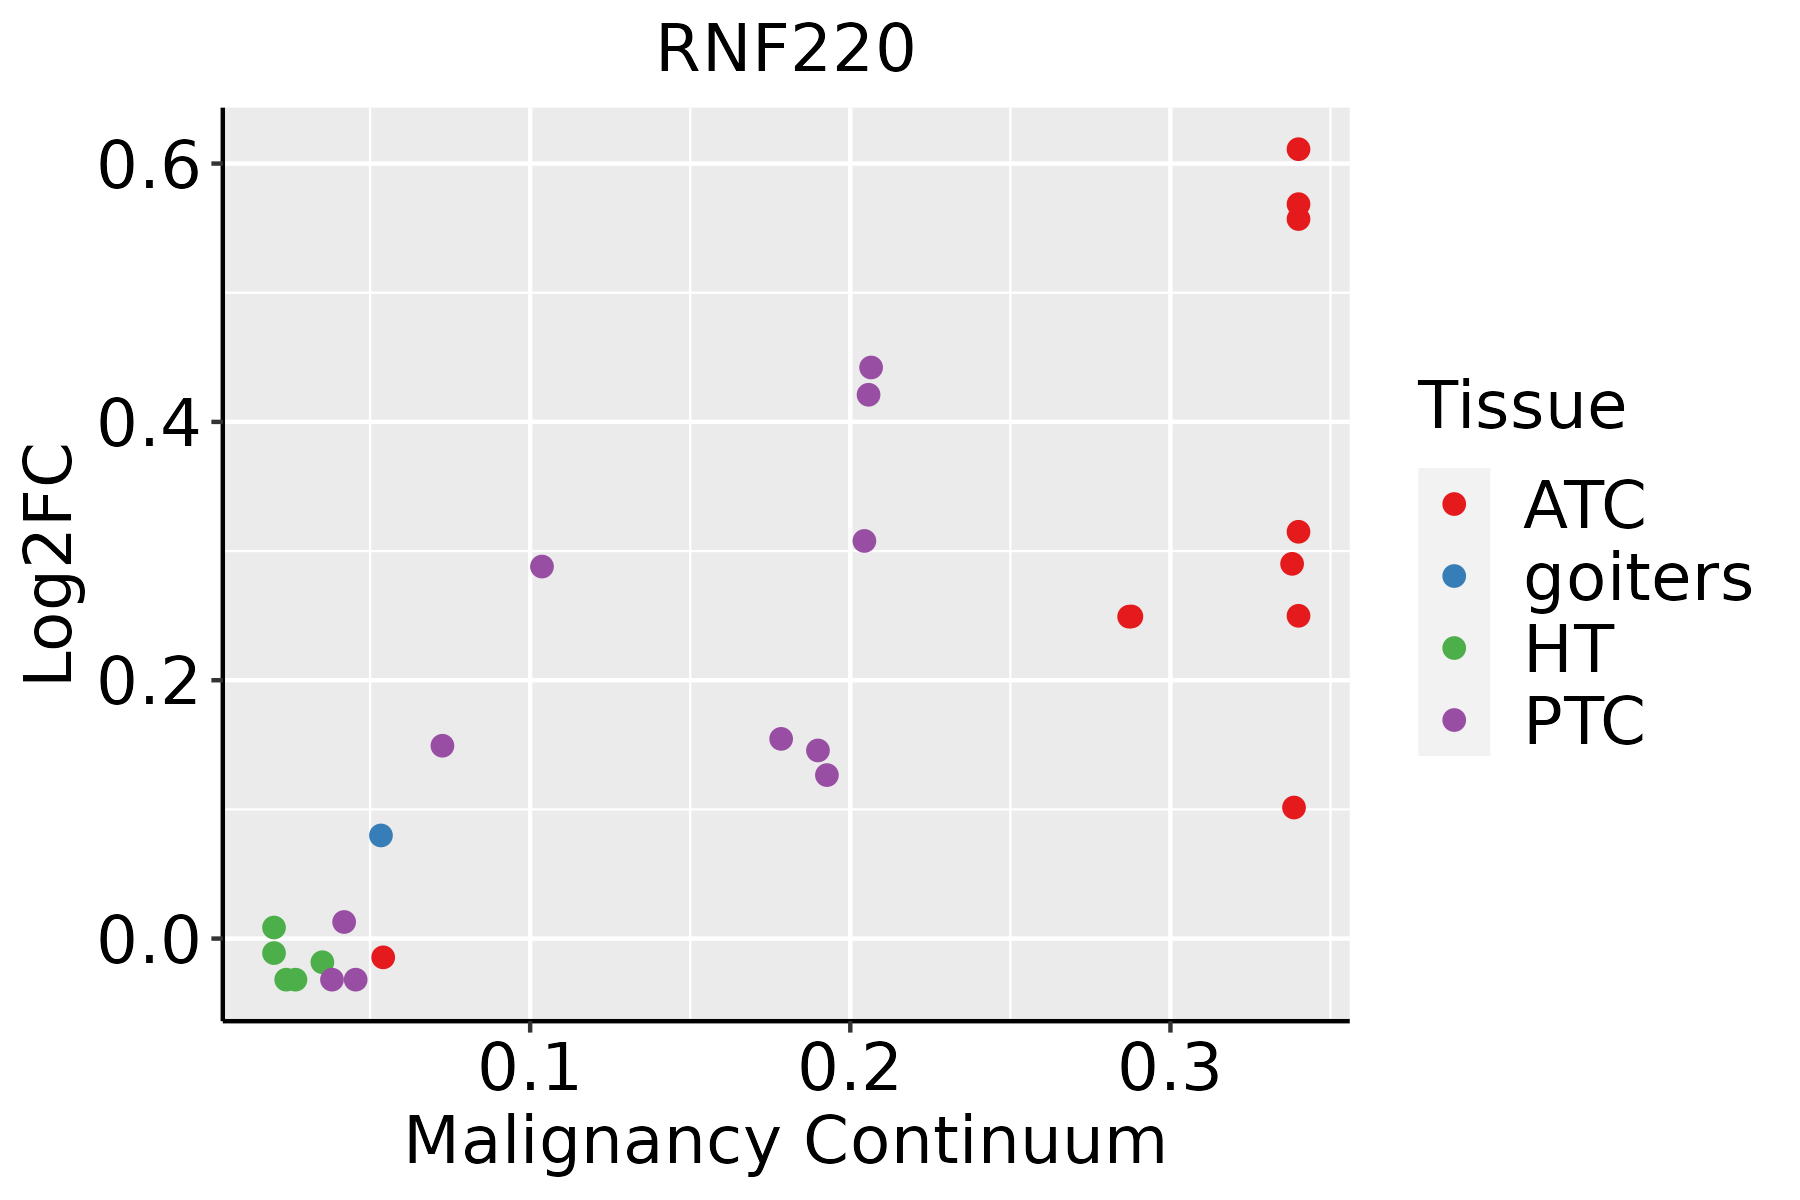
ATC: Anaplastic thyroid cancer
HT: Hashimoto's thyroiditis
PTC: Papillary thyroid cancer
∗log2FC in expression of this searched gene in stem-like cells from each diseased tissue sample relative to stem-like cells in normal samples in each tissue plotted against the malignancy continuum. Samples are colored based on if they are from different disease stage.

Top

Malignant transformation related pathway analysis

check buttonFind out the enriched GO biological processes and KEGG pathways involved in transition from healthy to precancer to cancer
check button Figure of enriched GO biological processes.
TissueDisease StageEnriched GO biological Processes
ColorectumADGO analysis - Figure of enriched GO biological processes: Top 15 enriched GO BP terms are showed in the bar plot of each disease state in each tissue. Each row represents a significant GO biological process which is colored according to the -log10(p.adjust).
ColorectumSERGO analysis - Figure of enriched GO biological processes: Top 15 enriched GO BP terms are showed in the bar plot of each disease state in each tissue. Each row represents a significant GO biological process which is colored according to the -log10(p.adjust).
ColorectumMSSGO analysis - Figure of enriched GO biological processes: Top 15 enriched GO BP terms are showed in the bar plot of each disease state in each tissue. Each row represents a significant GO biological process which is colored according to the -log10(p.adjust).
ColorectumMSI-HGO analysis - Figure of enriched GO biological processes: Top 15 enriched GO BP terms are showed in the bar plot of each disease state in each tissue. Each row represents a significant GO biological process which is colored according to the -log10(p.adjust).
ColorectumFAPGO analysis - Figure of enriched GO biological processes: Top 15 enriched GO BP terms are showed in the bar plot of each disease state in each tissue. Each row represents a significant GO biological process which is colored according to the -log10(p.adjust).
∗Top 15 enriched GO BP terms are showed in the bar plot of each disease state in each tissue. Each row represents a significant GO biological process which is colored according to the -log10(p.adjust).
Page: 1 2 3 4 5 6 7 8 9 

check button Enriched GO biological processes.
GO IDTissueDisease StageDescriptionGene RatioBg Ratiopvaluep.adjustCount
GO:001605517EsophagusESCCWnt signaling pathway268/8552444/187232.32e-106.58e-09268
GO:019873817EsophagusESCCcell-cell signaling by wnt269/8552446/187232.41e-106.79e-09269
GO:00219159EsophagusESCCneural tube development101/8552152/187231.78e-072.79e-06101
GO:003011117EsophagusESCCregulation of Wnt signaling pathway194/8552328/187235.39e-077.14e-06194
GO:006007016EsophagusESCCcanonical Wnt signaling pathway180/8552303/187239.15e-071.17e-05180
GO:006082817EsophagusESCCregulation of canonical Wnt signaling pathway153/8552253/187231.38e-061.67e-05153
GO:009026316EsophagusESCCpositive regulation of canonical Wnt signaling pathway69/8552106/187234.22e-053.39e-0469
GO:003017716EsophagusESCCpositive regulation of Wnt signaling pathway87/8552140/187236.18e-054.73e-0487
GO:00518658EsophagusESCCprotein autoubiquitination47/855273/187239.72e-044.93e-0347
GO:019873821LiverHCCcell-cell signaling by wnt247/7958446/187232.11e-084.96e-07247
GO:001605521LiverHCCWnt signaling pathway245/7958444/187233.68e-088.09e-07245
GO:003011121LiverHCCregulation of Wnt signaling pathway180/7958328/187233.62e-064.72e-05180
GO:006007021LiverHCCcanonical Wnt signaling pathway162/7958303/187237.00e-056.32e-04162
GO:006082821LiverHCCregulation of canonical Wnt signaling pathway137/7958253/187231.15e-049.70e-04137
GO:003017721LiverHCCpositive regulation of Wnt signaling pathway81/7958140/187231.73e-041.36e-0381
GO:009026321LiverHCCpositive regulation of canonical Wnt signaling pathway62/7958106/187236.44e-043.99e-0362
GO:00219154LiverHCCneural tube development82/7958152/187232.83e-031.33e-0282
GO:00518654LiverHCCprotein autoubiquitination42/795873/187236.78e-032.73e-0242
GO:001605510Oral cavityOSCCWnt signaling pathway227/7305444/187231.10e-071.87e-06227
GO:019873810Oral cavityOSCCcell-cell signaling by wnt227/7305446/187231.75e-072.86e-06227
Page: 1 2 3 

check button Enriched KEGG pathways.
Pathway IDTissueDisease StageDescriptionGene RatioBg Ratiopvaluep.adjustqvalueCount
Page: 1 

Top

Cell-cell communication analysis

check buttonIdentification of potential cell-cell interactions between two cell types and their ligand-receptor pairs for different disease states
LigandReceptorLRpairPathwayTissueDisease Stage
Page: 1 

Top

Single-cell gene regulatory network inference analysis

check buttonFind out the significant the regulons (TFs) and the target genes of each regulon across cell types for different disease states
TFCell TypeTissueDisease StageTarget GeneRSSRegulon Activity
∗The dot plots of a searched regulon are shown for all cell subpopulations in each disease state of each tissue based on the regulon specific score inferred using pySCENIC and by calculating the average expression.
Page: 1 

Top

Somatic mutation of malignant transformation related genes

check buttonAnnotation of somatic variants for genes involved in malignant transformation
Hugo SymbolVariant ClassVariant ClassificationdbSNP RSHGVScHGVSpHGVSp ShortSWISSPROTBIOTYPESIFTPolyPhenTumor Sample BarcodeTissueHistologySexAgeStageTherapy TypesDrugsOutcome
RNF220SNVMissense_Mutationnovelc.46N>Tp.Leu16Phep.L16FQ5VTB9protein_codingdeleterious(0)probably_damaging(0.979)TCGA-A7-A3RF-01Breastbreast invasive carcinomaFemale>=65I/IIHormone TherapyanastrozolePD
RNF220SNVMissense_Mutationc.1363G>Ap.Asp455Asnp.D455NQ5VTB9protein_codingdeleterious(0.04)probably_damaging(0.956)TCGA-AC-A23H-01Breastbreast invasive carcinomaFemale>=65I/IIUnknownUnknownPD
RNF220SNVMissense_Mutationc.475N>Cp.Asp159Hisp.D159HQ5VTB9protein_codingdeleterious(0.04)benign(0.308)TCGA-BH-A0W7-01Breastbreast invasive carcinomaFemale<65I/IIChemotherapytaxotereCR
RNF220SNVMissense_Mutationc.1156G>Cp.Glu386Glnp.E386QQ5VTB9protein_codingtolerated(0.06)probably_damaging(0.932)TCGA-EW-A1PD-01Breastbreast invasive carcinomaMale<65I/IIChemotherapydocetaxelSD
RNF220SNVMissense_Mutationrs539612817c.223N>Tp.Arg75Trpp.R75WQ5VTB9protein_codingdeleterious(0)probably_damaging(0.982)TCGA-OL-A97C-01Breastbreast invasive carcinomaFemale>=65I/IIUnknownUnknownPD
RNF220SNVMissense_Mutationnovelc.806C>Ap.Ser269Tyrp.S269YQ5VTB9protein_codingdeleterious(0)probably_damaging(0.962)TCGA-2W-A8YY-01Cervixcervical & endocervical cancerFemale<65I/IIChemotherapycisplatinCR
RNF220SNVMissense_Mutationrs377270177c.1511G>Ap.Arg504Glnp.R504QQ5VTB9protein_codingtolerated(0.09)benign(0.045)TCGA-C5-A1M7-01Cervixcervical & endocervical cancerFemale<65I/IIUnknownUnknownSD
RNF220SNVMissense_Mutationrs539612817c.223C>Tp.Arg75Trpp.R75WQ5VTB9protein_codingdeleterious(0)probably_damaging(0.982)TCGA-IR-A3LL-01Cervixcervical & endocervical cancerFemale<65I/IIChemotherapycisplatinCR
RNF220SNVMissense_Mutationrs776288553c.613N>Gp.Arg205Glyp.R205GQ5VTB9protein_codingdeleterious(0.05)probably_damaging(0.931)TCGA-JW-A5VL-01Cervixcervical & endocervical cancerFemale<65I/IIUnknownUnknownSD
RNF220SNVMissense_Mutationnovelc.917G>Cp.Arg306Prop.R306PQ5VTB9protein_codingdeleterious(0)probably_damaging(0.969)TCGA-VS-A9U6-01Cervixcervical & endocervical cancerFemale<65I/IIChemotherapycisplatinPD
Page: 1 2 3 4 5 6 7 8 

Top

Related drugs of malignant transformation related genes

check buttonIdentification of chemicals and drugs interact with genes involved in malignant transfromation
(DGIdb 4.0)
Entrez IDSymbolCategoryInteraction TypesDrug Claim NameDrug NamePMIDs
Page: 1