
|
|||||
|
 | |
| |
| |
| |
| |
| |
|
Gene: RNASEH1 |
Gene summary for RNASEH1 |
| Gene information | Species | Human | Gene symbol | RNASEH1 | Gene ID | 246243 |
| Gene name | ribonuclease H1 | |
| Gene Alias | H1RNA | |
| Cytomap | 2p25.3 | |
| Gene Type | protein-coding | GO ID | GO:0006139 | UniProtAcc | B3KUD4 |
Top |
Malignant transformation analysis |
| Identification of the aberrant gene expression in precancerous and cancerous lesions by comparing the gene expression of stem-like cells in diseased tissues with normal stem cells |
| Entrez ID | Symbol | Replicates | Species | Organ | Tissue | Adj P-value | Log2FC | Malignancy |
| 246243 | RNASEH1 | P84T-E | Human | Esophagus | ESCC | 3.37e-09 | 3.15e-01 | 0.0933 |
| 246243 | RNASEH1 | P89T-E | Human | Esophagus | ESCC | 1.77e-26 | 1.17e+00 | 0.1752 |
| 246243 | RNASEH1 | P91T-E | Human | Esophagus | ESCC | 1.69e-27 | 1.60e+00 | 0.1828 |
| 246243 | RNASEH1 | P104T-E | Human | Esophagus | ESCC | 9.44e-05 | 4.52e-01 | 0.0931 |
| 246243 | RNASEH1 | P107T-E | Human | Esophagus | ESCC | 1.24e-55 | 1.13e+00 | 0.171 |
| 246243 | RNASEH1 | P126T-E | Human | Esophagus | ESCC | 2.15e-17 | 7.12e-01 | 0.1125 |
| 246243 | RNASEH1 | P127T-E | Human | Esophagus | ESCC | 2.58e-30 | 4.74e-01 | 0.0826 |
| 246243 | RNASEH1 | P128T-E | Human | Esophagus | ESCC | 2.99e-52 | 1.10e+00 | 0.1241 |
| 246243 | RNASEH1 | P130T-E | Human | Esophagus | ESCC | 1.26e-76 | 1.27e+00 | 0.1676 |
| 246243 | RNASEH1 | HCC1_Meng | Human | Liver | HCC | 4.51e-68 | 2.01e-01 | 0.0246 |
| 246243 | RNASEH1 | HCC2_Meng | Human | Liver | HCC | 3.26e-04 | 3.37e-02 | 0.0107 |
| 246243 | RNASEH1 | HCC2 | Human | Liver | HCC | 6.62e-09 | 2.50e+00 | 0.5341 |
| 246243 | RNASEH1 | Pt13.b | Human | Liver | HCC | 1.16e-05 | 1.44e-01 | 0.0251 |
| 246243 | RNASEH1 | Pt14.a | Human | Liver | HCC | 3.48e-03 | 2.46e-01 | 0.0169 |
| 246243 | RNASEH1 | S014 | Human | Liver | HCC | 1.44e-16 | 5.66e-01 | 0.2254 |
| 246243 | RNASEH1 | S015 | Human | Liver | HCC | 3.33e-16 | 8.05e-01 | 0.2375 |
| 246243 | RNASEH1 | S016 | Human | Liver | HCC | 9.41e-16 | 5.83e-01 | 0.2243 |
| 246243 | RNASEH1 | S027 | Human | Liver | HCC | 2.24e-10 | 9.39e-01 | 0.2446 |
| 246243 | RNASEH1 | S028 | Human | Liver | HCC | 1.01e-25 | 9.67e-01 | 0.2503 |
| 246243 | RNASEH1 | S029 | Human | Liver | HCC | 2.73e-24 | 9.72e-01 | 0.2581 |
| Page: 1 2 3 4 5 6 |
| Tissue | Expression Dynamics | Abbreviation |
| Esophagus | 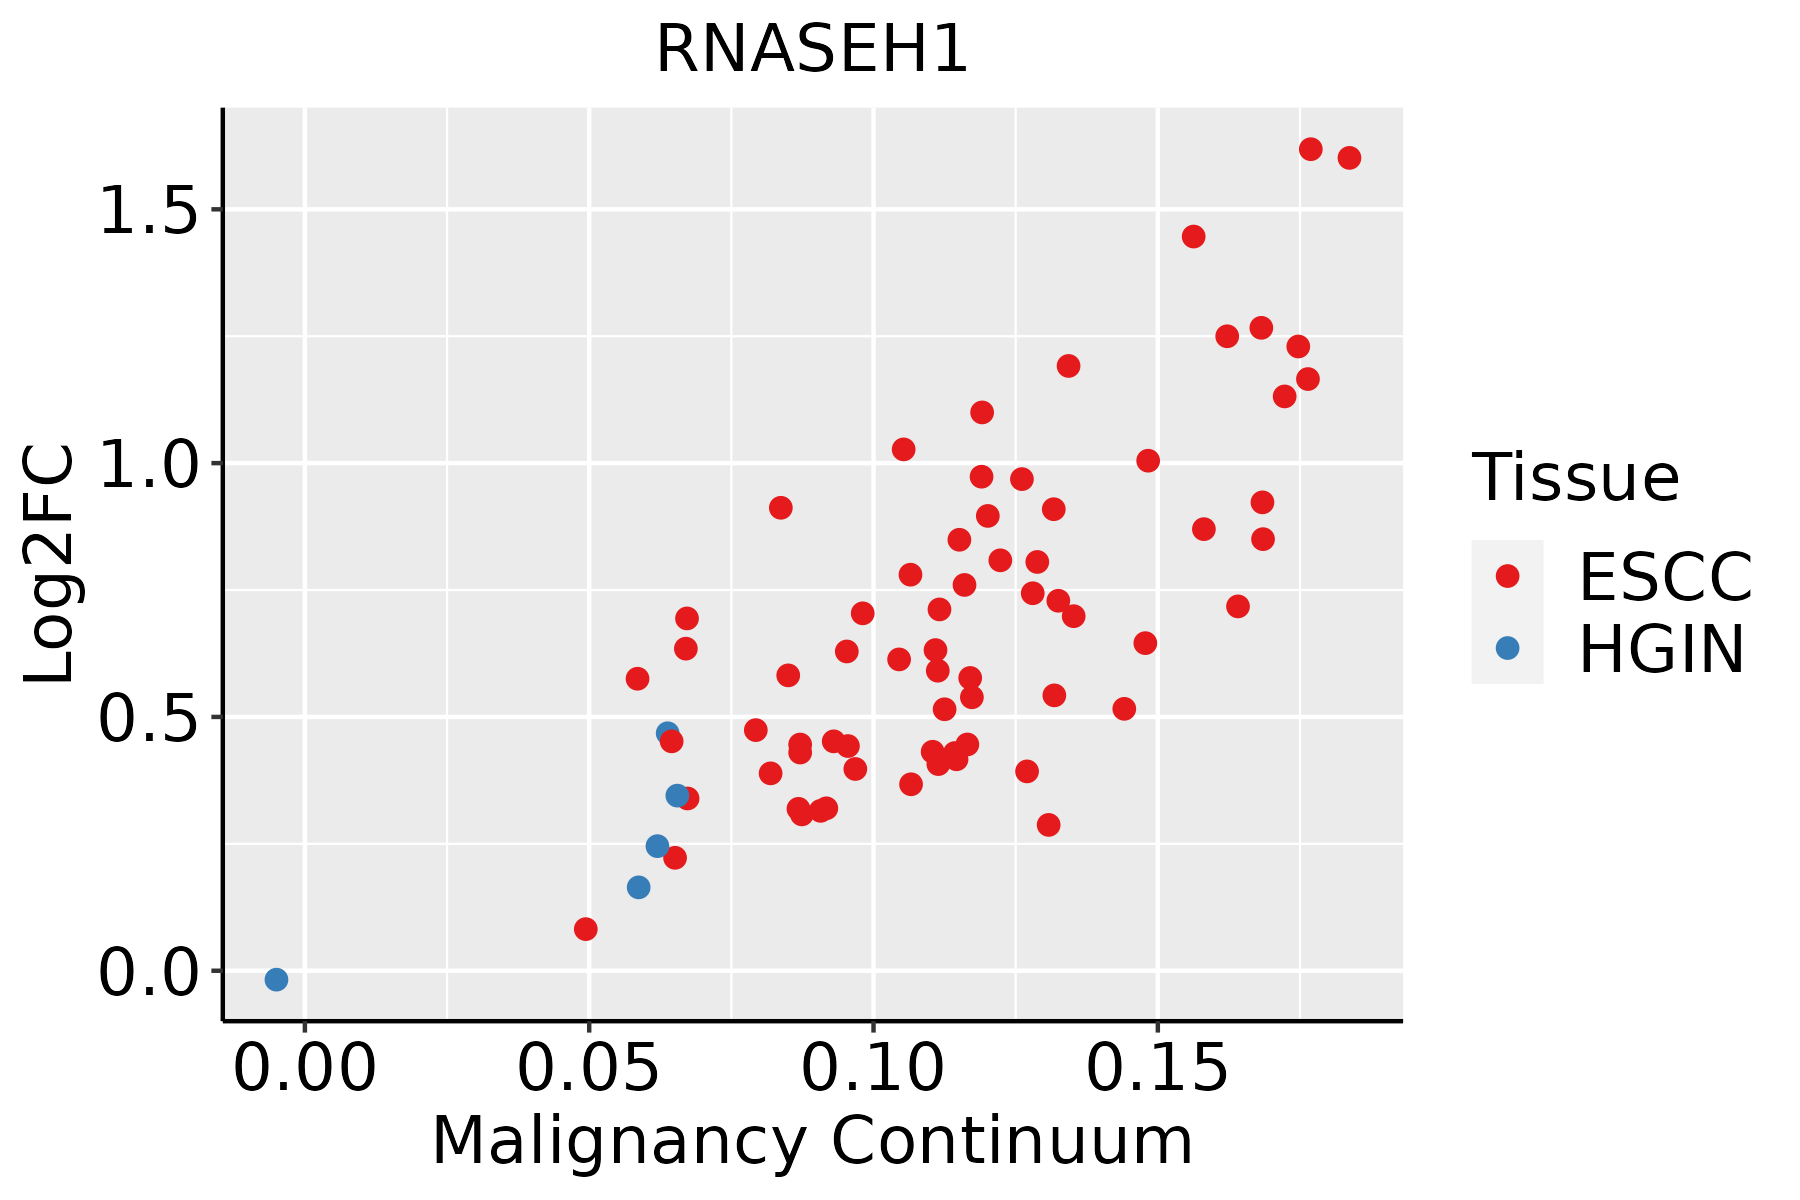 | ESCC: Esophageal squamous cell carcinoma |
| HGIN: High-grade intraepithelial neoplasias | ||
| LGIN: Low-grade intraepithelial neoplasias | ||
| Liver | 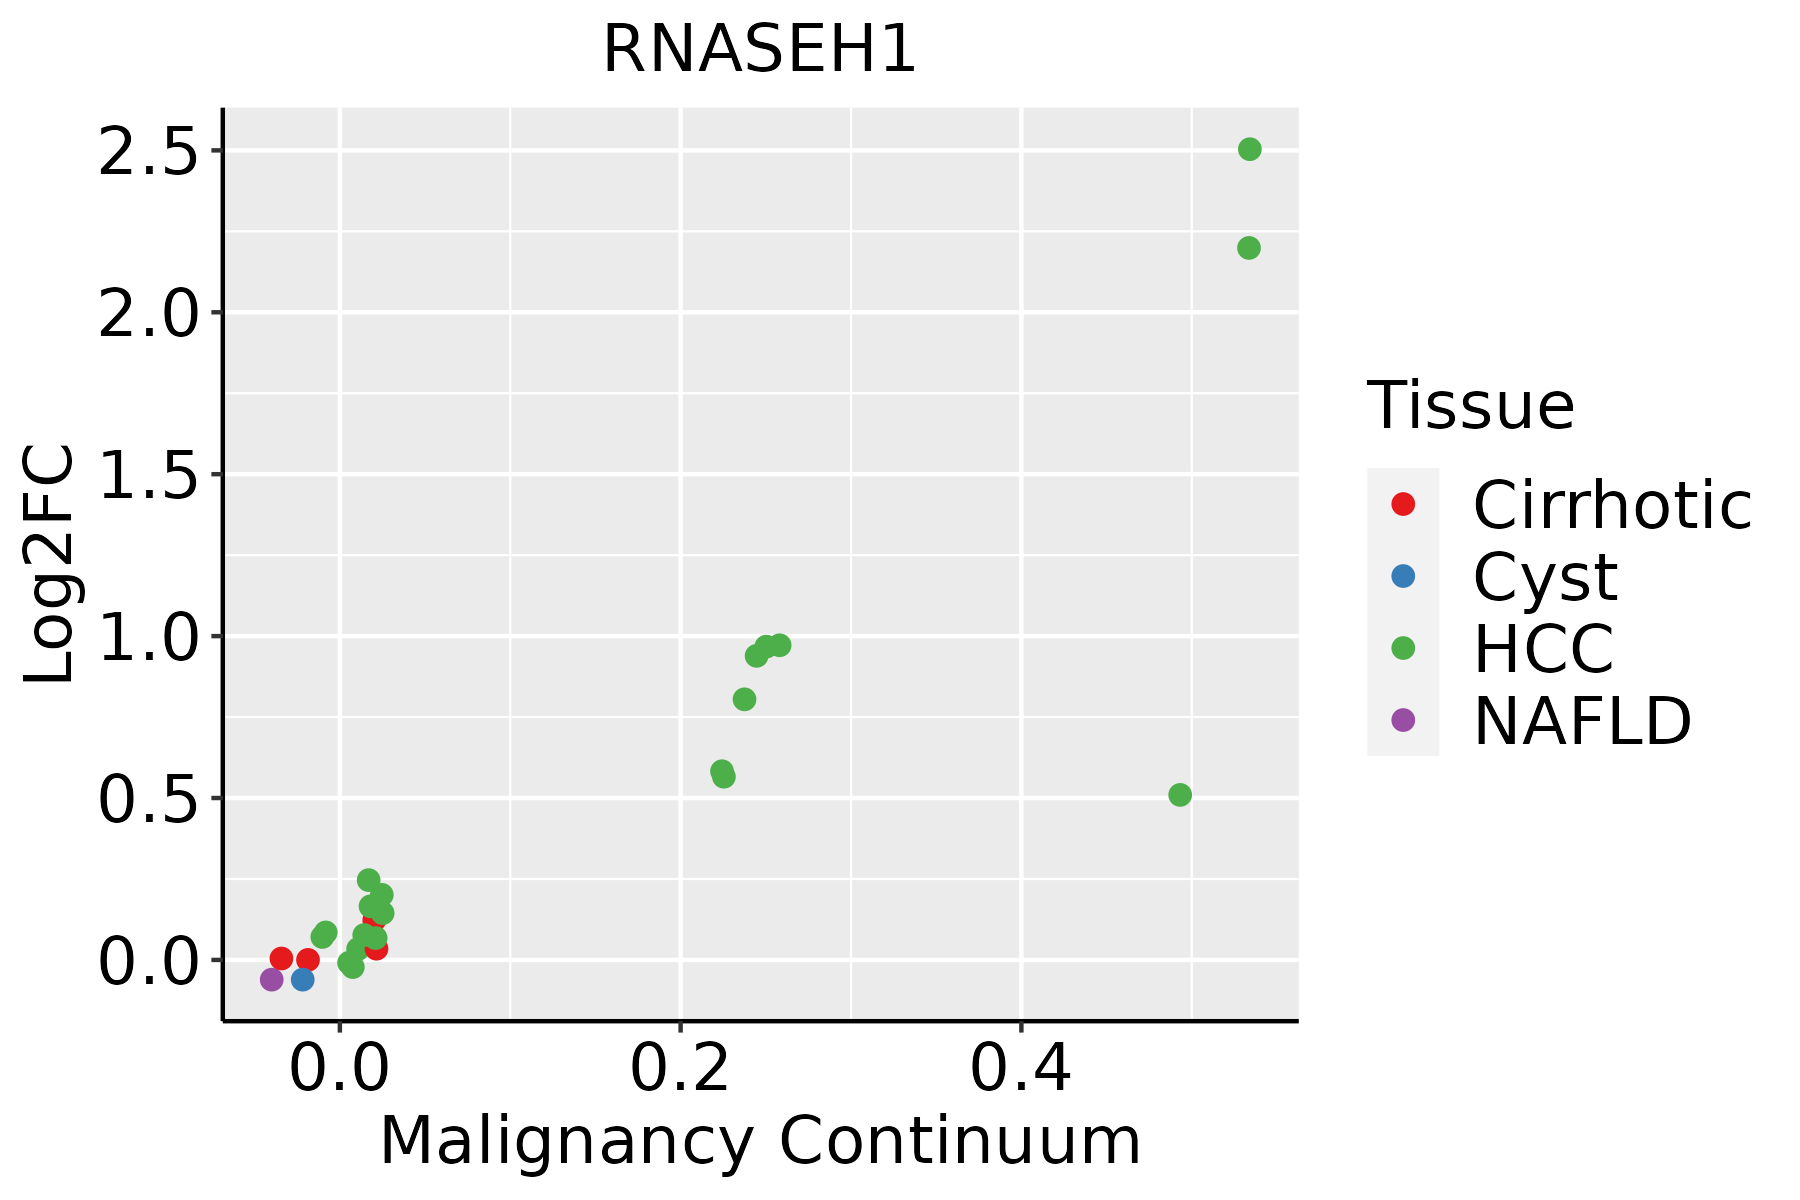 | HCC: Hepatocellular carcinoma |
| NAFLD: Non-alcoholic fatty liver disease | ||
| Oral Cavity | 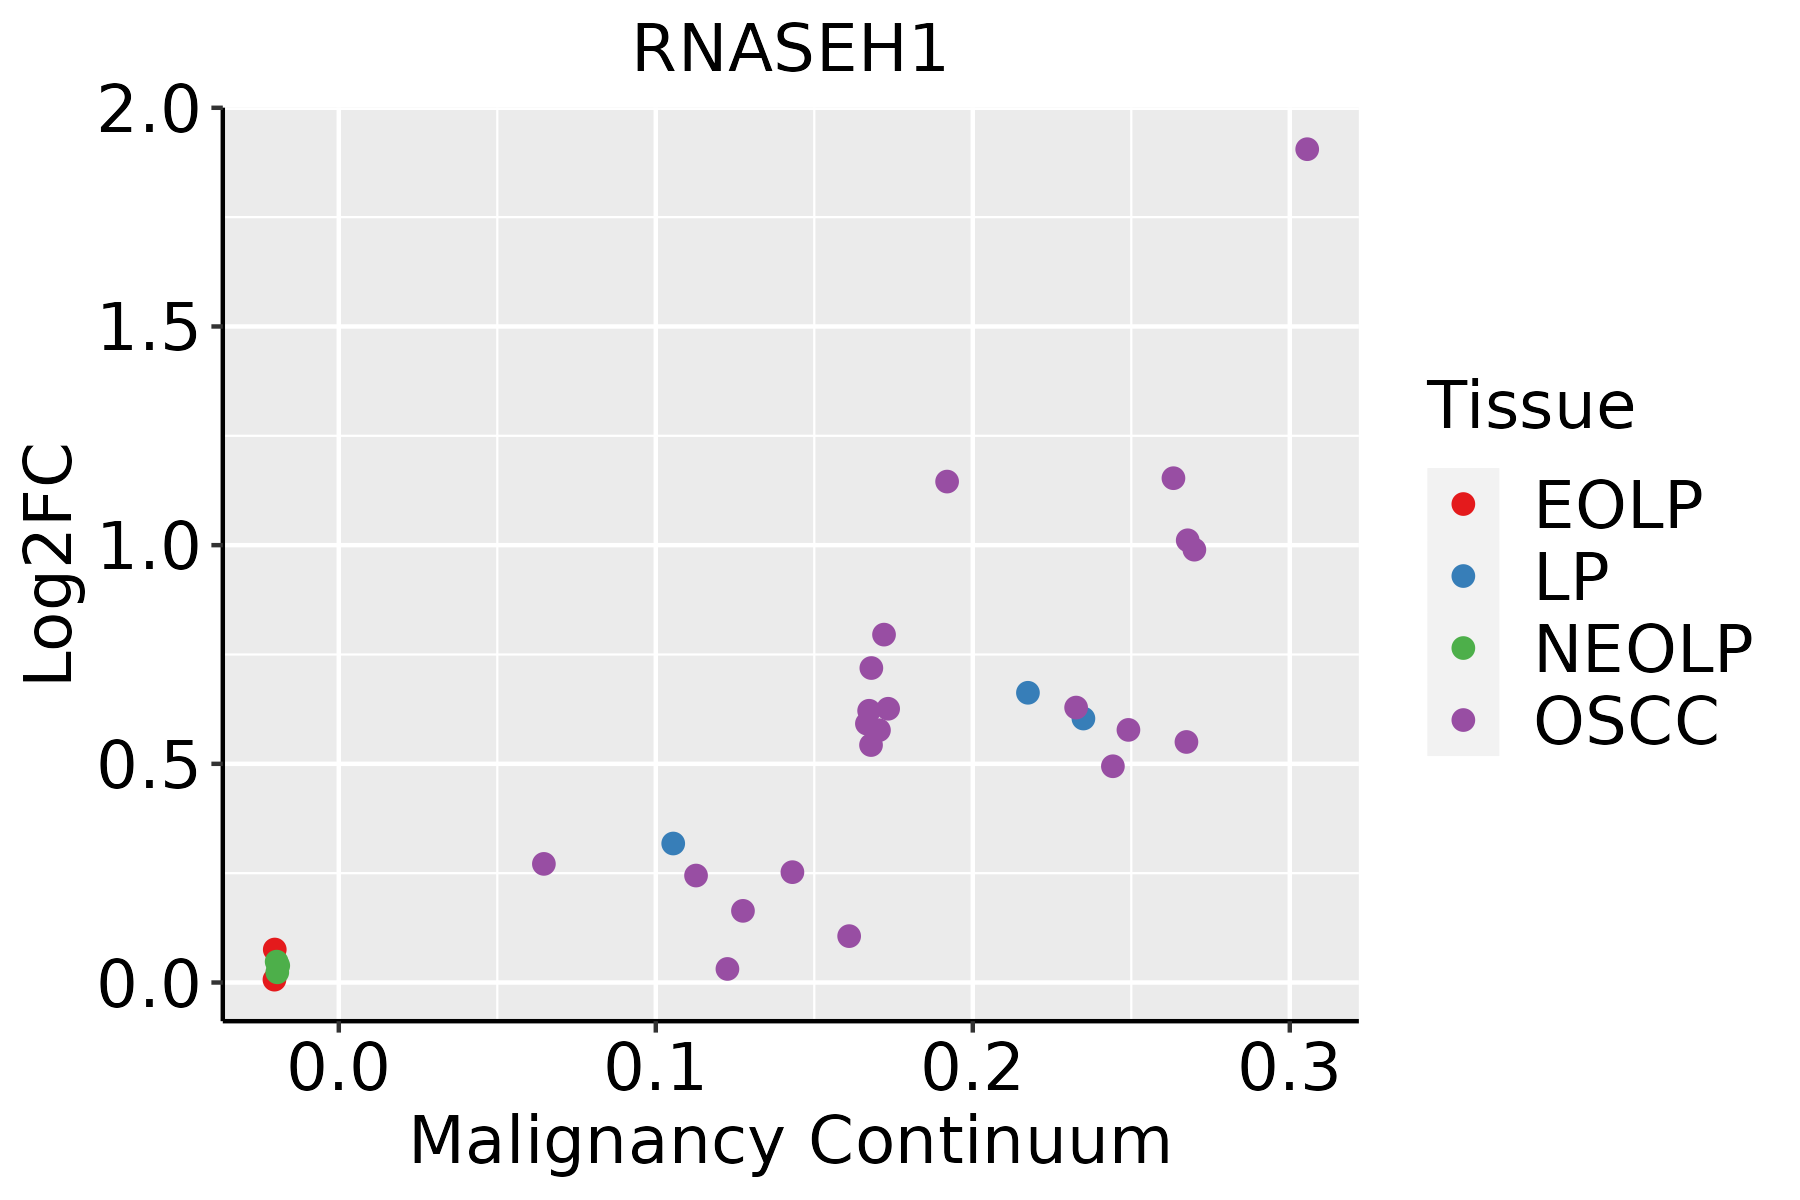 | EOLP: Erosive Oral lichen planus |
| LP: leukoplakia | ||
| NEOLP: Non-erosive oral lichen planus | ||
| OSCC: Oral squamous cell carcinoma | ||
| Skin | 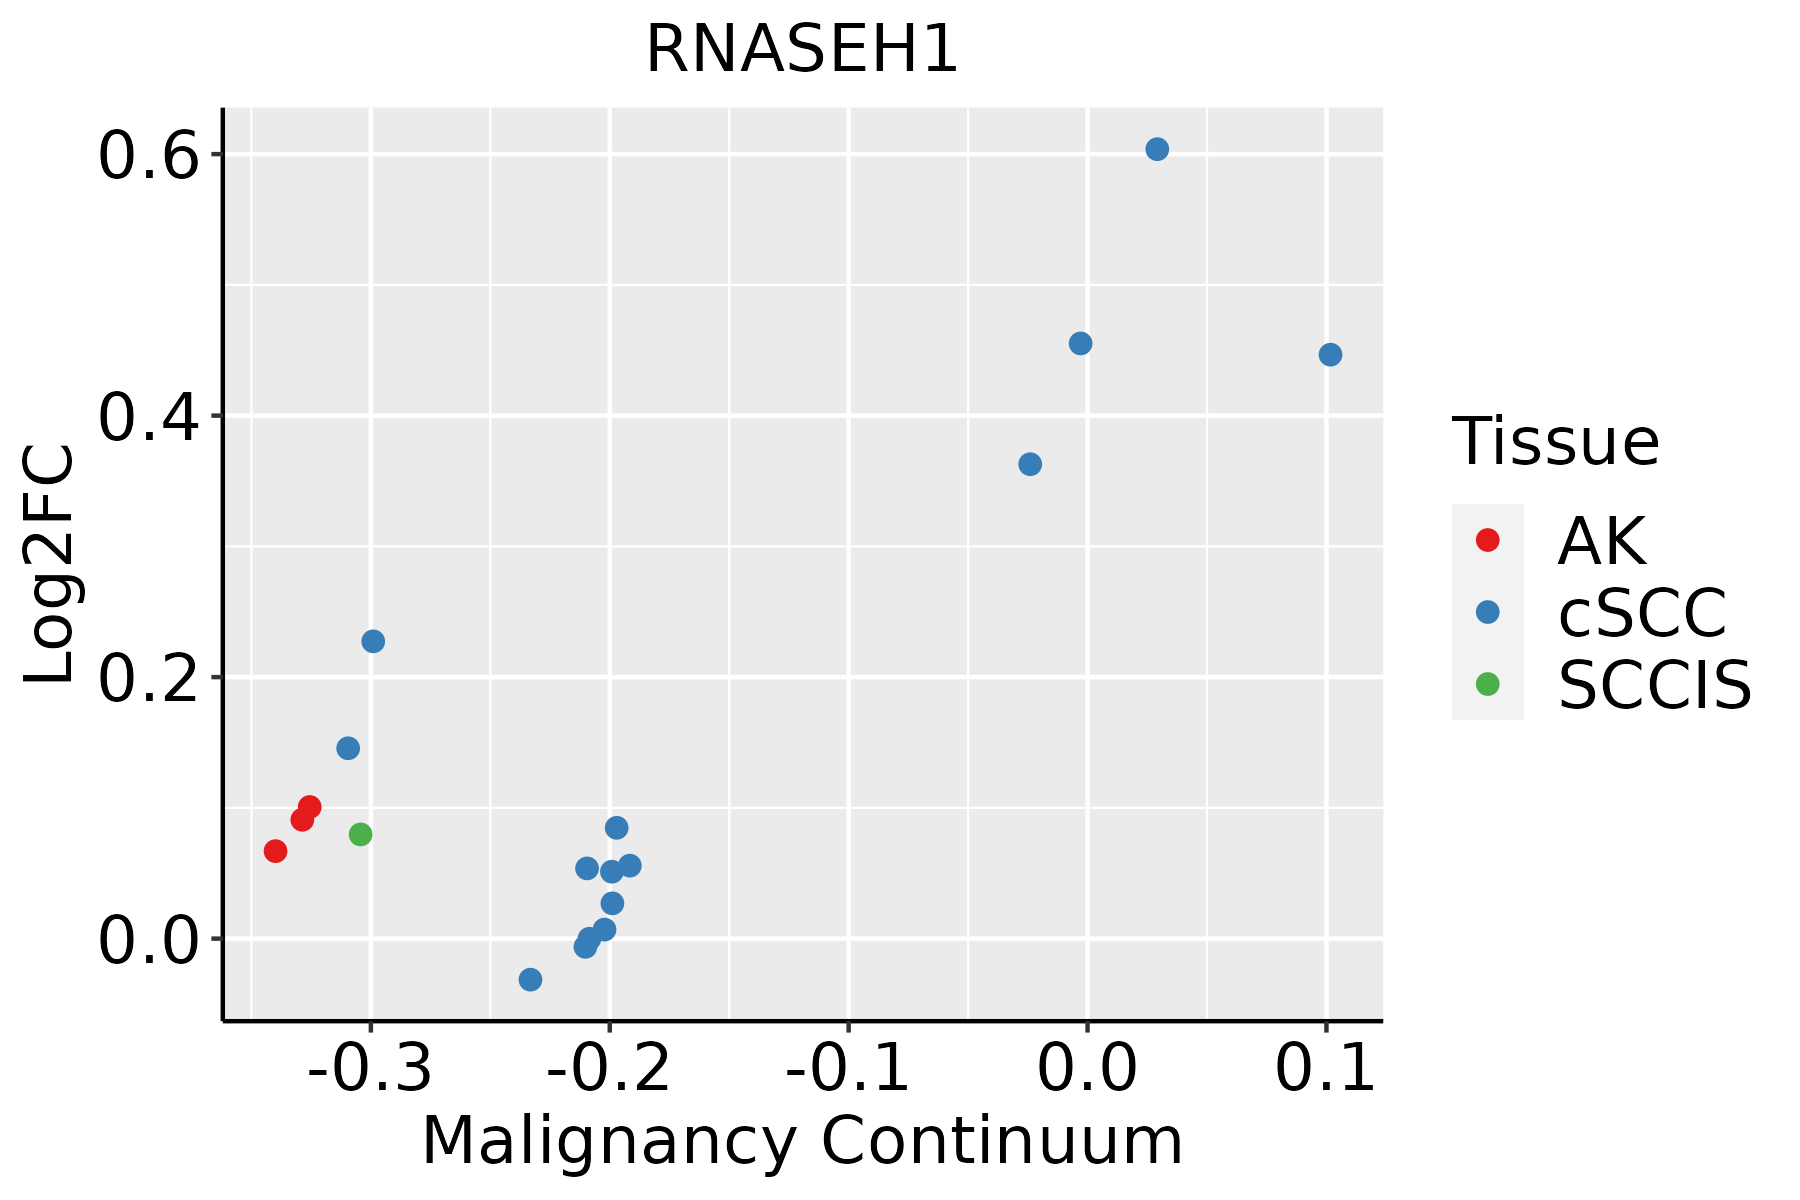 | AK: Actinic keratosis |
| cSCC: Cutaneous squamous cell carcinoma | ||
| SCCIS:squamous cell carcinoma in situ | ||
| Thyroid | 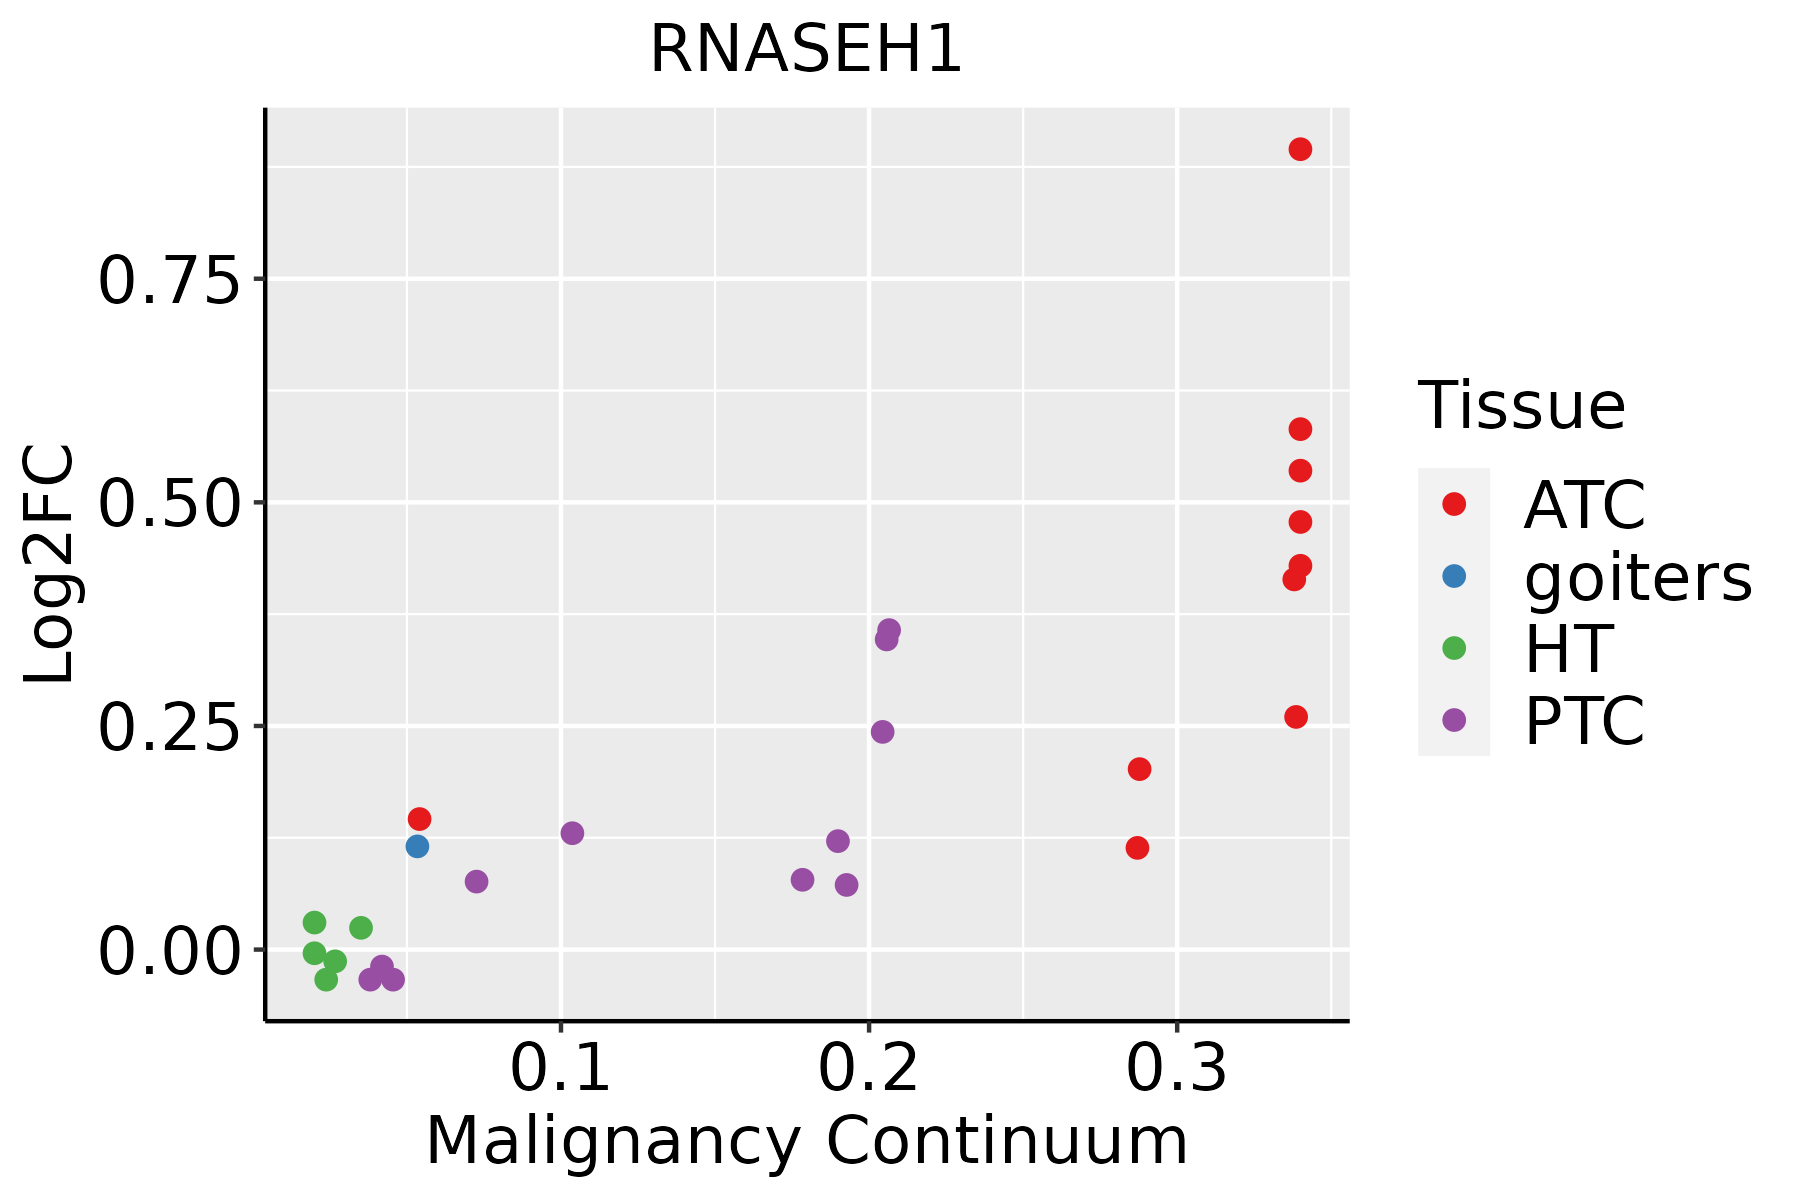 | ATC: Anaplastic thyroid cancer |
| HT: Hashimoto's thyroiditis | ||
| PTC: Papillary thyroid cancer |
| ∗log2FC in expression of this searched gene in stem-like cells from each diseased tissue sample relative to stem-like cells in normal samples in each tissue plotted against the malignancy continuum. Samples are colored based on if they are from different disease stage. |
Top |
Malignant transformation related pathway analysis |
| Find out the enriched GO biological processes and KEGG pathways involved in transition from healthy to precancer to cancer |
| Tissue | Disease Stage | Enriched GO biological Processes |
| Colorectum | AD |  |
| Colorectum | SER |  |
| Colorectum | MSS |  |
| Colorectum | MSI-H |  |
| Colorectum | FAP |  |
| ∗Top 15 enriched GO BP terms are showed in the bar plot of each disease state in each tissue. Each row represents a significant GO biological process which is colored according to the -log10(p.adjust). |
| Page: 1 2 3 4 5 6 7 8 9 |
| GO ID | Tissue | Disease Stage | Description | Gene Ratio | Bg Ratio | pvalue | p.adjust | Count |
| GO:000640120 | Esophagus | HGIN | RNA catabolic process | 77/2587 | 278/18723 | 7.63e-10 | 6.36e-08 | 77 |
| GO:003465519 | Esophagus | HGIN | nucleobase-containing compound catabolic process | 98/2587 | 407/18723 | 1.44e-08 | 8.94e-07 | 98 |
| GO:004670017 | Esophagus | HGIN | heterocycle catabolic process | 103/2587 | 445/18723 | 5.44e-08 | 2.99e-06 | 103 |
| GO:004427018 | Esophagus | HGIN | cellular nitrogen compound catabolic process | 103/2587 | 451/18723 | 1.10e-07 | 5.56e-06 | 103 |
| GO:001943917 | Esophagus | HGIN | aromatic compound catabolic process | 105/2587 | 467/18723 | 1.89e-07 | 9.31e-06 | 105 |
| GO:190136117 | Esophagus | HGIN | organic cyclic compound catabolic process | 106/2587 | 495/18723 | 1.94e-06 | 7.13e-05 | 106 |
| GO:0006401110 | Esophagus | ESCC | RNA catabolic process | 204/8552 | 278/18723 | 3.39e-21 | 5.66e-19 | 204 |
| GO:0034655110 | Esophagus | ESCC | nucleobase-containing compound catabolic process | 272/8552 | 407/18723 | 2.92e-18 | 2.90e-16 | 272 |
| GO:004670018 | Esophagus | ESCC | heterocycle catabolic process | 286/8552 | 445/18723 | 1.12e-15 | 7.47e-14 | 286 |
| GO:004427019 | Esophagus | ESCC | cellular nitrogen compound catabolic process | 288/8552 | 451/18723 | 3.03e-15 | 1.79e-13 | 288 |
| GO:001943918 | Esophagus | ESCC | aromatic compound catabolic process | 295/8552 | 467/18723 | 1.09e-14 | 5.98e-13 | 295 |
| GO:190136118 | Esophagus | ESCC | organic cyclic compound catabolic process | 307/8552 | 495/18723 | 9.99e-14 | 4.80e-12 | 307 |
| GO:00905013 | Esophagus | ESCC | RNA phosphodiester bond hydrolysis | 110/8552 | 152/18723 | 1.95e-11 | 6.81e-10 | 110 |
| GO:00903053 | Esophagus | ESCC | nucleic acid phosphodiester bond hydrolysis | 163/8552 | 261/18723 | 3.07e-08 | 5.73e-07 | 163 |
| GO:00905023 | Esophagus | ESCC | RNA phosphodiester bond hydrolysis, endonucleolytic | 55/8552 | 82/18723 | 7.34e-05 | 5.51e-04 | 55 |
| GO:004427021 | Liver | HCC | cellular nitrogen compound catabolic process | 303/7958 | 451/18723 | 9.76e-27 | 3.64e-24 | 303 |
| GO:004670021 | Liver | HCC | heterocycle catabolic process | 299/7958 | 445/18723 | 2.07e-26 | 7.29e-24 | 299 |
| GO:190136121 | Liver | HCC | organic cyclic compound catabolic process | 325/7958 | 495/18723 | 6.52e-26 | 2.18e-23 | 325 |
| GO:001943921 | Liver | HCC | aromatic compound catabolic process | 309/7958 | 467/18723 | 1.56e-25 | 4.94e-23 | 309 |
| GO:000640121 | Liver | HCC | RNA catabolic process | 201/7958 | 278/18723 | 3.88e-24 | 1.02e-21 | 201 |
| Page: 1 2 3 4 |
| Pathway ID | Tissue | Disease Stage | Description | Gene Ratio | Bg Ratio | pvalue | p.adjust | qvalue | Count |
| hsa030304 | Esophagus | ESCC | DNA replication | 32/4205 | 36/8465 | 7.71e-07 | 5.06e-06 | 2.59e-06 | 32 |
| hsa0303011 | Esophagus | ESCC | DNA replication | 32/4205 | 36/8465 | 7.71e-07 | 5.06e-06 | 2.59e-06 | 32 |
| hsa03030 | Oral cavity | OSCC | DNA replication | 31/3704 | 36/8465 | 1.70e-07 | 1.19e-06 | 6.03e-07 | 31 |
| hsa030301 | Oral cavity | OSCC | DNA replication | 31/3704 | 36/8465 | 1.70e-07 | 1.19e-06 | 6.03e-07 | 31 |
| hsa030302 | Oral cavity | LP | DNA replication | 23/2418 | 36/8465 | 1.08e-05 | 7.79e-05 | 5.02e-05 | 23 |
| hsa030303 | Oral cavity | LP | DNA replication | 23/2418 | 36/8465 | 1.08e-05 | 7.79e-05 | 5.02e-05 | 23 |
| Page: 1 |
Top |
Cell-cell communication analysis |
| Identification of potential cell-cell interactions between two cell types and their ligand-receptor pairs for different disease states |
| Ligand | Receptor | LRpair | Pathway | Tissue | Disease Stage |
| Page: 1 |
Top |
Single-cell gene regulatory network inference analysis |
| Find out the significant the regulons (TFs) and the target genes of each regulon across cell types for different disease states |
| TF | Cell Type | Tissue | Disease Stage | Target Gene | RSS | Regulon Activity |
| ∗The dot plots of a searched regulon are shown for all cell subpopulations in each disease state of each tissue based on the regulon specific score inferred using pySCENIC and by calculating the average expression. |
| Page: 1 |
Top |
Somatic mutation of malignant transformation related genes |
| Annotation of somatic variants for genes involved in malignant transformation |
| Hugo Symbol | Variant Class | Variant Classification | dbSNP RS | HGVSc | HGVSp | HGVSp Short | SWISSPROT | BIOTYPE | SIFT | PolyPhen | Tumor Sample Barcode | Tissue | Histology | Sex | Age | Stage | Therapy Types | Drugs | Outcome |
| RNASEH1 | SNV | Missense_Mutation | c.67C>G | p.Arg23Gly | p.R23G | O60930 | protein_coding | tolerated_low_confidence(0.49) | benign(0) | TCGA-AR-A0TX-01 | Breast | breast invasive carcinoma | Female | <65 | I/II | Unknown | Unknown | SD | |
| RNASEH1 | SNV | Missense_Mutation | rs750326241 | c.293N>A | p.Arg98Gln | p.R98Q | O60930 | protein_coding | tolerated(0.12) | possibly_damaging(0.907) | TCGA-CK-4951-01 | Colorectum | colon adenocarcinoma | Female | >=65 | I/II | Unknown | Unknown | PD |
| RNASEH1 | SNV | Missense_Mutation | novel | c.479N>G | p.Ile160Ser | p.I160S | O60930 | protein_coding | deleterious(0) | probably_damaging(0.992) | TCGA-A5-A0G1-01 | Endometrium | uterine corpus endometrioid carcinoma | Female | >=65 | I/II | Unknown | Unknown | SD |
| RNASEH1 | SNV | Missense_Mutation | novel | c.632N>T | p.Ser211Ile | p.S211I | O60930 | protein_coding | deleterious(0) | probably_damaging(1) | TCGA-A5-A0G2-01 | Endometrium | uterine corpus endometrioid carcinoma | Female | <65 | III/IV | Unknown | Unknown | SD |
| RNASEH1 | SNV | Missense_Mutation | c.763N>A | p.Asp255Asn | p.D255N | O60930 | protein_coding | tolerated(0.07) | benign(0.246) | TCGA-AP-A051-01 | Endometrium | uterine corpus endometrioid carcinoma | Female | >=65 | I/II | Unknown | Unknown | SD | |
| RNASEH1 | SNV | Missense_Mutation | c.253N>C | p.Asn85His | p.N85H | O60930 | protein_coding | tolerated(0.08) | benign(0.346) | TCGA-AP-A056-01 | Endometrium | uterine corpus endometrioid carcinoma | Female | <65 | I/II | Unknown | Unknown | SD | |
| RNASEH1 | SNV | Missense_Mutation | c.793N>G | p.Ser265Ala | p.S265A | O60930 | protein_coding | tolerated(0.72) | benign(0.003) | TCGA-AX-A05Z-01 | Endometrium | uterine corpus endometrioid carcinoma | Female | <65 | III/IV | Chemotherapy | adriamycin | SD | |
| RNASEH1 | SNV | Missense_Mutation | rs187577328 | c.641N>T | p.Thr214Met | p.T214M | O60930 | protein_coding | deleterious(0.03) | probably_damaging(0.998) | TCGA-AX-A1CE-01 | Endometrium | uterine corpus endometrioid carcinoma | Female | <65 | I/II | Unspecific | Paclitaxel | SD |
| RNASEH1 | SNV | Missense_Mutation | novel | c.572G>A | p.Cys191Tyr | p.C191Y | O60930 | protein_coding | deleterious(0.03) | possibly_damaging(0.891) | TCGA-DF-A2KU-01 | Endometrium | uterine corpus endometrioid carcinoma | Female | Unknown | I/II | Unknown | Unknown | SD |
| RNASEH1 | SNV | Missense_Mutation | novel | c.760N>G | p.Met254Val | p.M254V | O60930 | protein_coding | tolerated(0.12) | benign(0.028) | TCGA-DF-A2KY-01 | Endometrium | uterine corpus endometrioid carcinoma | Female | <65 | III/IV | Chemotherapy | carboplatin | SD |
| Page: 1 2 3 |
Top |
Related drugs of malignant transformation related genes |
| Identification of chemicals and drugs interact with genes involved in malignant transfromation |
| (DGIdb 4.0) |
| Entrez ID | Symbol | Category | Interaction Types | Drug Claim Name | Drug Name | PMIDs |
| Page: 1 |

Copyright 2023-Present -The University of Texas Health Science Center at Houston |