
|
|||||
|
 | |
| |
| |
| |
| |
| |
|
Gene: RFXANK |
Gene summary for RFXANK |
| Gene information | Species | Human | Gene symbol | RFXANK | Gene ID | 8625 |
| Gene name | regulatory factor X associated ankyrin containing protein | |
| Gene Alias | ANKRA1 | |
| Cytomap | 19p13.11 | |
| Gene Type | protein-coding | GO ID | GO:0006139 | UniProtAcc | O14593 |
Top |
Malignant transformation analysis |
| Identification of the aberrant gene expression in precancerous and cancerous lesions by comparing the gene expression of stem-like cells in diseased tissues with normal stem cells |
| Entrez ID | Symbol | Replicates | Species | Organ | Tissue | Adj P-value | Log2FC | Malignancy |
| 8625 | RFXANK | P91T-E | Human | Esophagus | ESCC | 1.70e-17 | 1.70e+00 | 0.1828 |
| 8625 | RFXANK | P94T-E | Human | Esophagus | ESCC | 5.12e-04 | 5.52e-01 | 0.0879 |
| 8625 | RFXANK | P104T-E | Human | Esophagus | ESCC | 3.46e-08 | 6.01e-01 | 0.0931 |
| 8625 | RFXANK | P107T-E | Human | Esophagus | ESCC | 7.36e-43 | 1.02e+00 | 0.171 |
| 8625 | RFXANK | P126T-E | Human | Esophagus | ESCC | 2.97e-07 | 8.24e-01 | 0.1125 |
| 8625 | RFXANK | P127T-E | Human | Esophagus | ESCC | 5.41e-19 | 3.06e-01 | 0.0826 |
| 8625 | RFXANK | P128T-E | Human | Esophagus | ESCC | 2.62e-45 | 1.35e+00 | 0.1241 |
| 8625 | RFXANK | P130T-E | Human | Esophagus | ESCC | 2.19e-54 | 1.09e+00 | 0.1676 |
| 8625 | RFXANK | HCC1_Meng | Human | Liver | HCC | 1.03e-81 | 2.25e-01 | 0.0246 |
| 8625 | RFXANK | HCC2_Meng | Human | Liver | HCC | 1.76e-29 | 1.21e-01 | 0.0107 |
| 8625 | RFXANK | cirrhotic1 | Human | Liver | Cirrhotic | 4.69e-07 | 1.64e-01 | 0.0202 |
| 8625 | RFXANK | cirrhotic2 | Human | Liver | Cirrhotic | 8.04e-05 | 1.05e-01 | 0.0201 |
| 8625 | RFXANK | cirrhotic3 | Human | Liver | Cirrhotic | 8.09e-08 | 1.95e-01 | 0.0215 |
| 8625 | RFXANK | HCC2 | Human | Liver | HCC | 4.60e-04 | 3.08e+00 | 0.5341 |
| 8625 | RFXANK | Pt13.b | Human | Liver | HCC | 1.68e-06 | 9.38e-02 | 0.0251 |
| 8625 | RFXANK | Pt14.a | Human | Liver | HCC | 8.84e-04 | 2.44e-01 | 0.0169 |
| 8625 | RFXANK | Pt14.b | Human | Liver | HCC | 1.54e-07 | 3.08e-01 | 0.018 |
| 8625 | RFXANK | S014 | Human | Liver | HCC | 2.35e-28 | 1.21e+00 | 0.2254 |
| 8625 | RFXANK | S015 | Human | Liver | HCC | 6.49e-30 | 1.47e+00 | 0.2375 |
| 8625 | RFXANK | S016 | Human | Liver | HCC | 6.22e-33 | 1.17e+00 | 0.2243 |
| Page: 1 2 3 4 5 6 7 |
| Tissue | Expression Dynamics | Abbreviation |
| Esophagus | 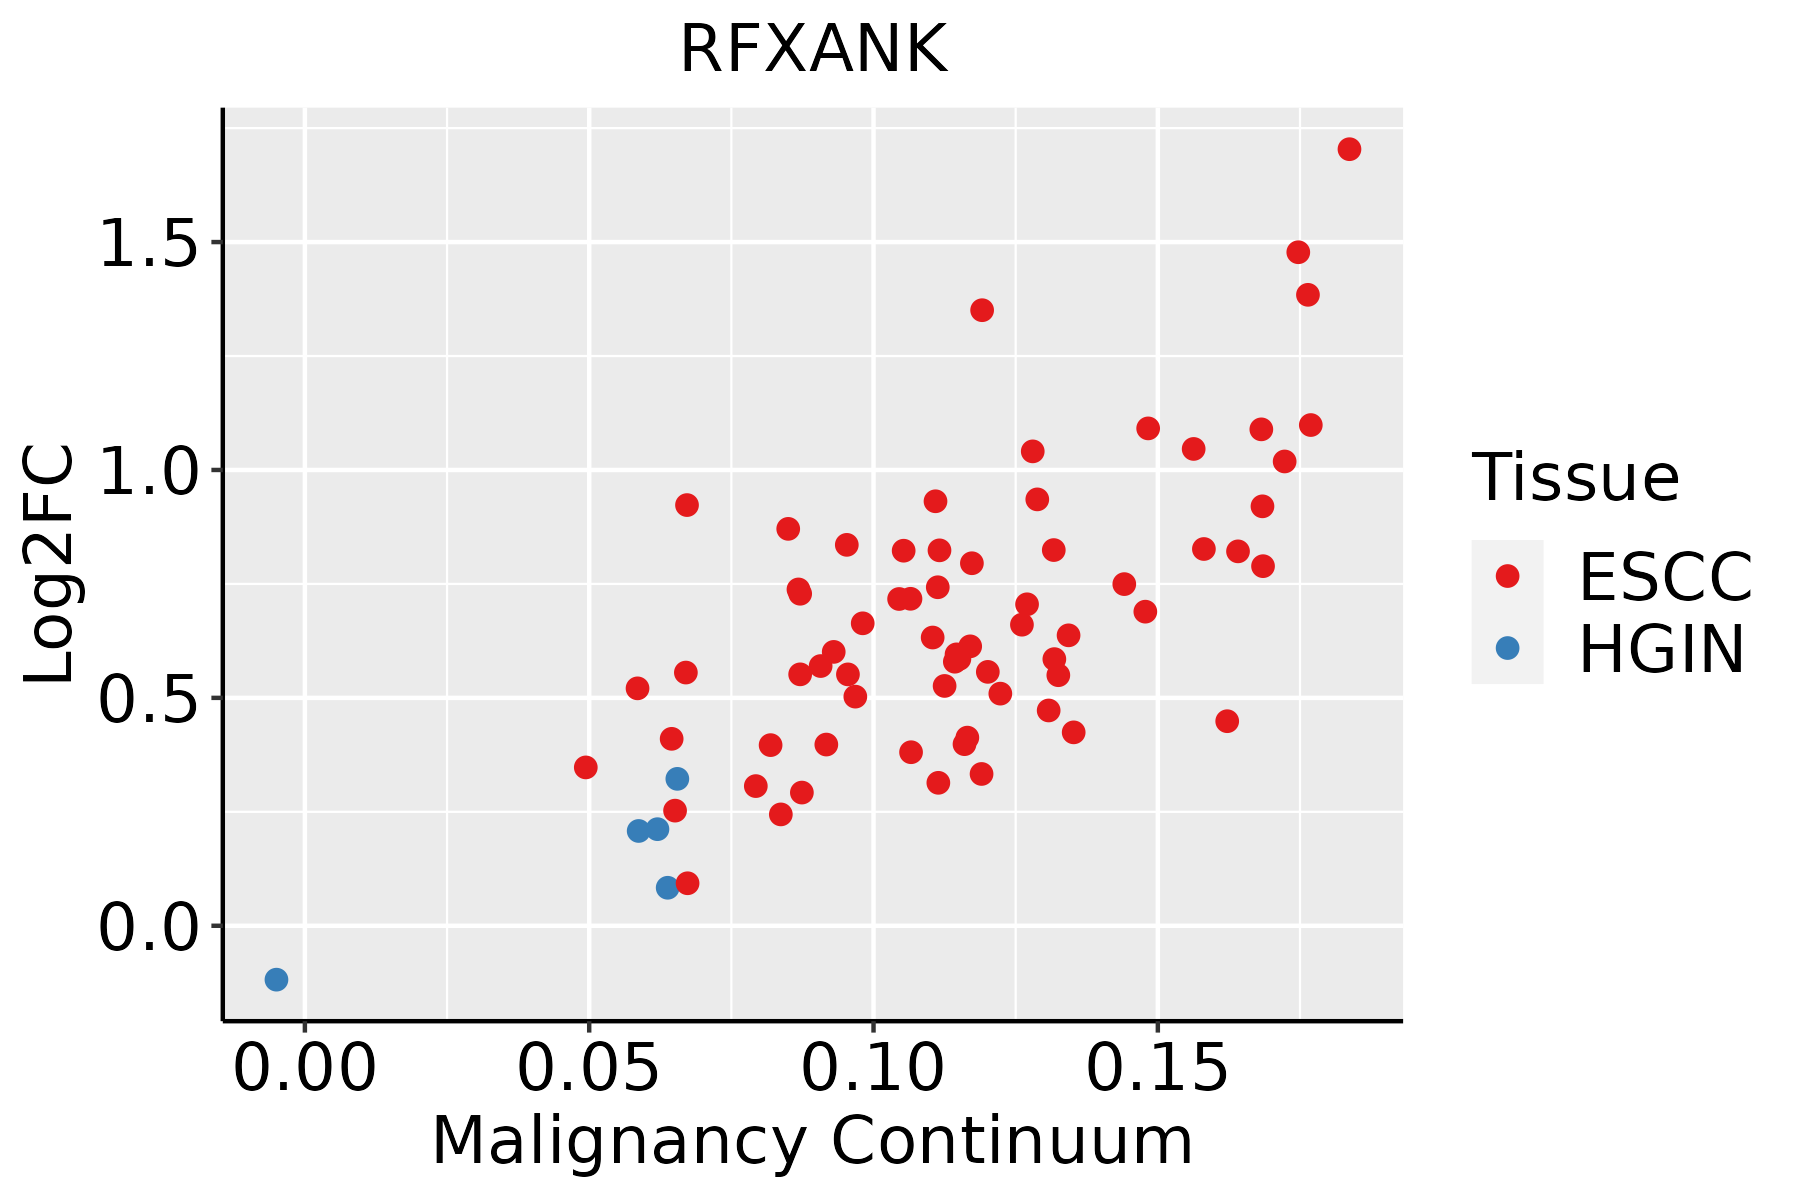 | ESCC: Esophageal squamous cell carcinoma |
| HGIN: High-grade intraepithelial neoplasias | ||
| LGIN: Low-grade intraepithelial neoplasias | ||
| Liver | 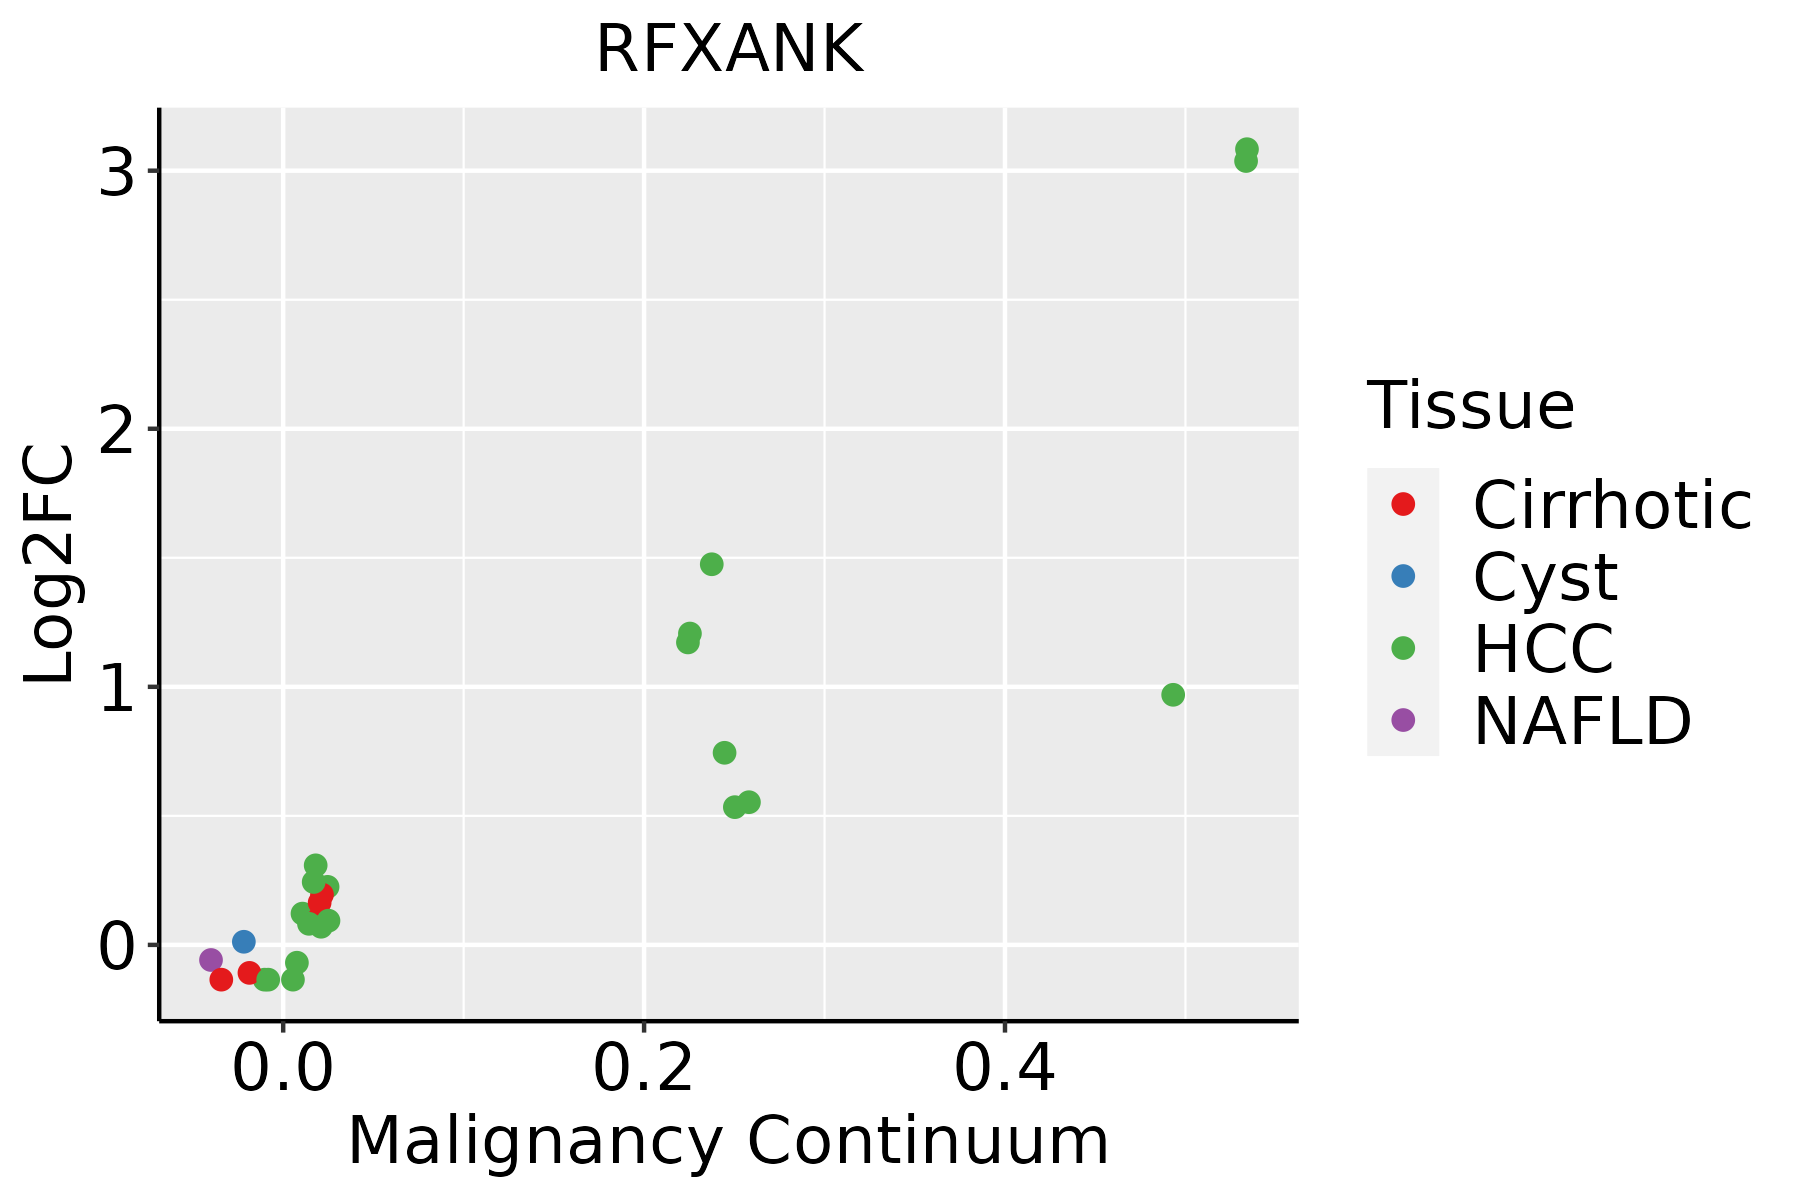 | HCC: Hepatocellular carcinoma |
| NAFLD: Non-alcoholic fatty liver disease | ||
| Oral Cavity | 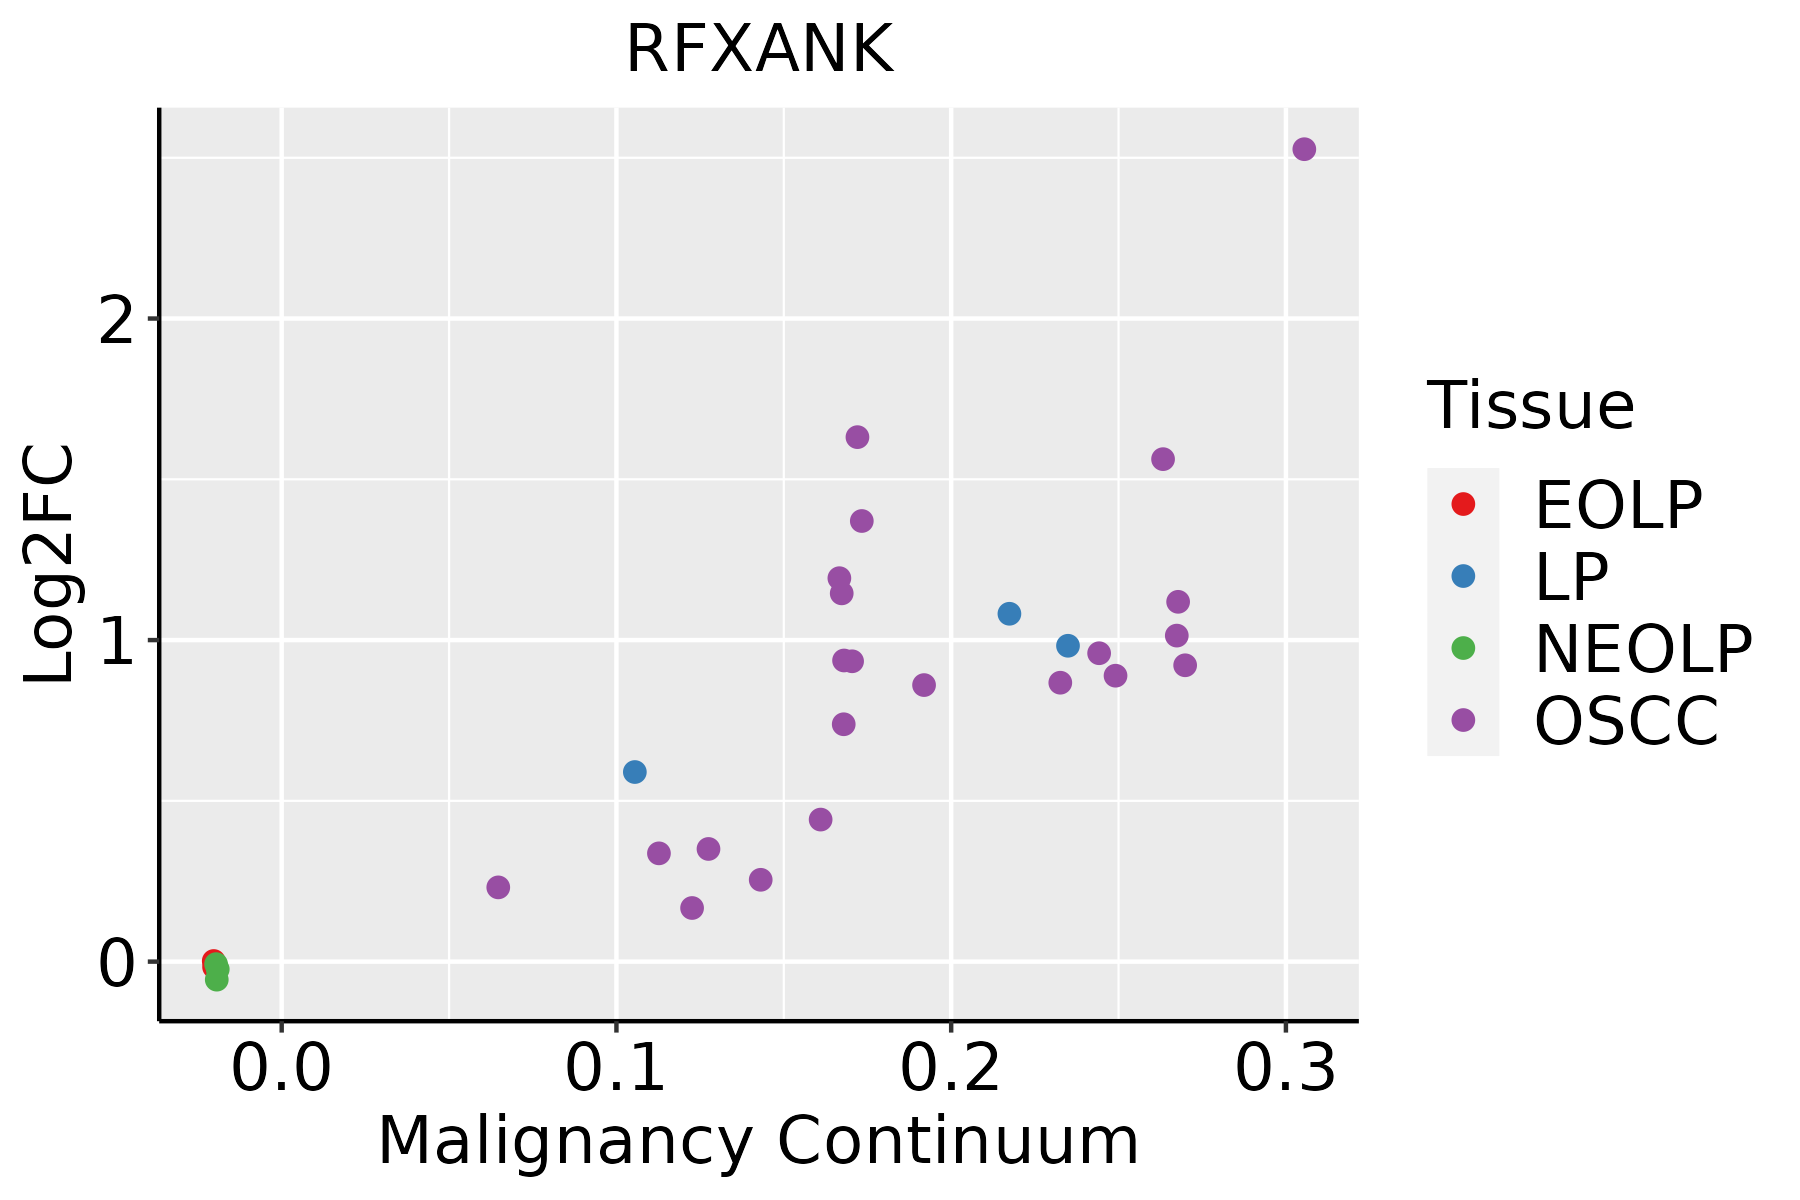 | EOLP: Erosive Oral lichen planus |
| LP: leukoplakia | ||
| NEOLP: Non-erosive oral lichen planus | ||
| OSCC: Oral squamous cell carcinoma | ||
| Skin | 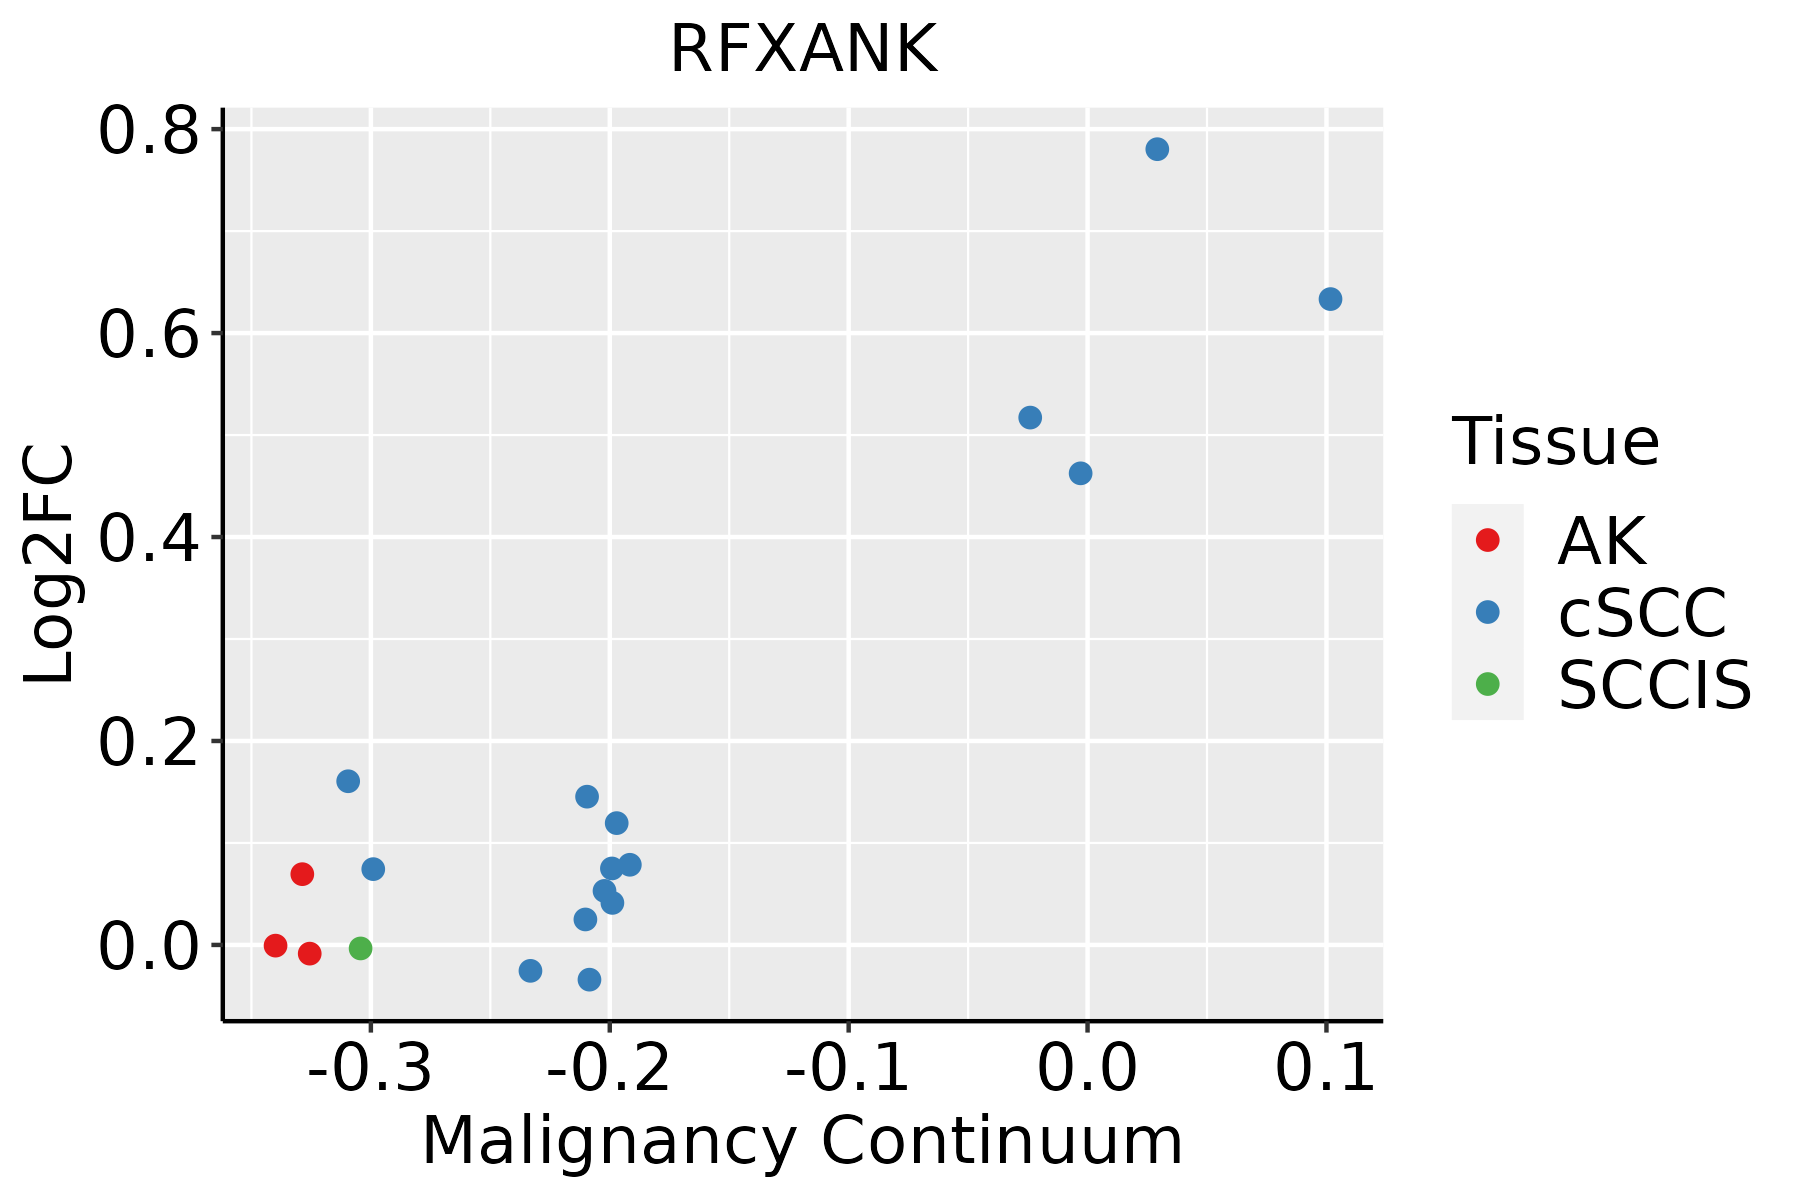 | AK: Actinic keratosis |
| cSCC: Cutaneous squamous cell carcinoma | ||
| SCCIS:squamous cell carcinoma in situ | ||
| Thyroid | 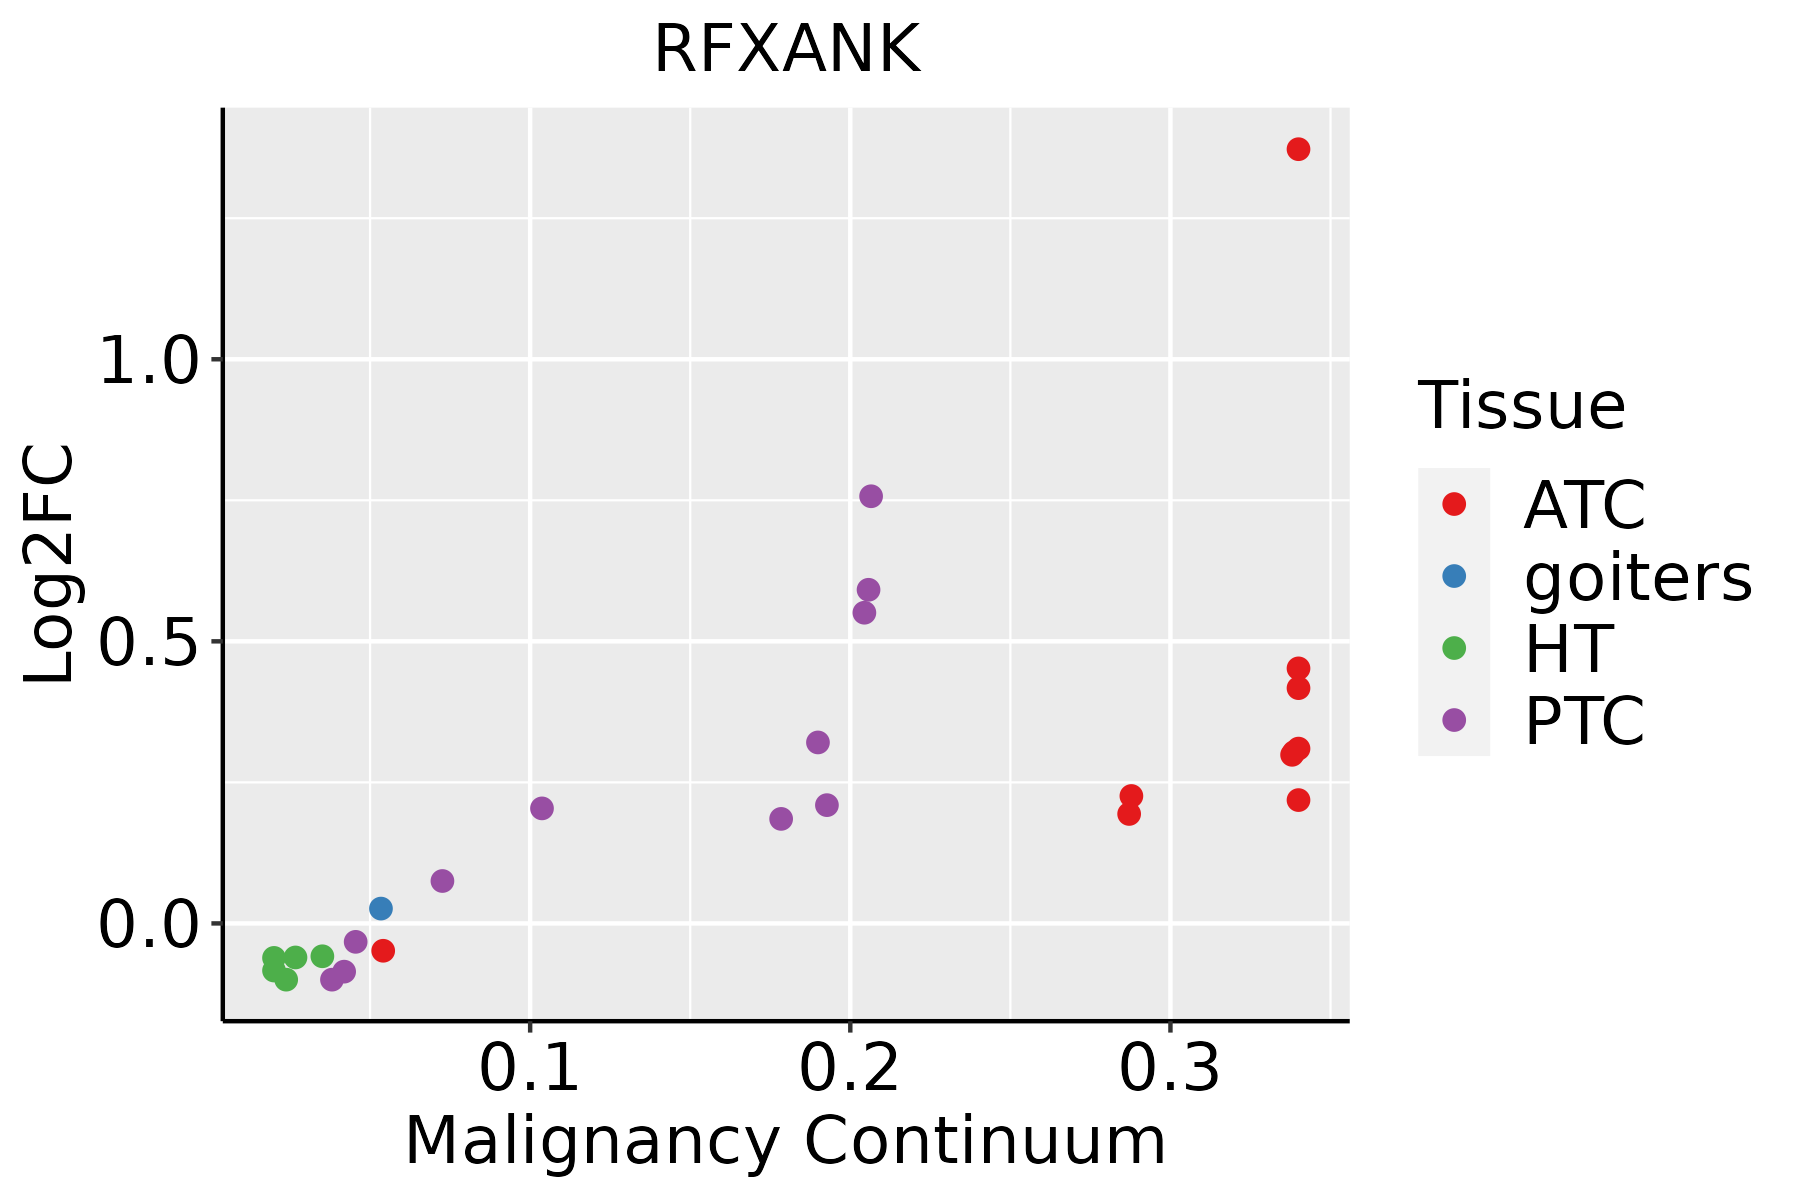 | ATC: Anaplastic thyroid cancer |
| HT: Hashimoto's thyroiditis | ||
| PTC: Papillary thyroid cancer |
| ∗log2FC in expression of this searched gene in stem-like cells from each diseased tissue sample relative to stem-like cells in normal samples in each tissue plotted against the malignancy continuum. Samples are colored based on if they are from different disease stage. |
Top |
Malignant transformation related pathway analysis |
| Find out the enriched GO biological processes and KEGG pathways involved in transition from healthy to precancer to cancer |
| Tissue | Disease Stage | Enriched GO biological Processes |
| Colorectum | AD |  |
| Colorectum | SER |  |
| Colorectum | MSS |  |
| Colorectum | MSI-H |  |
| Colorectum | FAP |  |
| ∗Top 15 enriched GO BP terms are showed in the bar plot of each disease state in each tissue. Each row represents a significant GO biological process which is colored according to the -log10(p.adjust). |
| Page: 1 2 3 4 5 6 7 8 9 |
| GO ID | Tissue | Disease Stage | Description | Gene Ratio | Bg Ratio | pvalue | p.adjust | Count |
| GO:000726510 | Esophagus | ESCC | Ras protein signal transduction | 201/8552 | 337/18723 | 1.44e-07 | 2.30e-06 | 201 |
| GO:000726511 | Liver | Cirrhotic | Ras protein signal transduction | 119/4634 | 337/18723 | 8.16e-06 | 1.22e-04 | 119 |
| GO:000726521 | Liver | HCC | Ras protein signal transduction | 187/7958 | 337/18723 | 8.89e-07 | 1.35e-05 | 187 |
| GO:00072659 | Oral cavity | OSCC | Ras protein signal transduction | 185/7305 | 337/18723 | 1.95e-09 | 4.60e-08 | 185 |
| GO:000726515 | Oral cavity | LP | Ras protein signal transduction | 109/4623 | 337/18723 | 8.44e-04 | 7.36e-03 | 109 |
| GO:000726523 | Skin | cSCC | Ras protein signal transduction | 132/4864 | 337/18723 | 6.17e-08 | 1.57e-06 | 132 |
| GO:000726519 | Thyroid | PTC | Ras protein signal transduction | 162/5968 | 337/18723 | 3.16e-10 | 1.02e-08 | 162 |
| GO:000726524 | Thyroid | ATC | Ras protein signal transduction | 172/6293 | 337/18723 | 2.25e-11 | 7.96e-10 | 172 |
| Page: 1 |
| Pathway ID | Tissue | Disease Stage | Description | Gene Ratio | Bg Ratio | pvalue | p.adjust | qvalue | Count |
| hsa051527 | Esophagus | ESCC | Tuberculosis | 111/4205 | 180/8465 | 7.14e-04 | 2.32e-03 | 1.19e-03 | 111 |
| hsa0461230 | Esophagus | ESCC | Antigen processing and presentation | 51/4205 | 78/8465 | 3.57e-03 | 9.34e-03 | 4.78e-03 | 51 |
| hsa0515212 | Esophagus | ESCC | Tuberculosis | 111/4205 | 180/8465 | 7.14e-04 | 2.32e-03 | 1.19e-03 | 111 |
| hsa04612114 | Esophagus | ESCC | Antigen processing and presentation | 51/4205 | 78/8465 | 3.57e-03 | 9.34e-03 | 4.78e-03 | 51 |
| hsa0461214 | Liver | Cirrhotic | Antigen processing and presentation | 36/2530 | 78/8465 | 1.69e-03 | 8.01e-03 | 4.94e-03 | 36 |
| hsa0461215 | Liver | Cirrhotic | Antigen processing and presentation | 36/2530 | 78/8465 | 1.69e-03 | 8.01e-03 | 4.94e-03 | 36 |
| hsa051526 | Oral cavity | OSCC | Tuberculosis | 105/3704 | 180/8465 | 5.00e-05 | 2.04e-04 | 1.04e-04 | 105 |
| hsa0461229 | Oral cavity | OSCC | Antigen processing and presentation | 47/3704 | 78/8465 | 2.37e-03 | 6.35e-03 | 3.23e-03 | 47 |
| hsa0515211 | Oral cavity | OSCC | Tuberculosis | 105/3704 | 180/8465 | 5.00e-05 | 2.04e-04 | 1.04e-04 | 105 |
| hsa04612113 | Oral cavity | OSCC | Antigen processing and presentation | 47/3704 | 78/8465 | 2.37e-03 | 6.35e-03 | 3.23e-03 | 47 |
| hsa04612210 | Oral cavity | LP | Antigen processing and presentation | 37/2418 | 78/8465 | 2.98e-04 | 1.60e-03 | 1.03e-03 | 37 |
| hsa0515221 | Oral cavity | LP | Tuberculosis | 65/2418 | 180/8465 | 1.60e-02 | 4.92e-02 | 3.17e-02 | 65 |
| hsa0461237 | Oral cavity | LP | Antigen processing and presentation | 37/2418 | 78/8465 | 2.98e-04 | 1.60e-03 | 1.03e-03 | 37 |
| hsa0515231 | Oral cavity | LP | Tuberculosis | 65/2418 | 180/8465 | 1.60e-02 | 4.92e-02 | 3.17e-02 | 65 |
| Page: 1 |
Top |
Cell-cell communication analysis |
| Identification of potential cell-cell interactions between two cell types and their ligand-receptor pairs for different disease states |
| Ligand | Receptor | LRpair | Pathway | Tissue | Disease Stage |
| Page: 1 |
Top |
Single-cell gene regulatory network inference analysis |
| Find out the significant the regulons (TFs) and the target genes of each regulon across cell types for different disease states |
| TF | Cell Type | Tissue | Disease Stage | Target Gene | RSS | Regulon Activity |
| RFXANK | CD8TEREX | Breast | ADJ | USP28,ITGA2,SNIP1, etc. | 1.84e-02 |  |
| RFXANK | BMEM | Breast | DCIS | USP28,ITGA2,SNIP1, etc. | 8.80e-02 |  |
| RFXANK | CD8TEFF | Cervix | ADJ | S100B,LTF,ERCC1, etc. | 1.87e-02 |  |
| RFXANK | CD8TEXINT | Cervix | CC | S100B,LTF,ERCC1, etc. | 1.72e-01 |  |
| RFXANK | CD8TEXP | Cervix | CC | S100B,LTF,ERCC1, etc. | 4.13e-02 | |
| RFXANK | CD8TEXINT | Cervix | HSIL_HPV | S100B,LTF,ERCC1, etc. | 9.89e-02 |  |
| RFXANK | CILIA | Endometrium | AEH | DNAJC3-DT,C10orf95,LINC01560, etc. | 2.39e-01 |  |
| RFXANK | PRO | Esophagus | Healthy | C10orf10,THRAP3,CNFN, etc. | 1.57e-01 |  |
| RFXANK | BAS | Lung | Healthy | C16orf89,MSMB,FGFBP1, etc. | 9.71e-02 |  |
| RFXANK | PLA | Pancreas | ADJ | SLC35E2B,CCND1,ACP5, etc. | 2.59e-02 |  |
| ∗The dot plots of a searched regulon are shown for all cell subpopulations in each disease state of each tissue based on the regulon specific score inferred using pySCENIC and by calculating the average expression. |
| Page: 1 2 |
Top |
Somatic mutation of malignant transformation related genes |
| Annotation of somatic variants for genes involved in malignant transformation |
| Hugo Symbol | Variant Class | Variant Classification | dbSNP RS | HGVSc | HGVSp | HGVSp Short | SWISSPROT | BIOTYPE | SIFT | PolyPhen | Tumor Sample Barcode | Tissue | Histology | Sex | Age | Stage | Therapy Types | Drugs | Outcome |
| RFXANK | SNV | Missense_Mutation | c.97N>C | p.Asp33His | p.D33H | O14593 | protein_coding | deleterious_low_confidence(0) | possibly_damaging(0.883) | TCGA-C8-A274-01 | Breast | breast invasive carcinoma | Female | <65 | I/II | Hormone Therapy | tamoxiphen | SD | |
| RFXANK | SNV | Missense_Mutation | novel | c.240N>A | p.Asn80Lys | p.N80K | O14593 | protein_coding | deleterious(0) | probably_damaging(0.995) | TCGA-JL-A3YW-01 | Breast | breast invasive carcinoma | Female | <65 | I/II | Unknown | Unknown | SD |
| RFXANK | insertion | Frame_Shift_Ins | novel | c.555_556insCAACCGGCAGCGAGGGAACGAGG | p.Tyr186GlnfsTer26 | p.Y186Qfs*26 | O14593 | protein_coding | TCGA-BH-A0E2-01 | Breast | breast invasive carcinoma | Female | <65 | III/IV | Chemotherapy | doxorubicin | SD | ||
| RFXANK | SNV | Missense_Mutation | novel | c.575C>T | p.Thr192Met | p.T192M | O14593 | protein_coding | deleterious(0) | probably_damaging(0.998) | TCGA-ZJ-AAXD-01 | Cervix | cervical & endocervical cancer | Female | <65 | III/IV | Unknown | Unknown | SD |
| RFXANK | SNV | Missense_Mutation | rs749859039 | c.595N>T | p.Arg199Cys | p.R199C | O14593 | protein_coding | tolerated(0.11) | probably_damaging(0.997) | TCGA-D5-6530-01 | Colorectum | colon adenocarcinoma | Male | <65 | I/II | Unknown | Unknown | SD |
| RFXANK | insertion | Frame_Shift_Ins | novel | c.446_447insC | p.His151ProfsTer30 | p.H151Pfs*30 | O14593 | protein_coding | TCGA-DM-A1HB-01 | Colorectum | colon adenocarcinoma | Male | >=65 | III/IV | Unknown | Unknown | SD | ||
| RFXANK | SNV | Missense_Mutation | novel | c.517G>A | p.Val173Met | p.V173M | O14593 | protein_coding | deleterious(0) | probably_damaging(0.993) | TCGA-A5-A0G2-01 | Endometrium | uterine corpus endometrioid carcinoma | Female | <65 | III/IV | Unknown | Unknown | SD |
| RFXANK | SNV | Missense_Mutation | c.685N>A | p.Leu229Ile | p.L229I | O14593 | protein_coding | tolerated(0.18) | possibly_damaging(0.738) | TCGA-AP-A059-01 | Endometrium | uterine corpus endometrioid carcinoma | Female | >=65 | I/II | Unknown | Unknown | SD | |
| RFXANK | SNV | Missense_Mutation | c.655G>A | p.Glu219Lys | p.E219K | O14593 | protein_coding | tolerated(0.05) | probably_damaging(0.951) | TCGA-AX-A0J0-01 | Endometrium | uterine corpus endometrioid carcinoma | Female | <65 | I/II | Unknown | Unknown | SD | |
| RFXANK | SNV | Missense_Mutation | c.638N>A | p.Gly213Asp | p.G213D | O14593 | protein_coding | deleterious(0) | probably_damaging(0.998) | TCGA-AX-A0J1-01 | Endometrium | uterine corpus endometrioid carcinoma | Female | >=65 | I/II | Unknown | Unknown | SD |
| Page: 1 2 |
Top |
Related drugs of malignant transformation related genes |
| Identification of chemicals and drugs interact with genes involved in malignant transfromation |
| (DGIdb 4.0) |
| Entrez ID | Symbol | Category | Interaction Types | Drug Claim Name | Drug Name | PMIDs |
| Page: 1 |

Copyright 2023-Present -The University of Texas Health Science Center at Houston |