
|
|||||
|
 | |
| |
| |
| |
| |
| |
|
Gene: RBMS1 |
Gene summary for RBMS1 |
| Gene information | Species | Human | Gene symbol | RBMS1 | Gene ID | 5937 |
| Gene name | RNA binding motif single stranded interacting protein 1 | |
| Gene Alias | C2orf12 | |
| Cytomap | 2q24.2 | |
| Gene Type | protein-coding | GO ID | GO:0006139 | UniProtAcc | A0A0S2Z499 |
Top |
Malignant transformation analysis |
| Identification of the aberrant gene expression in precancerous and cancerous lesions by comparing the gene expression of stem-like cells in diseased tissues with normal stem cells |
| Entrez ID | Symbol | Replicates | Species | Organ | Tissue | Adj P-value | Log2FC | Malignancy |
| 5937 | RBMS1 | P82T-E | Human | Esophagus | ESCC | 1.70e-20 | 9.84e-01 | 0.1072 |
| 5937 | RBMS1 | P83T-E | Human | Esophagus | ESCC | 4.37e-34 | 8.56e-01 | 0.1738 |
| 5937 | RBMS1 | P84T-E | Human | Esophagus | ESCC | 1.66e-04 | 4.54e-01 | 0.0933 |
| 5937 | RBMS1 | P89T-E | Human | Esophagus | ESCC | 6.81e-15 | 1.14e+00 | 0.1752 |
| 5937 | RBMS1 | P91T-E | Human | Esophagus | ESCC | 5.53e-11 | 1.43e+00 | 0.1828 |
| 5937 | RBMS1 | P107T-E | Human | Esophagus | ESCC | 3.15e-26 | 8.15e-01 | 0.171 |
| 5937 | RBMS1 | P126T-E | Human | Esophagus | ESCC | 1.65e-08 | 1.12e+00 | 0.1125 |
| 5937 | RBMS1 | P127T-E | Human | Esophagus | ESCC | 2.29e-31 | 7.49e-01 | 0.0826 |
| 5937 | RBMS1 | P128T-E | Human | Esophagus | ESCC | 1.88e-49 | 2.01e+00 | 0.1241 |
| 5937 | RBMS1 | P130T-E | Human | Esophagus | ESCC | 2.71e-109 | 2.40e+00 | 0.1676 |
| 5937 | RBMS1 | NAFLD1 | Human | Liver | NAFLD | 7.97e-08 | 6.99e-01 | -0.04 |
| 5937 | RBMS1 | S41 | Human | Liver | Cirrhotic | 7.51e-07 | 7.17e-01 | -0.0343 |
| 5937 | RBMS1 | HCC1_Meng | Human | Liver | HCC | 6.79e-29 | -1.89e-02 | 0.0246 |
| 5937 | RBMS1 | HCC2_Meng | Human | Liver | HCC | 8.08e-27 | 2.37e-01 | 0.0107 |
| 5937 | RBMS1 | cirrhotic3 | Human | Liver | Cirrhotic | 4.15e-03 | 1.39e-01 | 0.0215 |
| 5937 | RBMS1 | HCC1 | Human | Liver | HCC | 5.80e-12 | 3.19e+00 | 0.5336 |
| 5937 | RBMS1 | Pt13.b | Human | Liver | HCC | 3.70e-10 | 2.88e-01 | 0.0251 |
| 5937 | RBMS1 | S014 | Human | Liver | HCC | 2.88e-24 | 1.05e+00 | 0.2254 |
| 5937 | RBMS1 | S015 | Human | Liver | HCC | 6.44e-27 | 1.34e+00 | 0.2375 |
| 5937 | RBMS1 | S016 | Human | Liver | HCC | 2.54e-25 | 1.09e+00 | 0.2243 |
| Page: 1 2 3 4 5 6 7 8 |
| Tissue | Expression Dynamics | Abbreviation |
| Cervix | 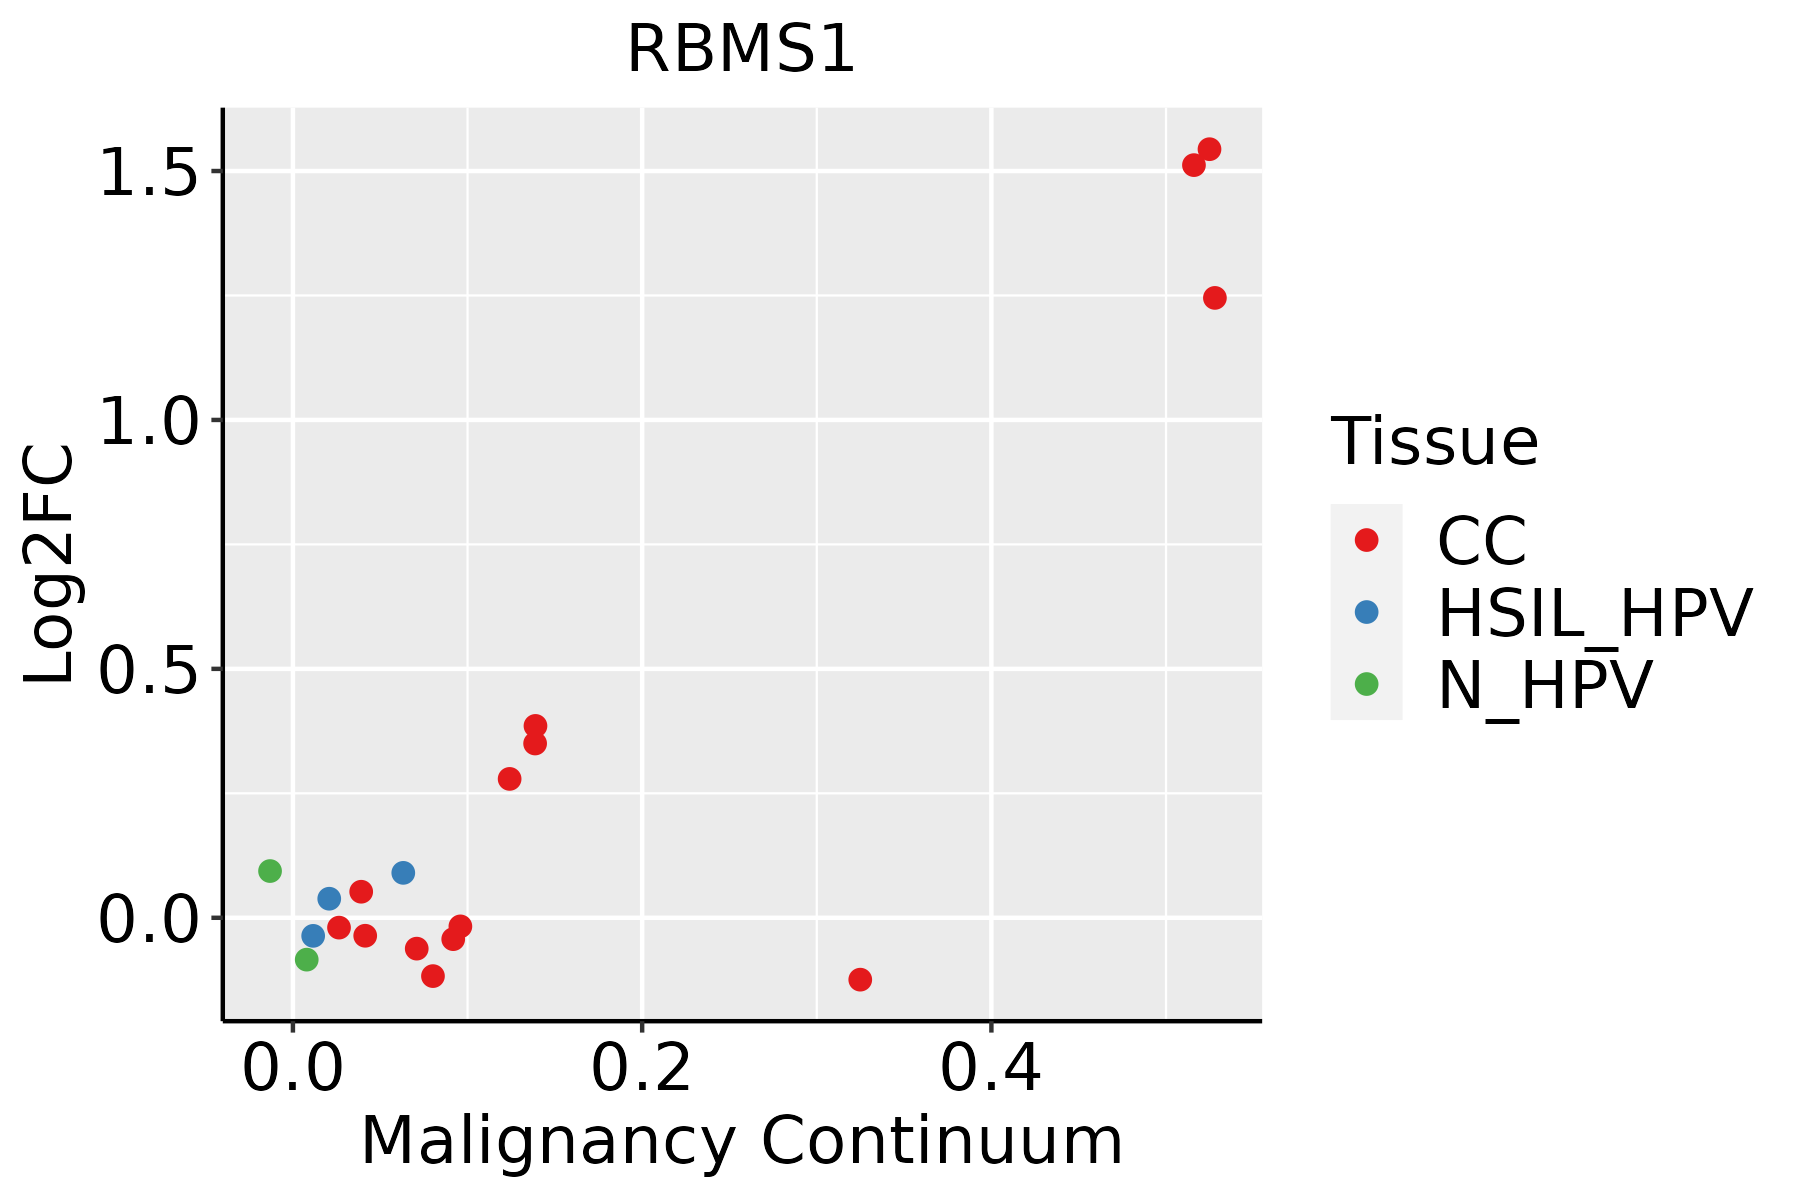 | CC: Cervix cancer |
| HSIL_HPV: HPV-infected high-grade squamous intraepithelial lesions | ||
| N_HPV: HPV-infected normal cervix | ||
| Esophagus | 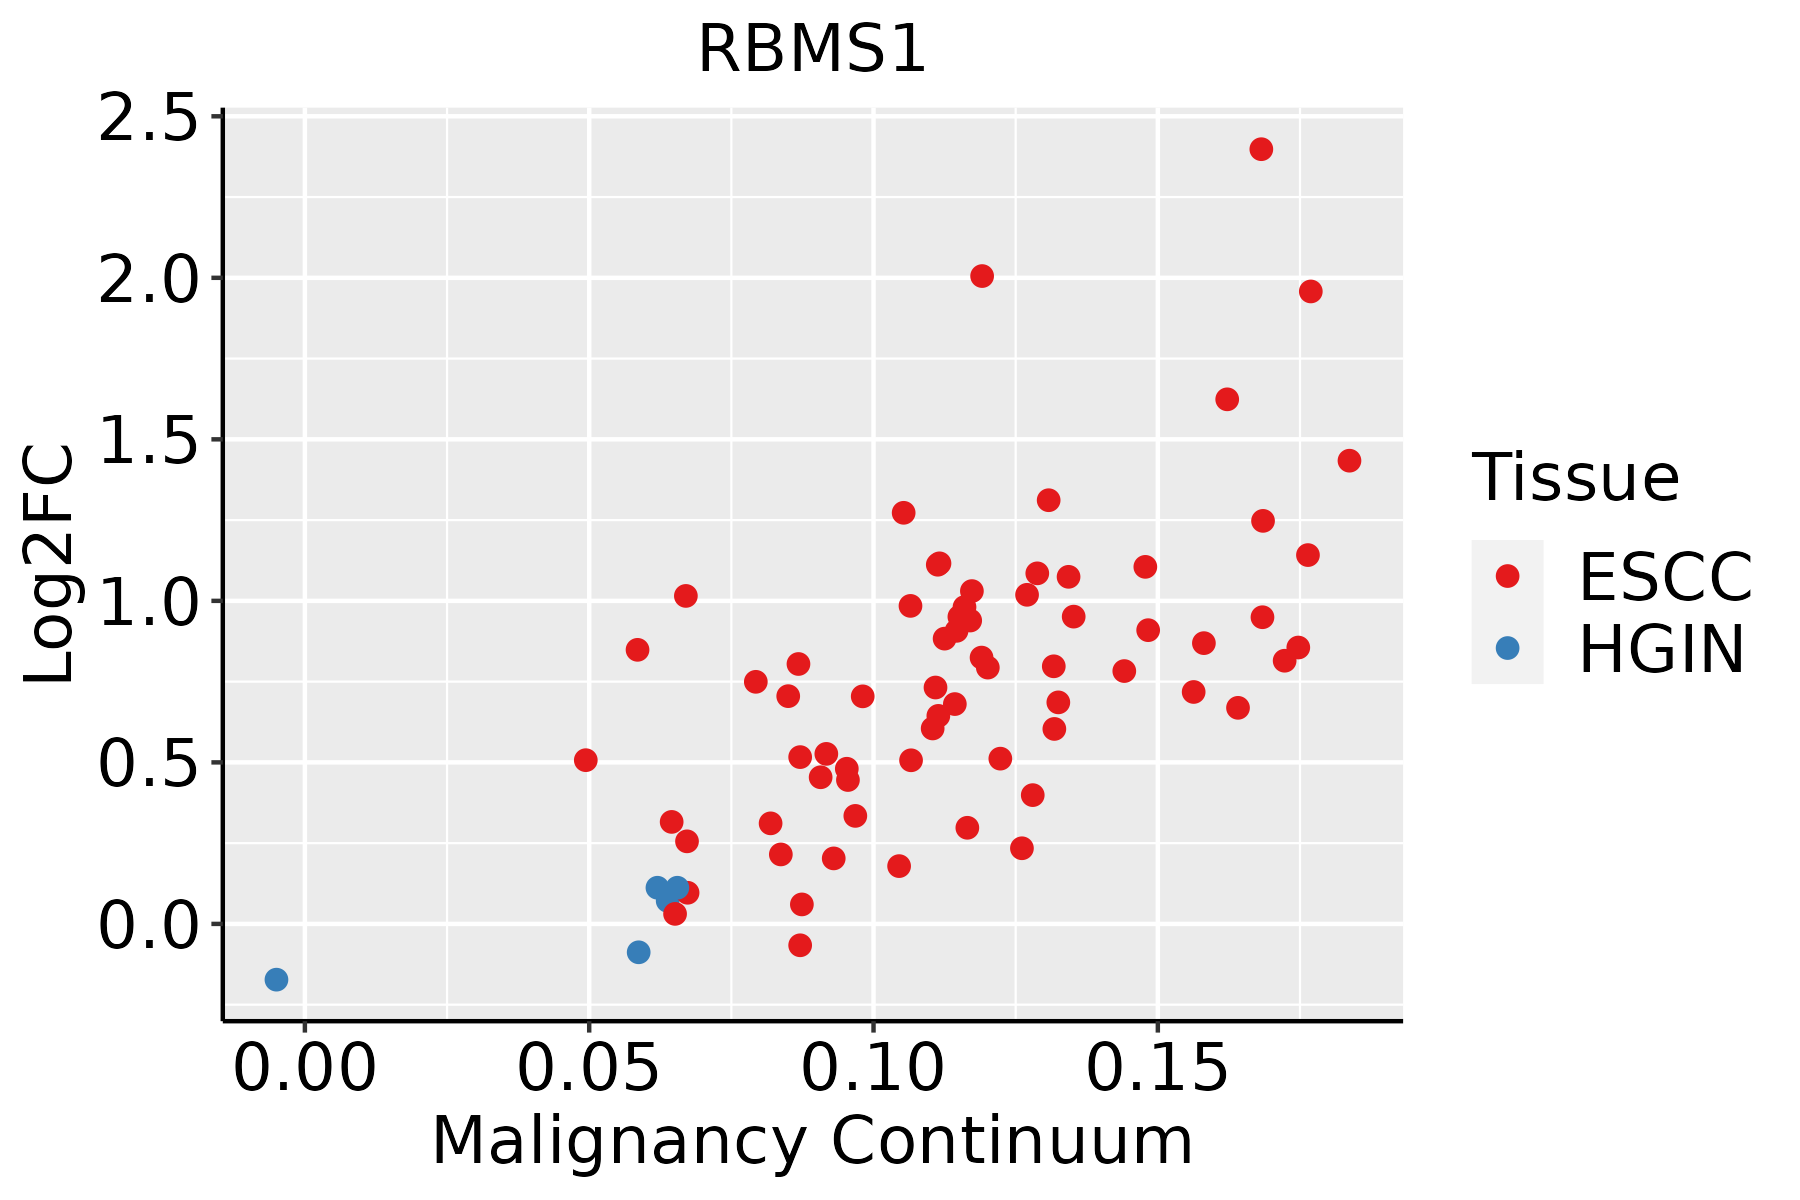 | ESCC: Esophageal squamous cell carcinoma |
| HGIN: High-grade intraepithelial neoplasias | ||
| LGIN: Low-grade intraepithelial neoplasias | ||
| Liver | 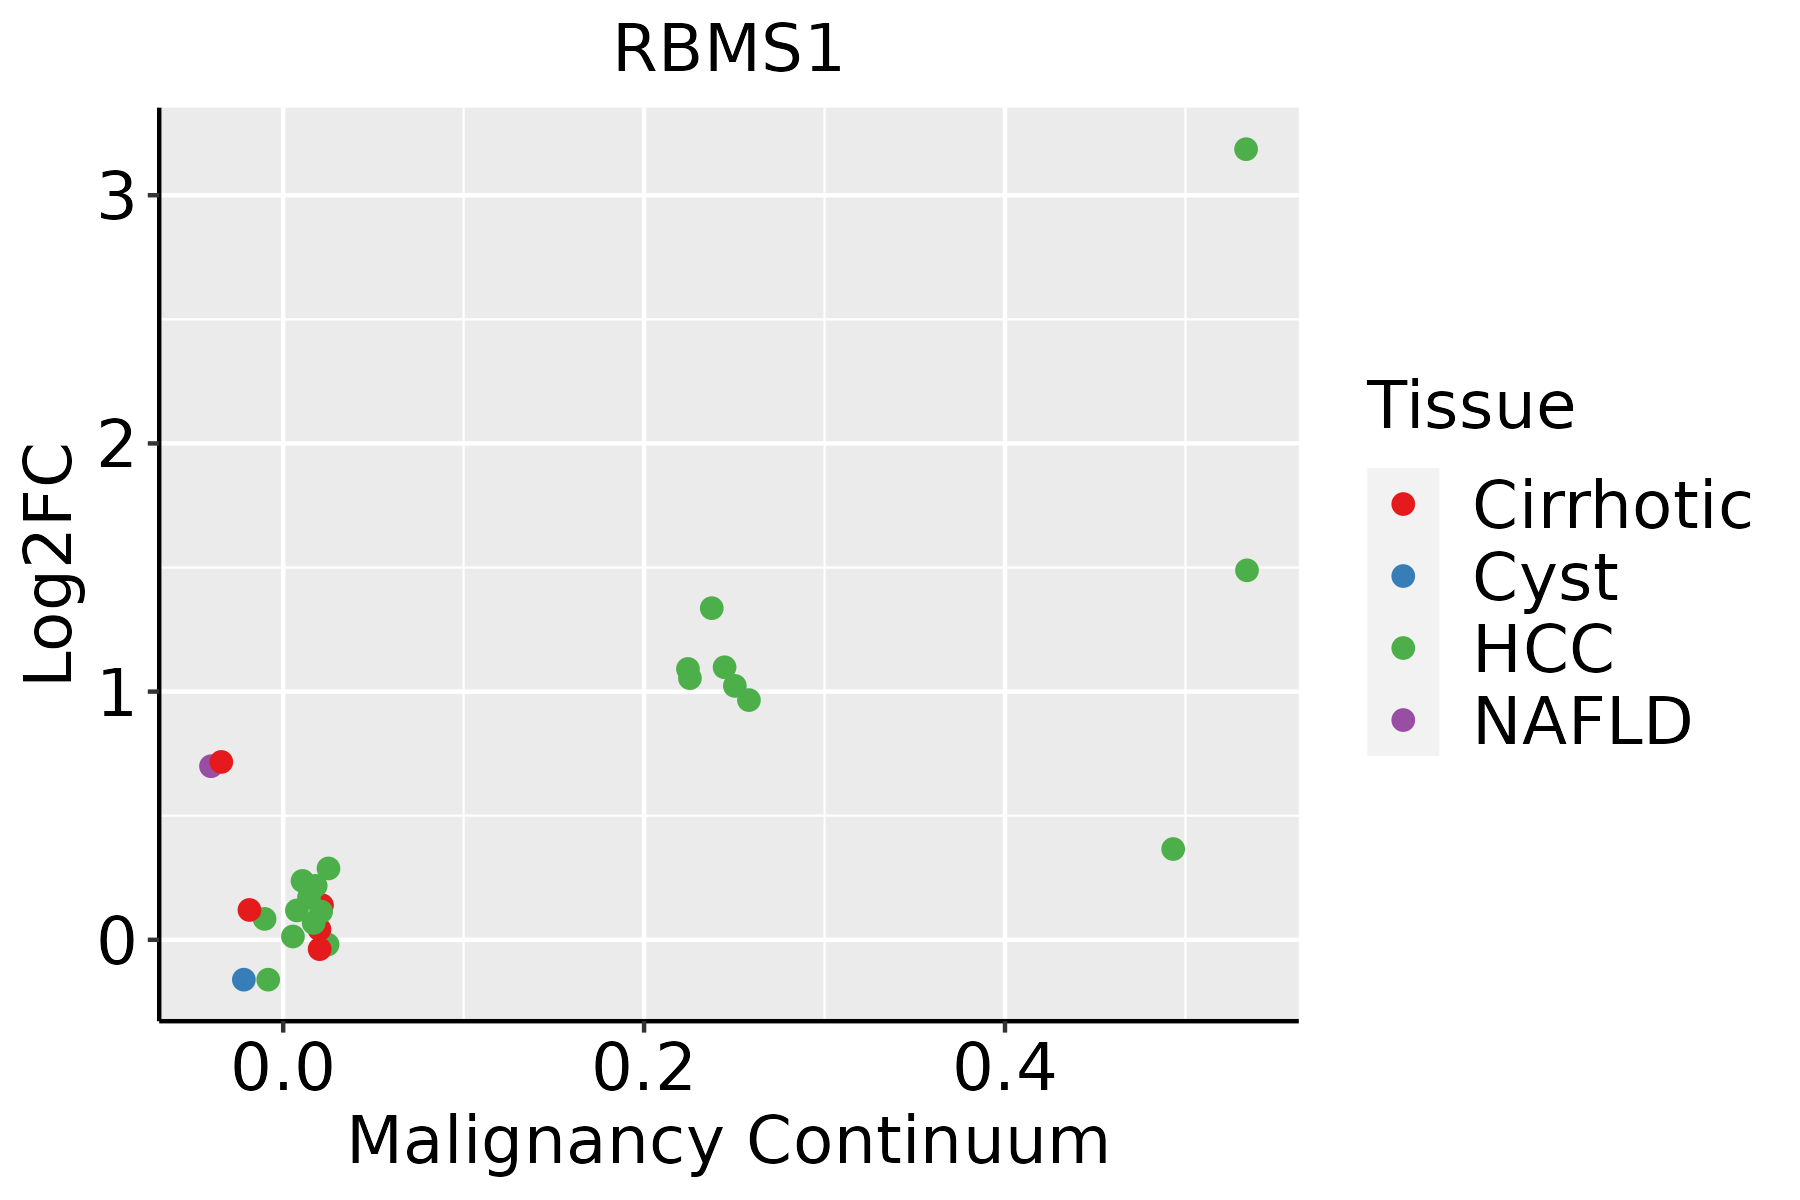 | HCC: Hepatocellular carcinoma |
| NAFLD: Non-alcoholic fatty liver disease | ||
| Lung | 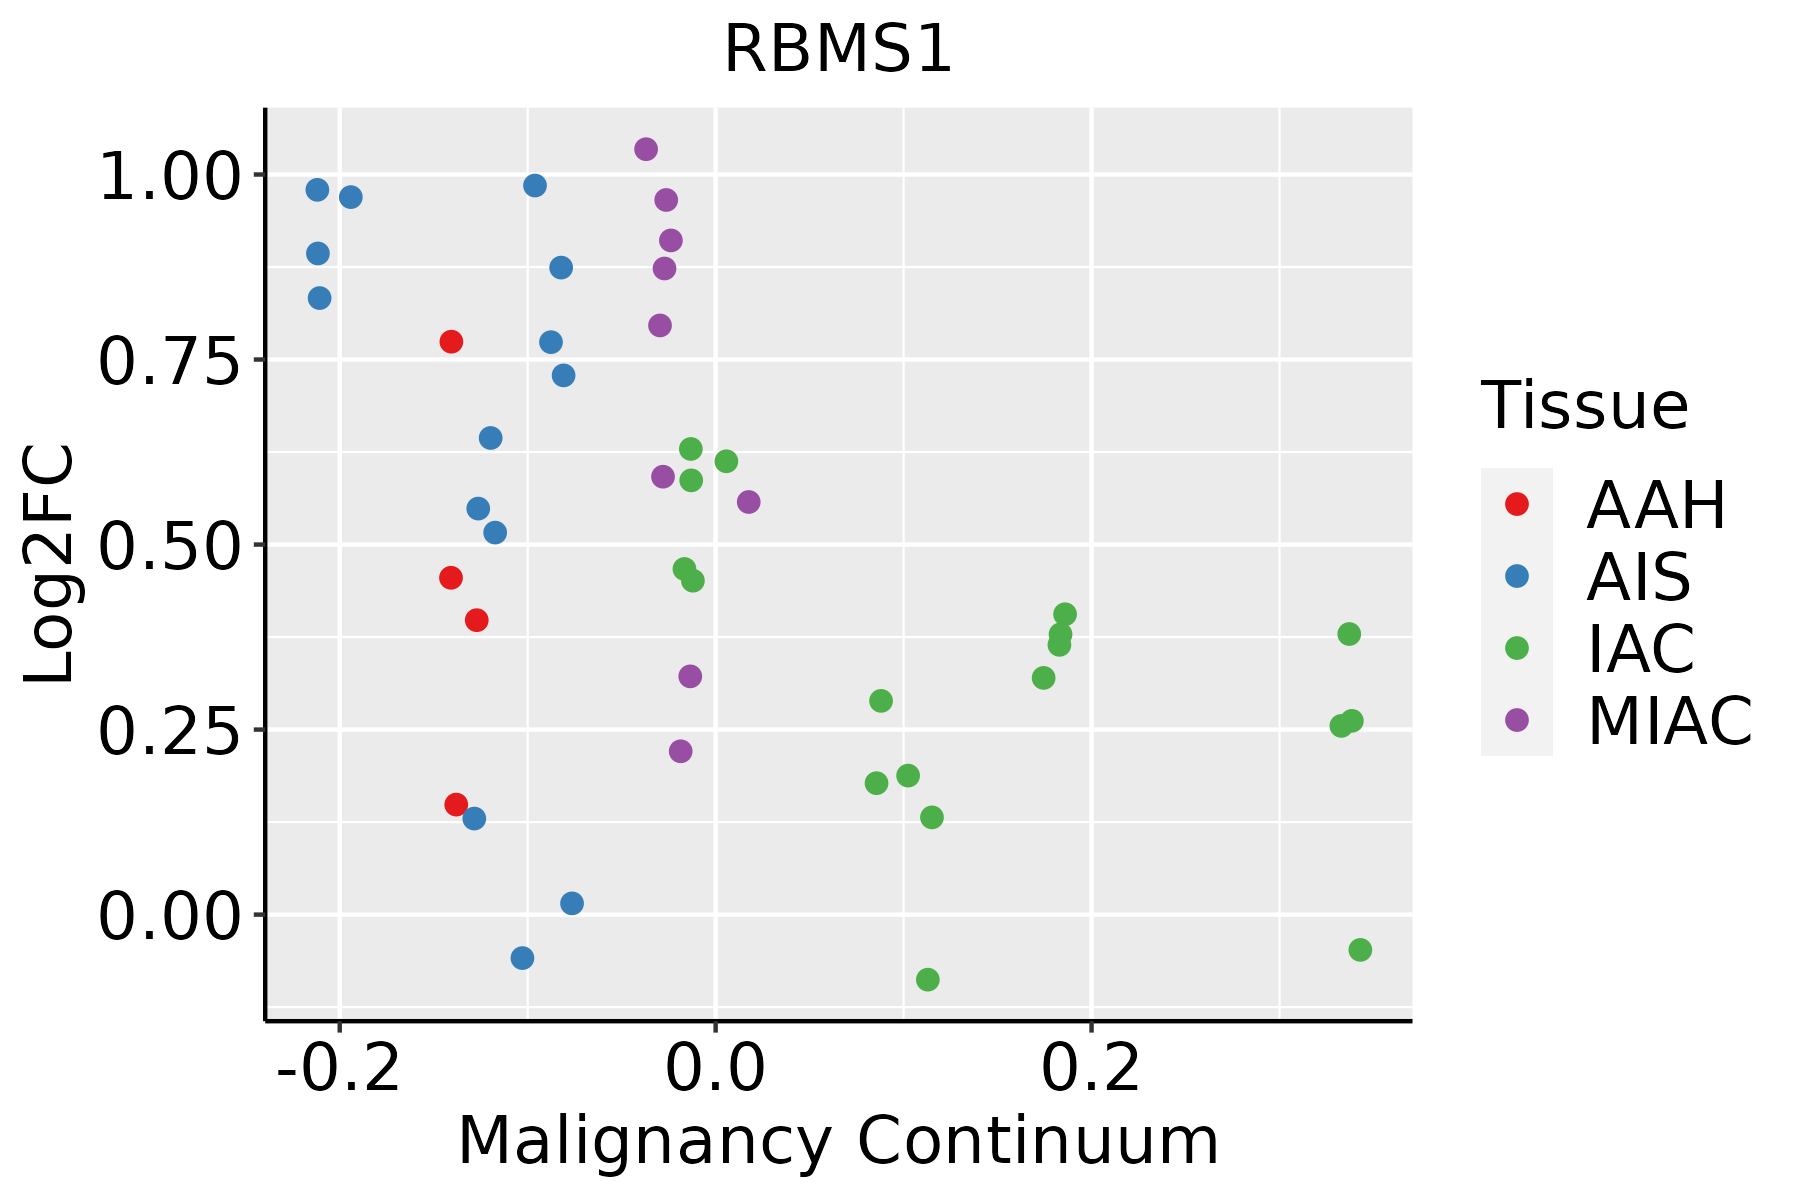 | AAH: Atypical adenomatous hyperplasia |
| AIS: Adenocarcinoma in situ | ||
| IAC: Invasive lung adenocarcinoma | ||
| MIA: Minimally invasive adenocarcinoma | ||
| Oral Cavity | 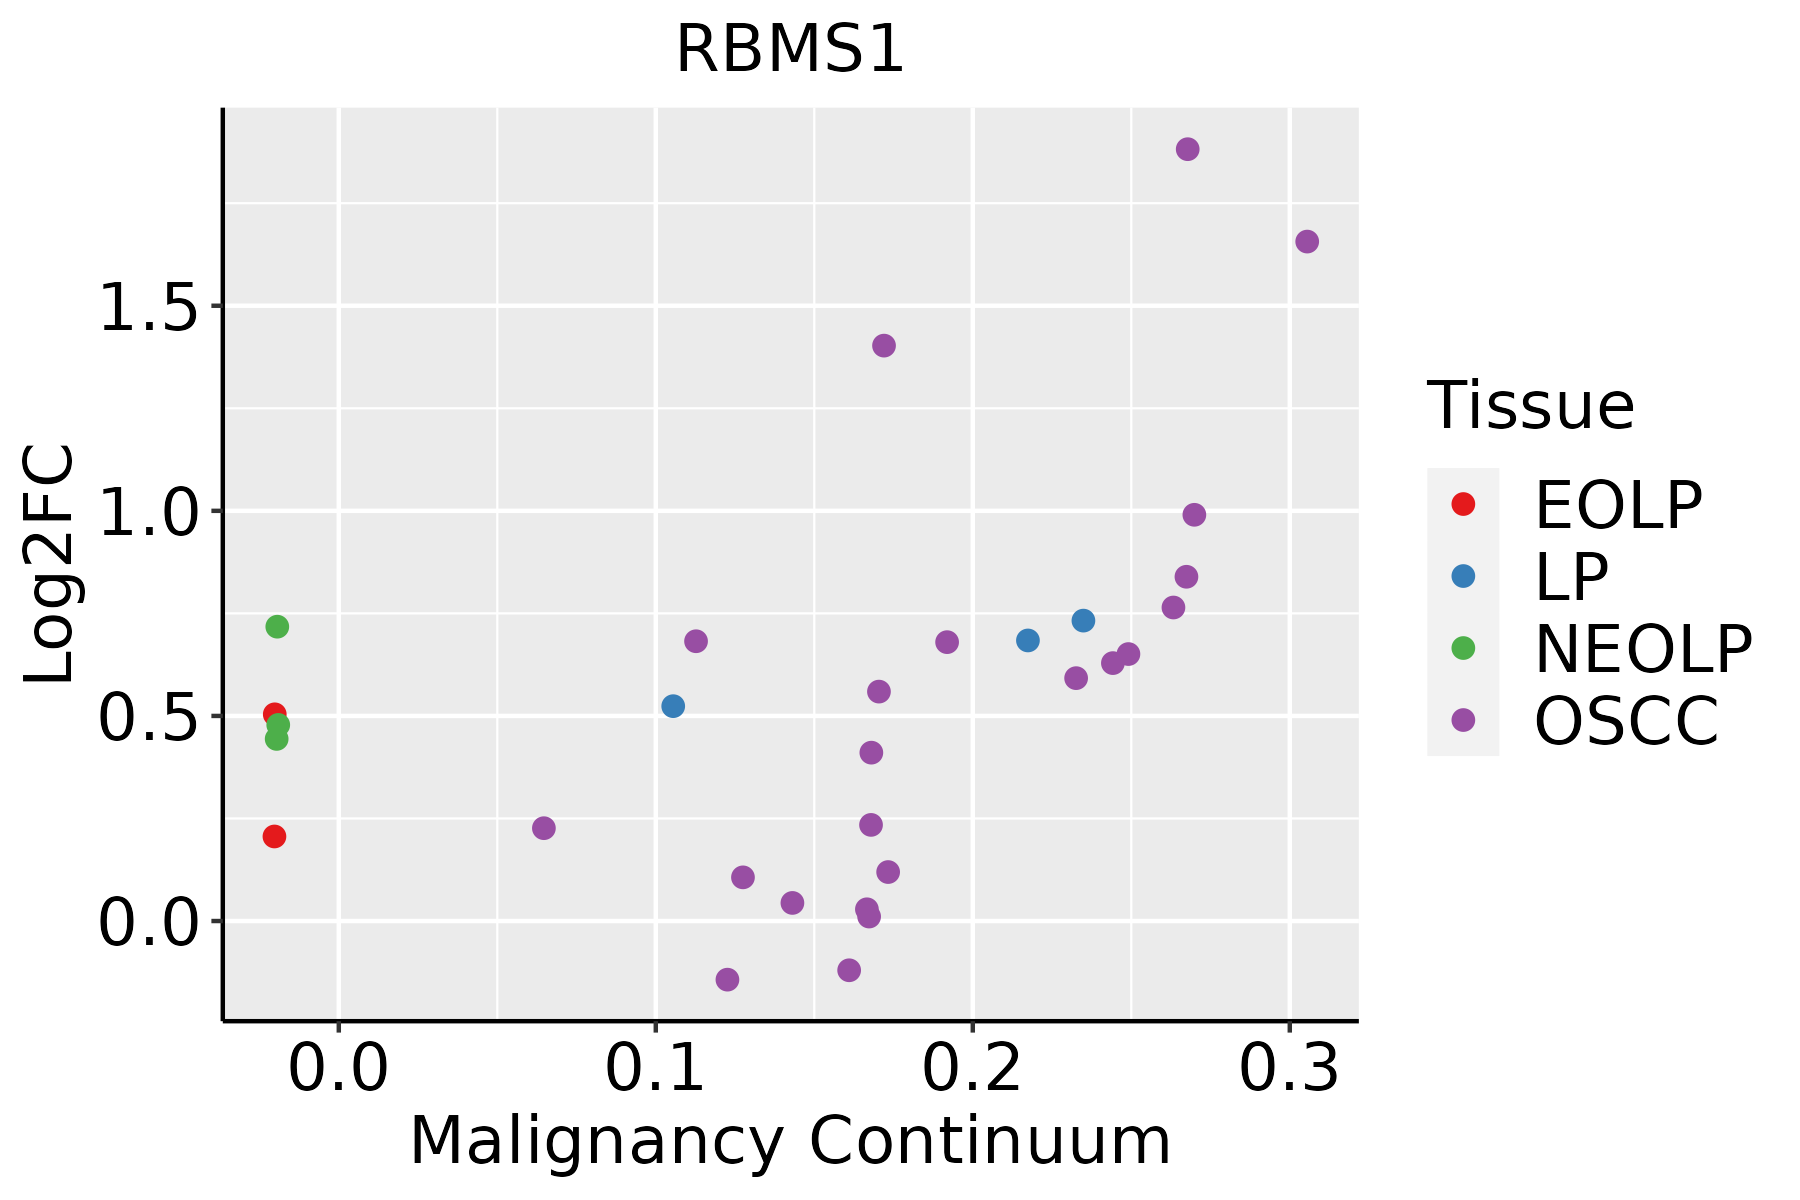 | EOLP: Erosive Oral lichen planus |
| LP: leukoplakia | ||
| NEOLP: Non-erosive oral lichen planus | ||
| OSCC: Oral squamous cell carcinoma | ||
| Prostate | 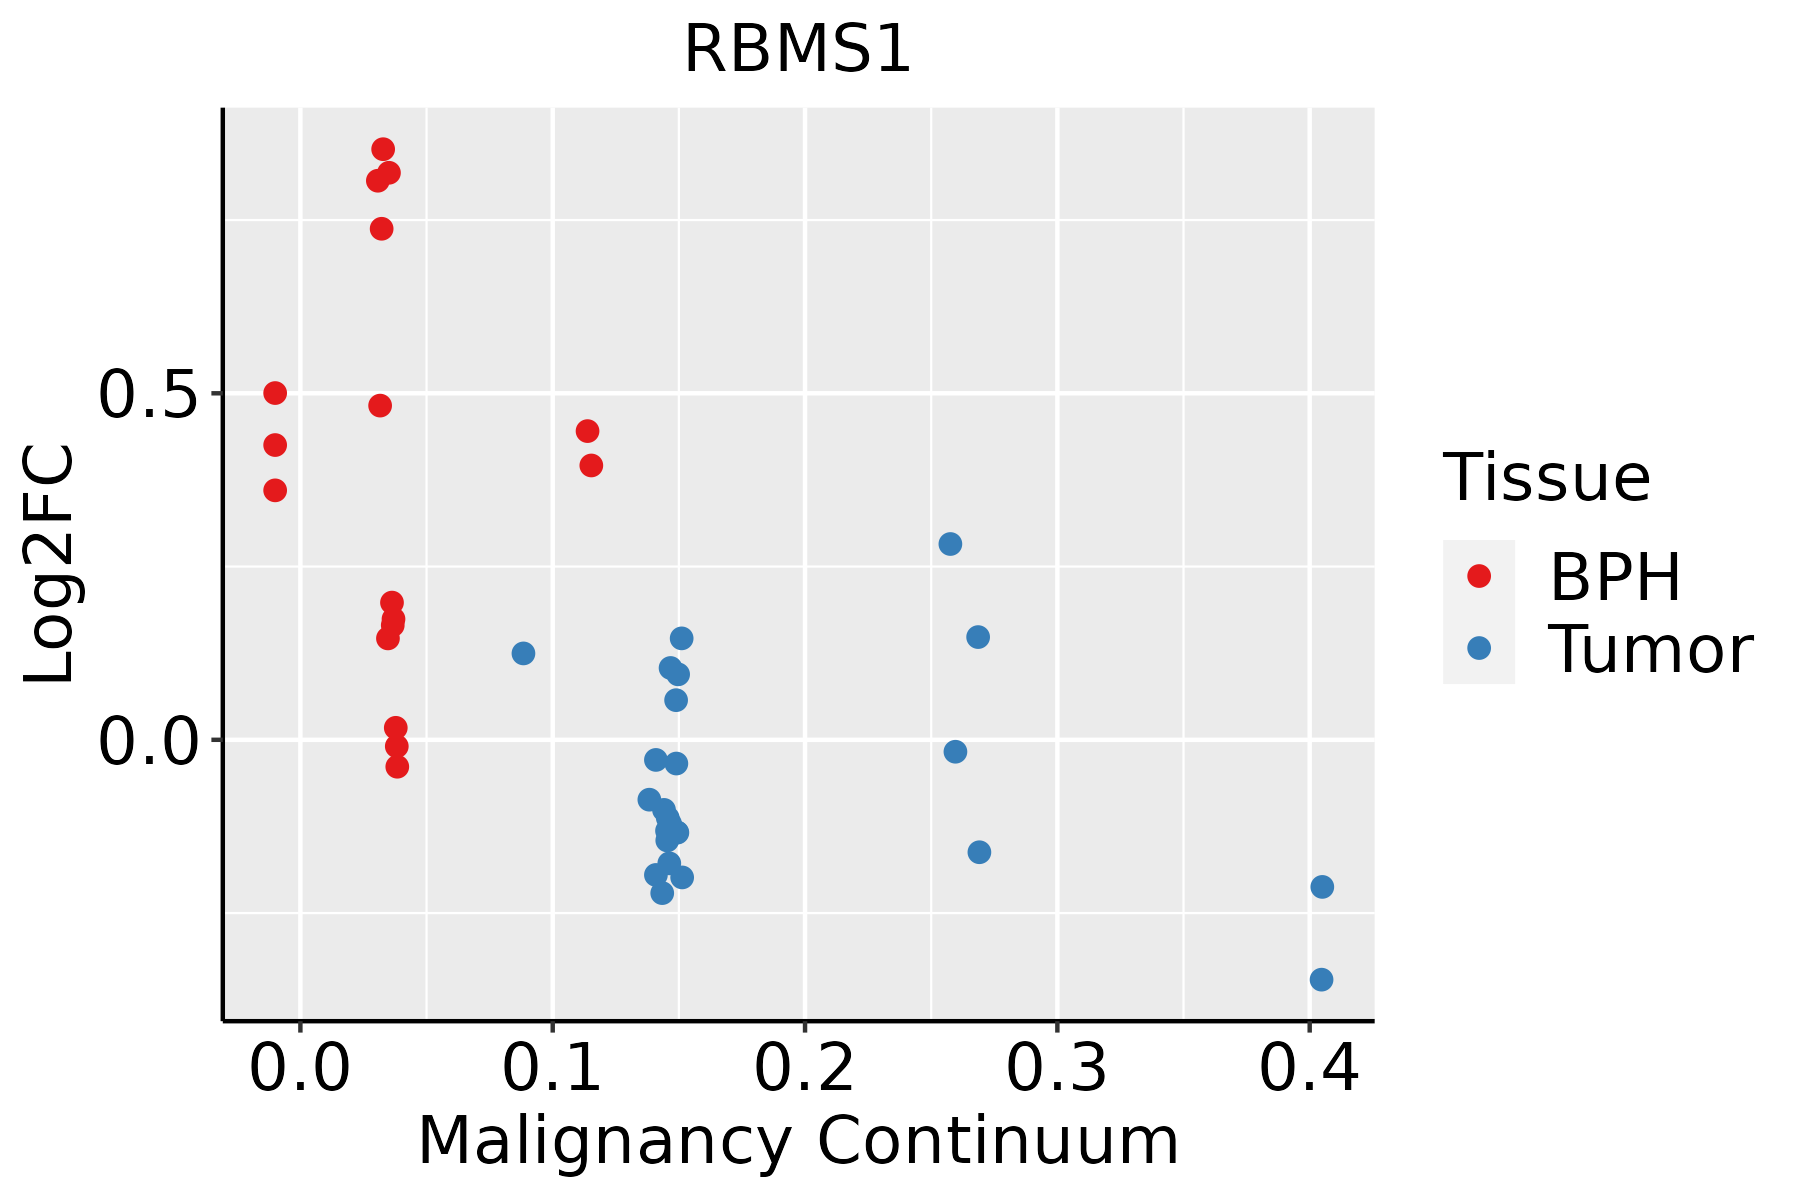 | BPH: Benign Prostatic Hyperplasia |
| Skin | 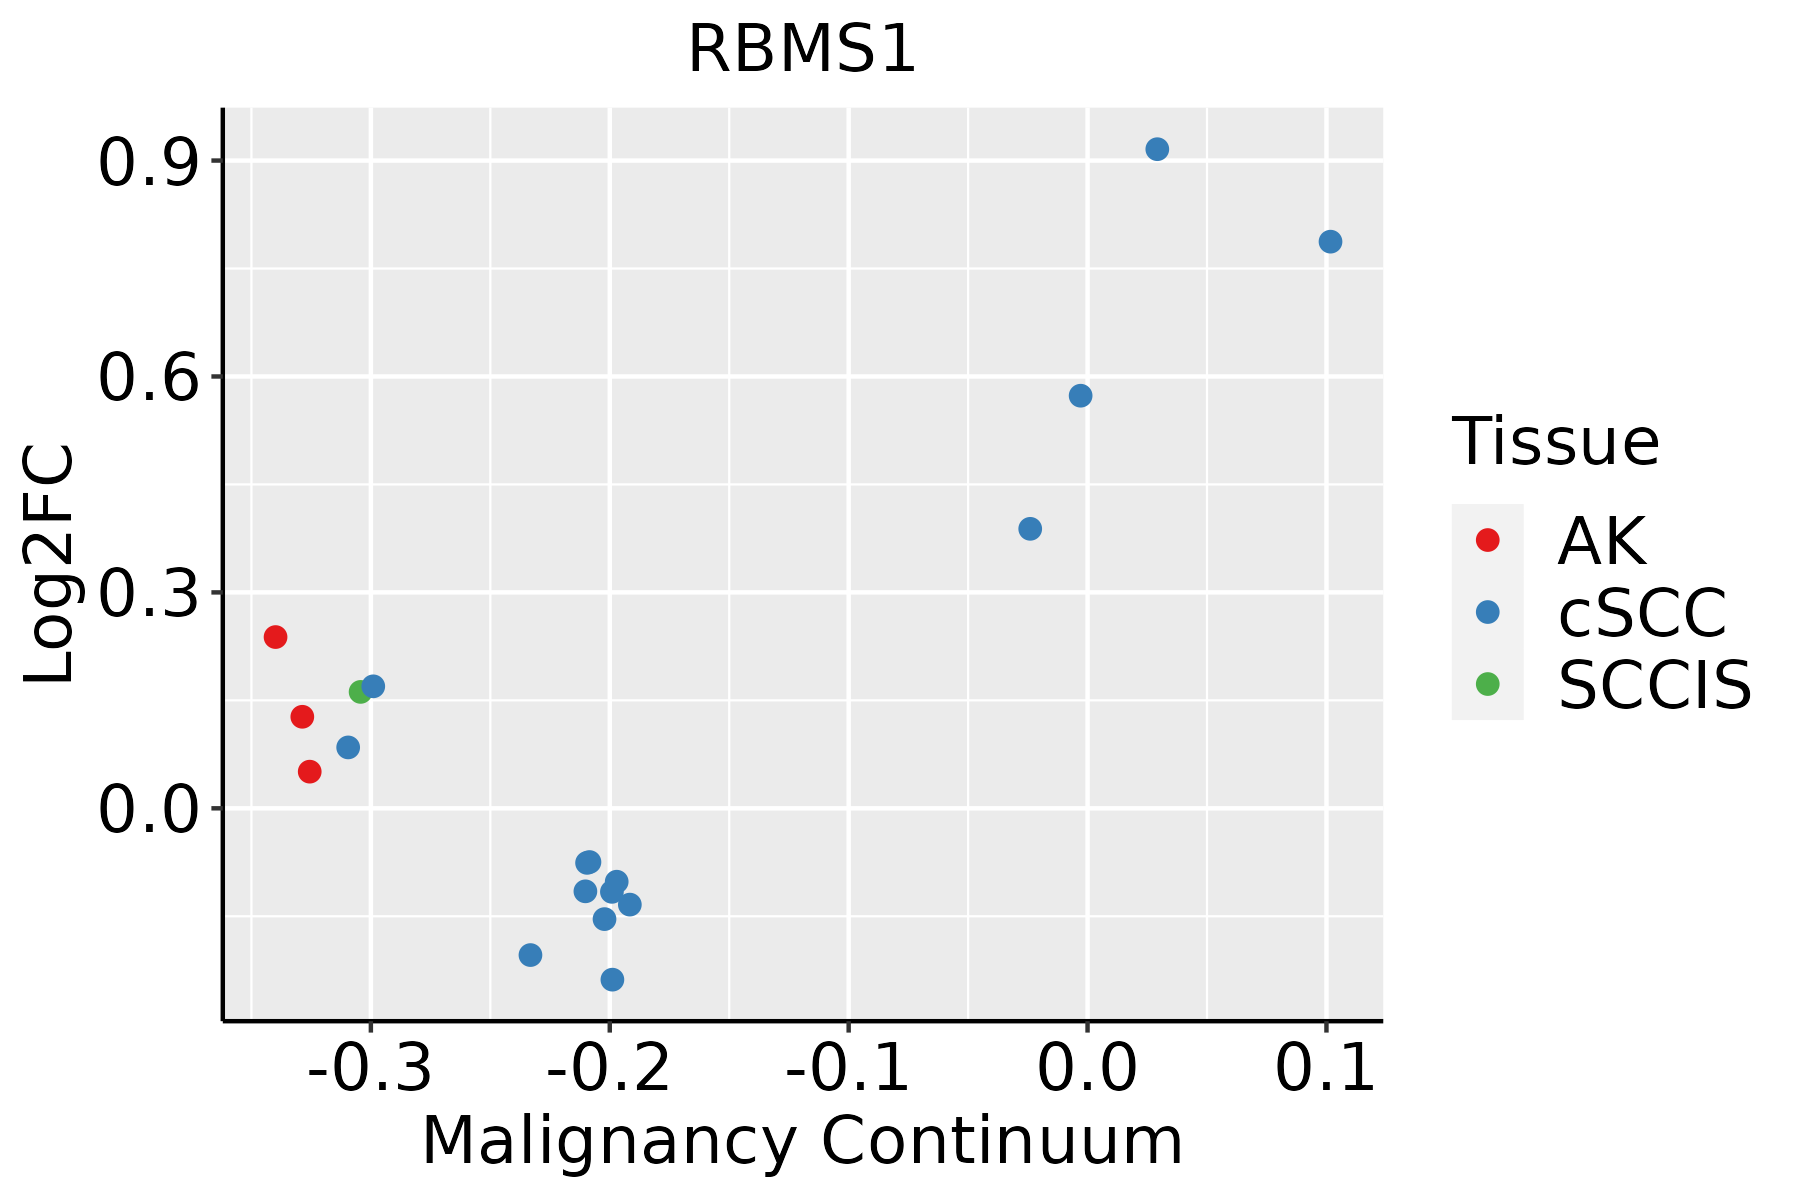 | AK: Actinic keratosis |
| cSCC: Cutaneous squamous cell carcinoma | ||
| SCCIS:squamous cell carcinoma in situ | ||
| Thyroid |  | ATC: Anaplastic thyroid cancer |
| HT: Hashimoto's thyroiditis | ||
| PTC: Papillary thyroid cancer |
| ∗log2FC in expression of this searched gene in stem-like cells from each diseased tissue sample relative to stem-like cells in normal samples in each tissue plotted against the malignancy continuum. Samples are colored based on if they are from different disease stage. |
Top |
Malignant transformation related pathway analysis |
| Find out the enriched GO biological processes and KEGG pathways involved in transition from healthy to precancer to cancer |
| Tissue | Disease Stage | Enriched GO biological Processes |
| Colorectum | AD |  |
| Colorectum | SER |  |
| Colorectum | MSS |  |
| Colorectum | MSI-H |  |
| Colorectum | FAP |  |
| ∗Top 15 enriched GO BP terms are showed in the bar plot of each disease state in each tissue. Each row represents a significant GO biological process which is colored according to the -log10(p.adjust). |
| Page: 1 2 3 4 5 6 7 8 9 |
| GO ID | Tissue | Disease Stage | Description | Gene Ratio | Bg Ratio | pvalue | p.adjust | Count |
| GO:00062602 | Cervix | CC | DNA replication | 48/2311 | 260/18723 | 2.70e-03 | 1.85e-02 | 48 |
| GO:00062604 | Esophagus | ESCC | DNA replication | 181/8552 | 260/18723 | 3.55e-15 | 2.05e-13 | 181 |
| GO:00062601 | Liver | HCC | DNA replication | 146/7958 | 260/18723 | 5.68e-06 | 7.02e-05 | 146 |
| GO:00062603 | Oral cavity | OSCC | DNA replication | 159/7305 | 260/18723 | 3.25e-13 | 1.59e-11 | 159 |
| GO:000626011 | Oral cavity | LP | DNA replication | 97/4623 | 260/18723 | 3.67e-06 | 7.75e-05 | 97 |
| GO:000626012 | Skin | cSCC | DNA replication | 106/4864 | 260/18723 | 1.18e-07 | 2.77e-06 | 106 |
| GO:00062606 | Thyroid | PTC | DNA replication | 114/5968 | 260/18723 | 3.09e-05 | 2.95e-04 | 114 |
| GO:000626013 | Thyroid | ATC | DNA replication | 124/6293 | 260/18723 | 1.58e-06 | 1.93e-05 | 124 |
| Page: 1 |
| Pathway ID | Tissue | Disease Stage | Description | Gene Ratio | Bg Ratio | pvalue | p.adjust | qvalue | Count |
| Page: 1 |
Top |
Cell-cell communication analysis |
| Identification of potential cell-cell interactions between two cell types and their ligand-receptor pairs for different disease states |
| Ligand | Receptor | LRpair | Pathway | Tissue | Disease Stage |
| Page: 1 |
Top |
Single-cell gene regulatory network inference analysis |
| Find out the significant the regulons (TFs) and the target genes of each regulon across cell types for different disease states |
| TF | Cell Type | Tissue | Disease Stage | Target Gene | RSS | Regulon Activity |
| ∗The dot plots of a searched regulon are shown for all cell subpopulations in each disease state of each tissue based on the regulon specific score inferred using pySCENIC and by calculating the average expression. |
| Page: 1 |
Top |
Somatic mutation of malignant transformation related genes |
| Annotation of somatic variants for genes involved in malignant transformation |
| Hugo Symbol | Variant Class | Variant Classification | dbSNP RS | HGVSc | HGVSp | HGVSp Short | SWISSPROT | BIOTYPE | SIFT | PolyPhen | Tumor Sample Barcode | Tissue | Histology | Sex | Age | Stage | Therapy Types | Drugs | Outcome |
| RBMS1 | SNV | Missense_Mutation | c.1032N>C | p.Met344Ile | p.M344I | P29558 | protein_coding | deleterious(0) | benign(0.354) | TCGA-E2-A10C-01 | Breast | breast invasive carcinoma | Female | <65 | I/II | Chemotherapy | cytoxan | SD | |
| RBMS1 | SNV | Missense_Mutation | c.684N>C | p.Gln228His | p.Q228H | P29558 | protein_coding | deleterious(0.03) | benign(0.07) | TCGA-E2-A1LG-01 | Breast | breast invasive carcinoma | Female | <65 | I/II | Chemotherapy | doxorubicin | SD | |
| RBMS1 | SNV | Missense_Mutation | novel | c.842G>C | p.Arg281Pro | p.R281P | P29558 | protein_coding | deleterious(0.03) | benign(0.105) | TCGA-E2-A576-01 | Breast | breast invasive carcinoma | Female | >=65 | I/II | Chemotherapy | taxotere | SD |
| RBMS1 | deletion | Frame_Shift_Del | c.476delN | p.Asn159IlefsTer92 | p.N159Ifs*92 | P29558 | protein_coding | TCGA-A2-A25B-01 | Breast | breast invasive carcinoma | Female | <65 | I/II | Chemotherapy | taxotere | PD | |||
| RBMS1 | SNV | Missense_Mutation | rs765383198 | c.1124C>T | p.Thr375Met | p.T375M | P29558 | protein_coding | deleterious(0.01) | possibly_damaging(0.629) | TCGA-2W-A8YY-01 | Cervix | cervical & endocervical cancer | Female | <65 | I/II | Chemotherapy | cisplatin | CR |
| RBMS1 | SNV | Missense_Mutation | c.739N>C | p.Glu247Gln | p.E247Q | P29558 | protein_coding | deleterious(0.04) | possibly_damaging(0.493) | TCGA-FU-A3YQ-01 | Cervix | cervical & endocervical cancer | Female | <65 | I/II | Unknown | Unknown | SD | |
| RBMS1 | SNV | Missense_Mutation | c.1141N>A | p.Glu381Lys | p.E381K | P29558 | protein_coding | deleterious(0) | benign(0.354) | TCGA-A6-6654-01 | Colorectum | colon adenocarcinoma | Female | >=65 | III/IV | Chemotherapy | oxaliplatin | SD | |
| RBMS1 | SNV | Missense_Mutation | c.794N>T | p.Ala265Val | p.A265V | P29558 | protein_coding | tolerated(0.09) | benign(0.115) | TCGA-AA-3713-01 | Colorectum | colon adenocarcinoma | Male | >=65 | III/IV | Chemotherapy | 5-fluorouracil | PR | |
| RBMS1 | SNV | Missense_Mutation | c.365N>T | p.Ala122Val | p.A122V | P29558 | protein_coding | deleterious(0.04) | benign(0.127) | TCGA-AA-A02R-01 | Colorectum | colon adenocarcinoma | Female | >=65 | I/II | Unknown | Unknown | PD | |
| RBMS1 | SNV | Missense_Mutation | c.668N>C | p.Phe223Ser | p.F223S | P29558 | protein_coding | deleterious(0) | probably_damaging(0.977) | TCGA-AZ-4315-01 | Colorectum | colon adenocarcinoma | Male | <65 | I/II | Unknown | Unknown | SD |
| Page: 1 2 3 4 5 |
Top |
Related drugs of malignant transformation related genes |
| Identification of chemicals and drugs interact with genes involved in malignant transfromation |
| (DGIdb 4.0) |
| Entrez ID | Symbol | Category | Interaction Types | Drug Claim Name | Drug Name | PMIDs |
| Page: 1 |

Copyright 2023-Present -The University of Texas Health Science Center at Houston |