Schematic overview of the cellular and molecular mechanisms involved in the cancer progression, including the proposed cellular and molecular mechanisms in cancer cells trajectory. AT1: alveolar type 1 cells; AT2: alveolar type 2 cells; AAH: atypical adenomatous hyperplasia; AIS: adenocarcinoma in situ; MIA: minimally invasive adenocarcinoma; IA: invasive adenocarcinoma; EMT: epithelial-mesenchymal transition

Home

Download

Statistics

Help

Contact

Center for Computational Systems Medicine
leaf

Gene summary

leaf

Malignant transformation analysis

leaf

Malignant transformation related pathway analysis

leaf

Cell-cell communication analysis

leaf

Single-cell gene regulatory network inference analysis

leaf

Somatic mutation of malignant transformation related genes

leaf

Related drugs of malignant transformation related genes

Gene: RBM19

Gene summary for RBM19

check button Gene summary.

Gene informationSpeciesHuman
Gene symbol

RBM19

Gene ID

9904

Gene nameRNA binding motif protein 19
Gene AliasMrd1
Cytomap12q24.13-q24.21
Gene Typeprotein-coding
GO ID

GO:0000375

UniProtAcc

Q9Y4C8


Top

Malignant transformation analysis

check button Identification of the aberrant gene expression in precancerous and cancerous lesions by comparing the gene expression of stem-like cells in diseased tissues with normal stem cells
check button Malignant transformation involving gene list.
Entrez IDSymbolReplicatesSpeciesOrganTissueAdj P-valueLog2FCMalignancy
9904RBM19P130T-EHumanEsophagusESCC8.95e-224.58e-010.1676
9904RBM19HCC1_MengHumanLiverHCC2.58e-324.51e-020.0246
9904RBM19HCC2_MengHumanLiverHCC2.73e-041.60e-020.0107
9904RBM19HCC1HumanLiverHCC1.18e-073.42e+000.5336
9904RBM19HCC2HumanLiverHCC1.61e-164.74e+000.5341
9904RBM19S014HumanLiverHCC3.70e-095.50e-010.2254
9904RBM19S015HumanLiverHCC1.18e-085.15e-010.2375
9904RBM19S016HumanLiverHCC8.39e-095.20e-010.2243
9904RBM19S027HumanLiverHCC6.41e-034.66e-010.2446
9904RBM19S028HumanLiverHCC5.84e-084.36e-010.2503
9904RBM19S029HumanLiverHCC2.07e-055.00e-010.2581
9904RBM19C04HumanOral cavityOSCC3.30e-044.32e-010.2633
9904RBM19C21HumanOral cavityOSCC8.81e-186.11e-010.2678
9904RBM19C30HumanOral cavityOSCC8.80e-115.79e-010.3055
9904RBM19C38HumanOral cavityOSCC5.95e-057.12e-010.172
9904RBM19C43HumanOral cavityOSCC1.95e-162.77e-010.1704
9904RBM19C46HumanOral cavityOSCC8.77e-103.85e-010.1673
9904RBM19C51HumanOral cavityOSCC9.50e-043.70e-010.2674
9904RBM19C08HumanOral cavityOSCC1.00e-234.24e-010.1919
9904RBM19LN22HumanOral cavityOSCC4.53e-057.62e-010.1733
Page: 1 2 3 4 5 

check button Transcriptomic changes along malignancy continuum.
TissueExpression DynamicsAbbreviation
EsophagusThe image shows the transcriptomic changes along malignancy continuum.log2FC in expression of this searched gene in stem-like cells from each diseased tissue sample relative to stem-like cells in normal samples in each tissue plotted against the malignancy continuum. Samples are colored based on if they are from different disease stage.ESCC: Esophageal squamous cell carcinoma
HGIN: High-grade intraepithelial neoplasias
LGIN: Low-grade intraepithelial neoplasias
LiverThe image shows the transcriptomic changes along malignancy continuum.log2FC in expression of this searched gene in stem-like cells from each diseased tissue sample relative to stem-like cells in normal samples in each tissue plotted against the malignancy continuum. Samples are colored based on if they are from different disease stage.HCC: Hepatocellular carcinoma
NAFLD: Non-alcoholic fatty liver disease
Oral CavityThe image shows the transcriptomic changes along malignancy continuum.log2FC in expression of this searched gene in stem-like cells from each diseased tissue sample relative to stem-like cells in normal samples in each tissue plotted against the malignancy continuum. Samples are colored based on if they are from different disease stage.
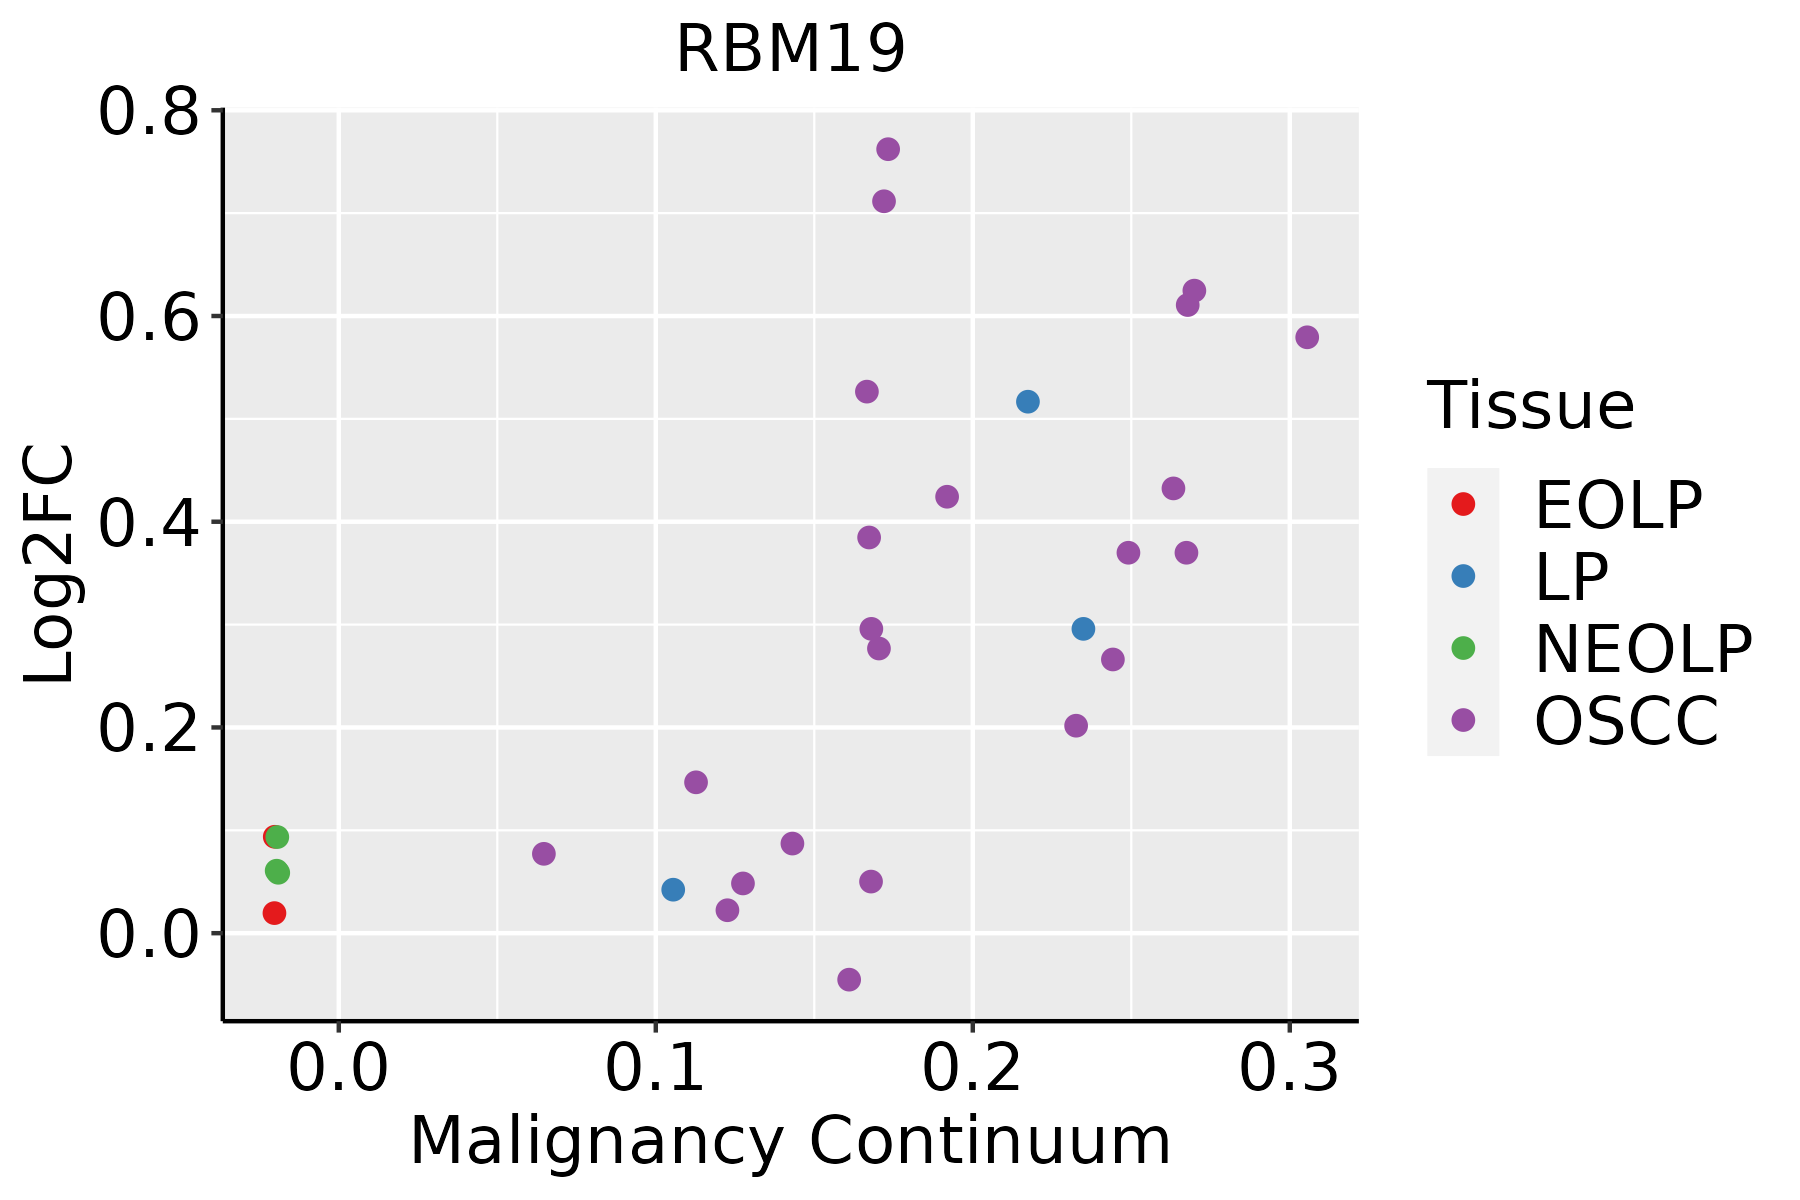
EOLP: Erosive Oral lichen planus
LP: leukoplakia
NEOLP: Non-erosive oral lichen planus
OSCC: Oral squamous cell carcinoma
ThyroidThe image shows the transcriptomic changes along malignancy continuum.log2FC in expression of this searched gene in stem-like cells from each diseased tissue sample relative to stem-like cells in normal samples in each tissue plotted against the malignancy continuum. Samples are colored based on if they are from different disease stage.
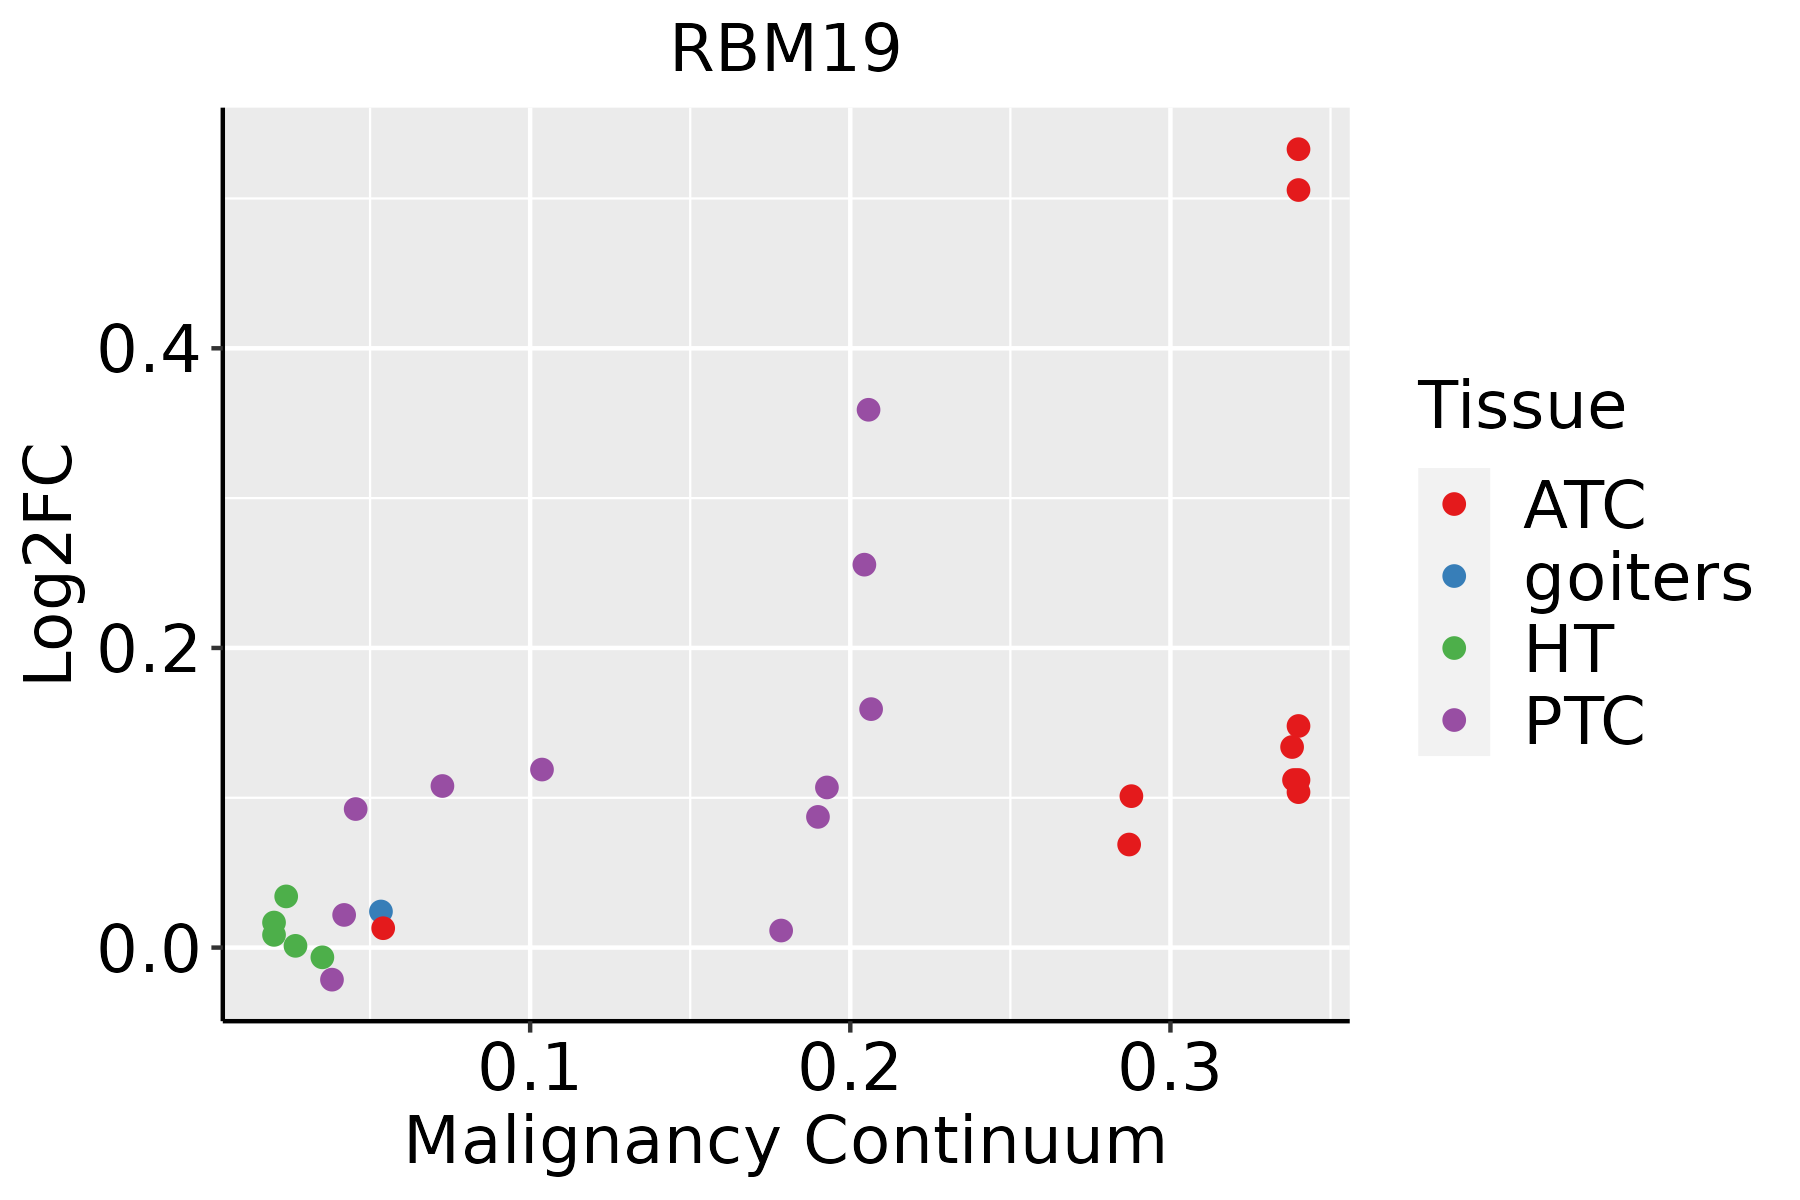
ATC: Anaplastic thyroid cancer
HT: Hashimoto's thyroiditis
PTC: Papillary thyroid cancer
∗log2FC in expression of this searched gene in stem-like cells from each diseased tissue sample relative to stem-like cells in normal samples in each tissue plotted against the malignancy continuum. Samples are colored based on if they are from different disease stage.

Top

Malignant transformation related pathway analysis

check buttonFind out the enriched GO biological processes and KEGG pathways involved in transition from healthy to precancer to cancer
check button Figure of enriched GO biological processes.
TissueDisease StageEnriched GO biological Processes
ColorectumADGO analysis - Figure of enriched GO biological processes: Top 15 enriched GO BP terms are showed in the bar plot of each disease state in each tissue. Each row represents a significant GO biological process which is colored according to the -log10(p.adjust).
ColorectumSERGO analysis - Figure of enriched GO biological processes: Top 15 enriched GO BP terms are showed in the bar plot of each disease state in each tissue. Each row represents a significant GO biological process which is colored according to the -log10(p.adjust).
ColorectumMSSGO analysis - Figure of enriched GO biological processes: Top 15 enriched GO BP terms are showed in the bar plot of each disease state in each tissue. Each row represents a significant GO biological process which is colored according to the -log10(p.adjust).
ColorectumMSI-HGO analysis - Figure of enriched GO biological processes: Top 15 enriched GO BP terms are showed in the bar plot of each disease state in each tissue. Each row represents a significant GO biological process which is colored according to the -log10(p.adjust).
ColorectumFAPGO analysis - Figure of enriched GO biological processes: Top 15 enriched GO BP terms are showed in the bar plot of each disease state in each tissue. Each row represents a significant GO biological process which is colored according to the -log10(p.adjust).
∗Top 15 enriched GO BP terms are showed in the bar plot of each disease state in each tissue. Each row represents a significant GO biological process which is colored according to the -log10(p.adjust).
Page: 1 2 3 4 5 6 7 8 9 

check button Enriched GO biological processes.
GO IDTissueDisease StageDescriptionGene RatioBg Ratiopvaluep.adjustCount
GO:0008380111EsophagusESCCRNA splicing336/8552434/187231.74e-423.67e-39336
GO:0000375111EsophagusESCCRNA splicing, via transesterification reactions248/8552324/187233.05e-301.49e-27248
GO:0000377111EsophagusESCCRNA splicing, via transesterification reactions with bulged adenosine as nucleophile244/8552320/187232.52e-291.07e-26244
GO:0000398111EsophagusESCCmRNA splicing, via spliceosome244/8552320/187232.52e-291.07e-26244
GO:000838022LiverHCCRNA splicing313/7958434/187231.36e-361.73e-33313
GO:000037522LiverHCCRNA splicing, via transesterification reactions228/7958324/187231.47e-244.06e-22228
GO:000037722LiverHCCRNA splicing, via transesterification reactions with bulged adenosine as nucleophile224/7958320/187231.16e-232.62e-21224
GO:000039822LiverHCCmRNA splicing, via spliceosome224/7958320/187231.16e-232.62e-21224
GO:000838020Oral cavityOSCCRNA splicing308/7305434/187232.43e-427.70e-39308
GO:000037519Oral cavityOSCCRNA splicing, via transesterification reactions225/7305324/187235.20e-292.99e-26225
GO:000037719Oral cavityOSCCRNA splicing, via transesterification reactions with bulged adenosine as nucleophile221/7305320/187235.50e-282.18e-25221
GO:000039819Oral cavityOSCCmRNA splicing, via spliceosome221/7305320/187235.50e-282.18e-25221
GO:0008380110Oral cavityLPRNA splicing237/4623434/187231.82e-413.79e-38237
GO:0000375110Oral cavityLPRNA splicing, via transesterification reactions181/4623324/187231.36e-331.70e-30181
GO:0000377110Oral cavityLPRNA splicing, via transesterification reactions with bulged adenosine as nucleophile179/4623320/187232.48e-332.22e-30179
GO:0000398110Oral cavityLPmRNA splicing, via spliceosome179/4623320/187232.48e-332.22e-30179
GO:0008380113ThyroidPTCRNA splicing273/5968434/187234.44e-411.40e-37273
GO:0000375113ThyroidPTCRNA splicing, via transesterification reactions202/5968324/187236.81e-303.91e-27202
GO:0000377113ThyroidPTCRNA splicing, via transesterification reactions with bulged adenosine as nucleophile199/5968320/187232.96e-291.44e-26199
GO:0000398113ThyroidPTCmRNA splicing, via spliceosome199/5968320/187232.96e-291.44e-26199
Page: 1 2 

check button Enriched KEGG pathways.
Pathway IDTissueDisease StageDescriptionGene RatioBg Ratiopvaluep.adjustqvalueCount
Page: 1 

Top

Cell-cell communication analysis

check buttonIdentification of potential cell-cell interactions between two cell types and their ligand-receptor pairs for different disease states
LigandReceptorLRpairPathwayTissueDisease Stage
Page: 1 

Top

Single-cell gene regulatory network inference analysis

check buttonFind out the significant the regulons (TFs) and the target genes of each regulon across cell types for different disease states
TFCell TypeTissueDisease StageTarget GeneRSSRegulon Activity
∗The dot plots of a searched regulon are shown for all cell subpopulations in each disease state of each tissue based on the regulon specific score inferred using pySCENIC and by calculating the average expression.
Page: 1 

Top

Somatic mutation of malignant transformation related genes

check buttonAnnotation of somatic variants for genes involved in malignant transformation
Hugo SymbolVariant ClassVariant ClassificationdbSNP RSHGVScHGVSpHGVSp ShortSWISSPROTBIOTYPESIFTPolyPhenTumor Sample BarcodeTissueHistologySexAgeStageTherapy TypesDrugsOutcome
RBM19SNVMissense_Mutationnovelc.1744N>Ap.Ala582Thrp.A582TQ9Y4C8protein_codingdeleterious(0.02)benign(0.045)TCGA-5T-A9QA-01Breastbreast invasive carcinomaFemale<65I/IIChemotherapytaxolSD
RBM19SNVMissense_Mutationc.2599N>Gp.Met867Valp.M867VQ9Y4C8protein_codingtolerated(0.1)benign(0.02)TCGA-A2-A04P-01Breastbreast invasive carcinomaFemale<65III/IVChemotherapytaxolPD
RBM19SNVMissense_Mutationc.2509N>Tp.Arg837Trpp.R837WQ9Y4C8protein_codingdeleterious(0)probably_damaging(1)TCGA-A2-A0ER-01Breastbreast invasive carcinomaFemale<65I/IIChemotherapycytoxanSD
RBM19SNVMissense_Mutationrs774797332c.671C>Tp.Ser224Leup.S224LQ9Y4C8protein_codingtolerated(0.17)benign(0)TCGA-AR-A24X-01Breastbreast invasive carcinomaFemale<65I/IIHormone TherapytamoxiphenSD
RBM19SNVMissense_Mutationnovelc.2442N>Cp.Lys814Asnp.K814NQ9Y4C8protein_codingtolerated(0.07)benign(0.011)TCGA-BH-A0BS-01Breastbreast invasive carcinomaFemale<65III/IVChemotherapyadriamycinCR
RBM19SNVMissense_Mutationc.2628N>Ap.Phe876Leup.F876LQ9Y4C8protein_codingdeleterious(0)probably_damaging(1)TCGA-C8-A1HI-01Breastbreast invasive carcinomaFemale<65III/IVUnknownUnknownSD
RBM19SNVMissense_Mutationnovelc.1559N>Cp.Gly520Alap.G520AQ9Y4C8protein_codingdeleterious(0.04)probably_damaging(0.925)TCGA-E9-A5FL-01Breastbreast invasive carcinomaFemale>=65I/IIUnknownUnknownSD
RBM19insertionNonsense_Mutationnovelc.1016_1017insGCCCTGACTCCTCTTCATTGCAGGp.Asp339delinsGluProTerLeuLeuPheIleAlaGlyp.D339delinsEP*LLFIAGQ9Y4C8protein_codingTCGA-A8-A09N-01Breastbreast invasive carcinomaFemale<65III/IVUnknownUnknownSD
RBM19SNVMissense_Mutationnovelc.2395N>Ap.Val799Metp.V799MQ9Y4C8protein_codingtolerated(0.06)probably_damaging(0.913)TCGA-C5-A8XK-01Cervixcervical & endocervical cancerFemale<65I/IIChemotherapycisplatinSD
RBM19SNVMissense_Mutationrs763155552c.1006N>Gp.Ile336Valp.I336VQ9Y4C8protein_codingtolerated(1)benign(0)TCGA-Q1-A5R2-01Cervixcervical & endocervical cancerFemale<65I/IIChemotherapycisplatinPR
Page: 1 2 3 4 5 6 7 8 9 10 11 12 

Top

Related drugs of malignant transformation related genes

check buttonIdentification of chemicals and drugs interact with genes involved in malignant transfromation
(DGIdb 4.0)
Entrez IDSymbolCategoryInteraction TypesDrug Claim NameDrug NamePMIDs
Page: 1