Schematic overview of the cellular and molecular mechanisms involved in the cancer progression, including the proposed cellular and molecular mechanisms in cancer cells trajectory. AT1: alveolar type 1 cells; AT2: alveolar type 2 cells; AAH: atypical adenomatous hyperplasia; AIS: adenocarcinoma in situ; MIA: minimally invasive adenocarcinoma; IA: invasive adenocarcinoma; EMT: epithelial-mesenchymal transition

Home

Download

Statistics

Help

Contact

Center for Computational Systems Medicine
leaf

Gene summary

leaf

Malignant transformation analysis

leaf

Malignant transformation related pathway analysis

leaf

Cell-cell communication analysis

leaf

Single-cell gene regulatory network inference analysis

leaf

Somatic mutation of malignant transformation related genes

leaf

Related drugs of malignant transformation related genes

Gene: RBBP8

Gene summary for RBBP8

check button Gene summary.

Gene informationSpeciesHuman
Gene symbol

RBBP8

Gene ID

5932

Gene nameRB binding protein 8, endonuclease
Gene AliasCOM1
Cytomap18q11.2
Gene Typeprotein-coding
GO ID

GO:0000003

UniProtAcc

A0A024RC34


Top

Malignant transformation analysis

check button Identification of the aberrant gene expression in precancerous and cancerous lesions by comparing the gene expression of stem-like cells in diseased tissues with normal stem cells
check button Malignant transformation involving gene list.
Entrez IDSymbolReplicatesSpeciesOrganTissueAdj P-valueLog2FCMalignancy
5932RBBP8HCC1_MengHumanLiverHCC1.26e-47-2.42e-020.0246
5932RBBP8HCC2_MengHumanLiverHCC3.03e-101.85e-020.0107
5932RBBP8cirrhotic2HumanLiverCirrhotic2.61e-021.23e-010.0201
5932RBBP8HCC2HumanLiverHCC6.33e-103.61e+000.5341
5932RBBP8S014HumanLiverHCC7.13e-063.92e-010.2254
5932RBBP8S016HumanLiverHCC9.31e-073.32e-010.2243
5932RBBP8S028HumanLiverHCC7.45e-137.71e-010.2503
5932RBBP8S029HumanLiverHCC5.03e-116.69e-010.2581
5932RBBP8RNA-P17T-P17T-6HumanLungIAC1.56e-034.78e-010.3385
5932RBBP8RNA-P25T1-P25T1-1HumanLungAIS5.76e-166.30e-01-0.2116
5932RBBP8RNA-P25T1-P25T1-2HumanLungAIS1.85e-066.44e-01-0.1941
5932RBBP8RNA-P25T1-P25T1-4HumanLungAIS4.49e-074.22e-01-0.2119
5932RBBP8RNA-P7T1-P7T1-1HumanLungAIS2.48e-033.77e-01-0.0961
5932RBBP8RNA-P7T1-P7T1-2HumanLungAIS2.50e-034.08e-01-0.0876
5932RBBP8C04HumanOral cavityOSCC6.40e-181.01e+000.2633
5932RBBP8C21HumanOral cavityOSCC7.94e-189.35e-010.2678
5932RBBP8C30HumanOral cavityOSCC4.29e-281.38e+000.3055
5932RBBP8C38HumanOral cavityOSCC6.56e-038.45e-010.172
5932RBBP8C43HumanOral cavityOSCC2.55e-224.97e-010.1704
5932RBBP8C46HumanOral cavityOSCC9.16e-104.86e-010.1673
Page: 1 2 3 4 5 6 7 

check button Transcriptomic changes along malignancy continuum.
TissueExpression DynamicsAbbreviation
EsophagusThe image shows the transcriptomic changes along malignancy continuum.log2FC in expression of this searched gene in stem-like cells from each diseased tissue sample relative to stem-like cells in normal samples in each tissue plotted against the malignancy continuum. Samples are colored based on if they are from different disease stage.
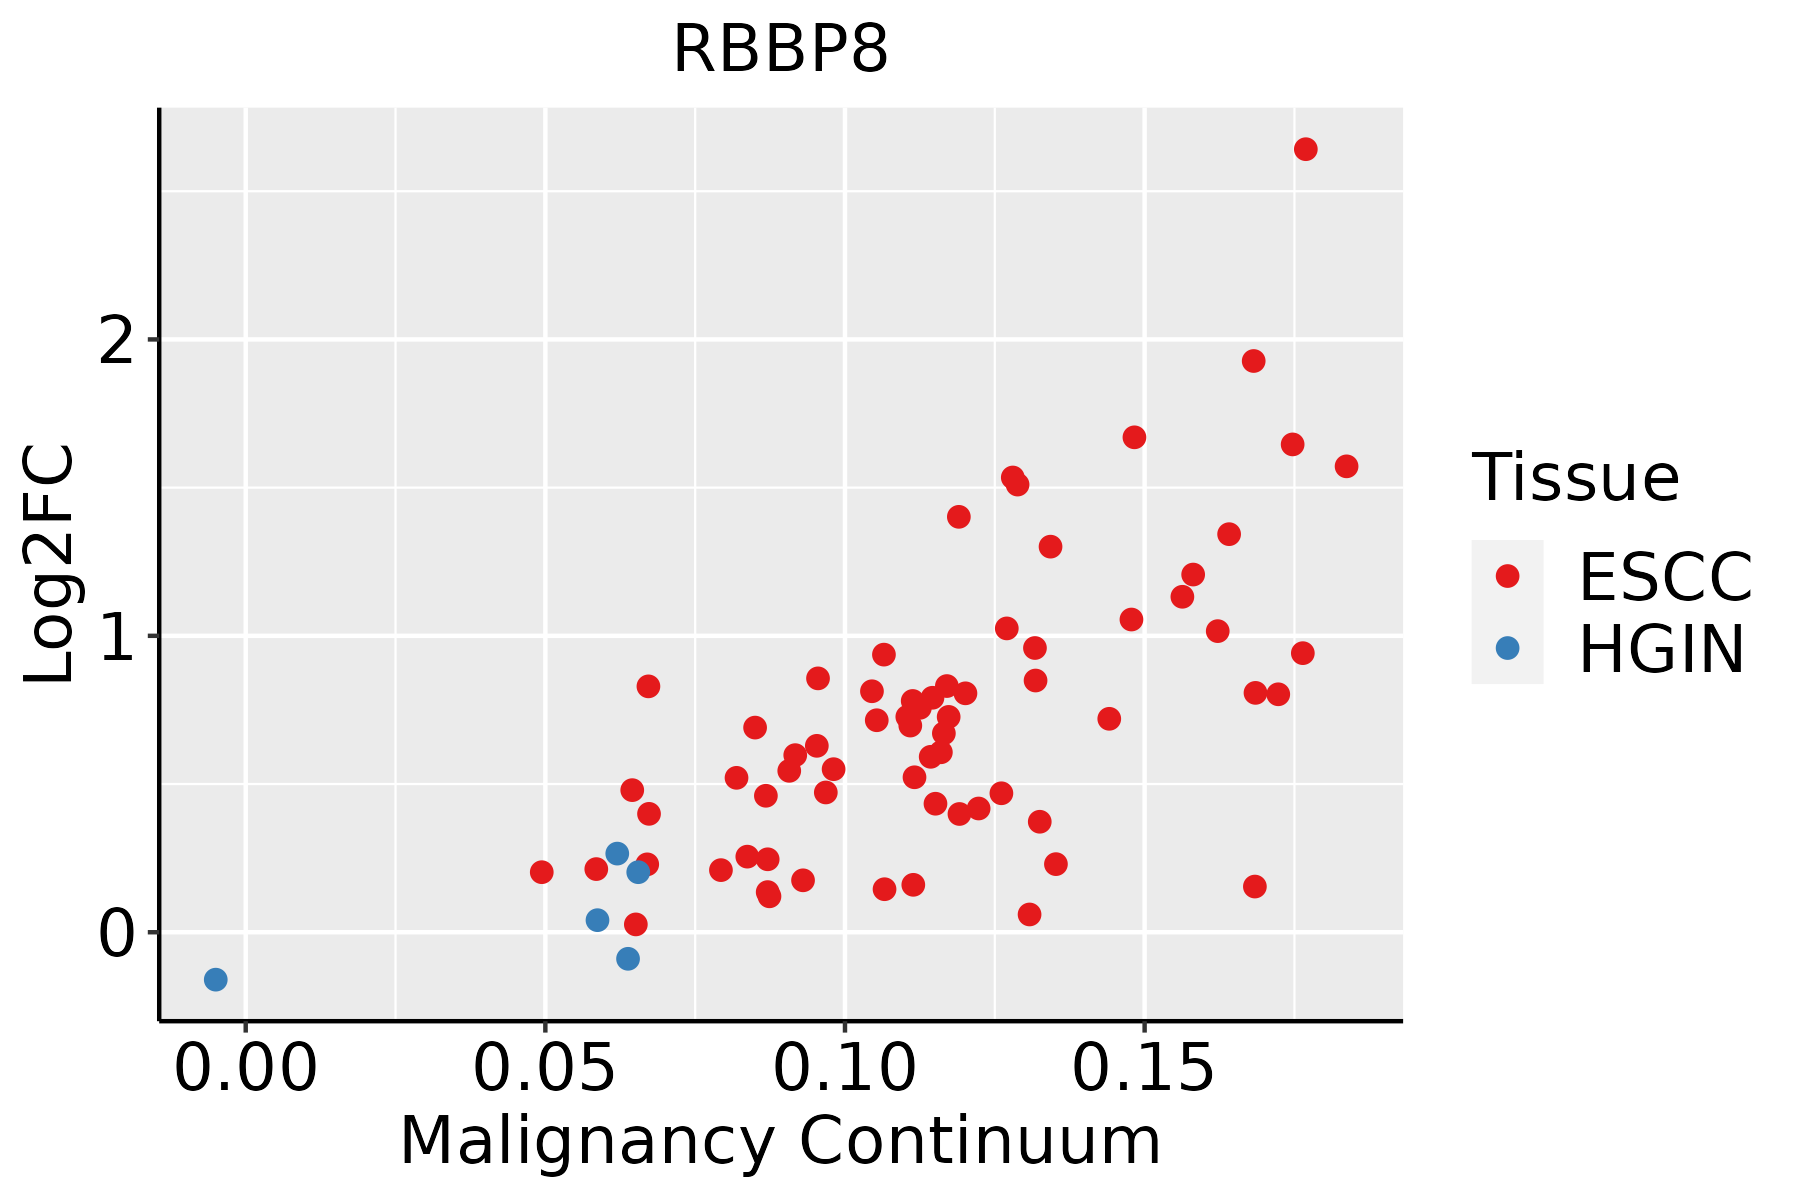
ESCC: Esophageal squamous cell carcinoma
HGIN: High-grade intraepithelial neoplasias
LGIN: Low-grade intraepithelial neoplasias
LiverThe image shows the transcriptomic changes along malignancy continuum.log2FC in expression of this searched gene in stem-like cells from each diseased tissue sample relative to stem-like cells in normal samples in each tissue plotted against the malignancy continuum. Samples are colored based on if they are from different disease stage.
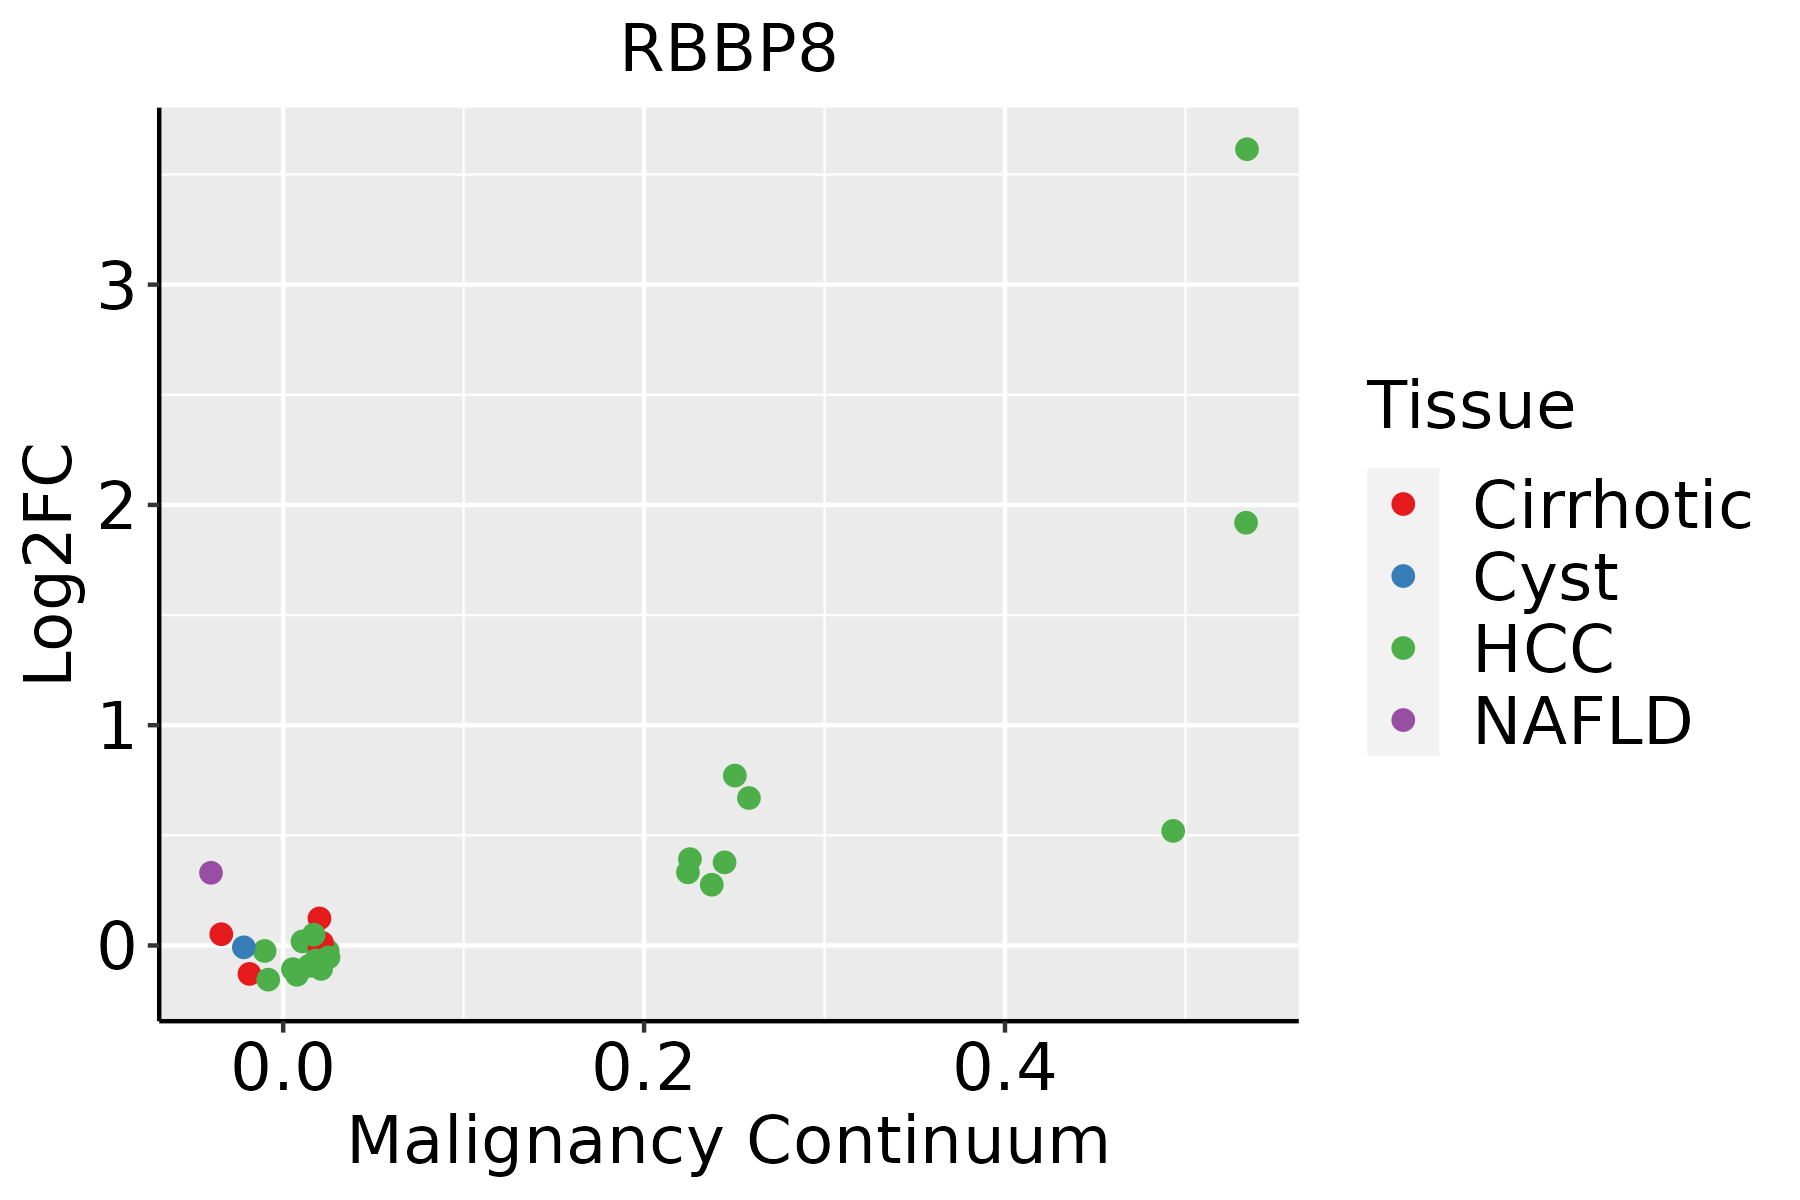
HCC: Hepatocellular carcinoma
NAFLD: Non-alcoholic fatty liver disease
LungThe image shows the transcriptomic changes along malignancy continuum.log2FC in expression of this searched gene in stem-like cells from each diseased tissue sample relative to stem-like cells in normal samples in each tissue plotted against the malignancy continuum. Samples are colored based on if they are from different disease stage.
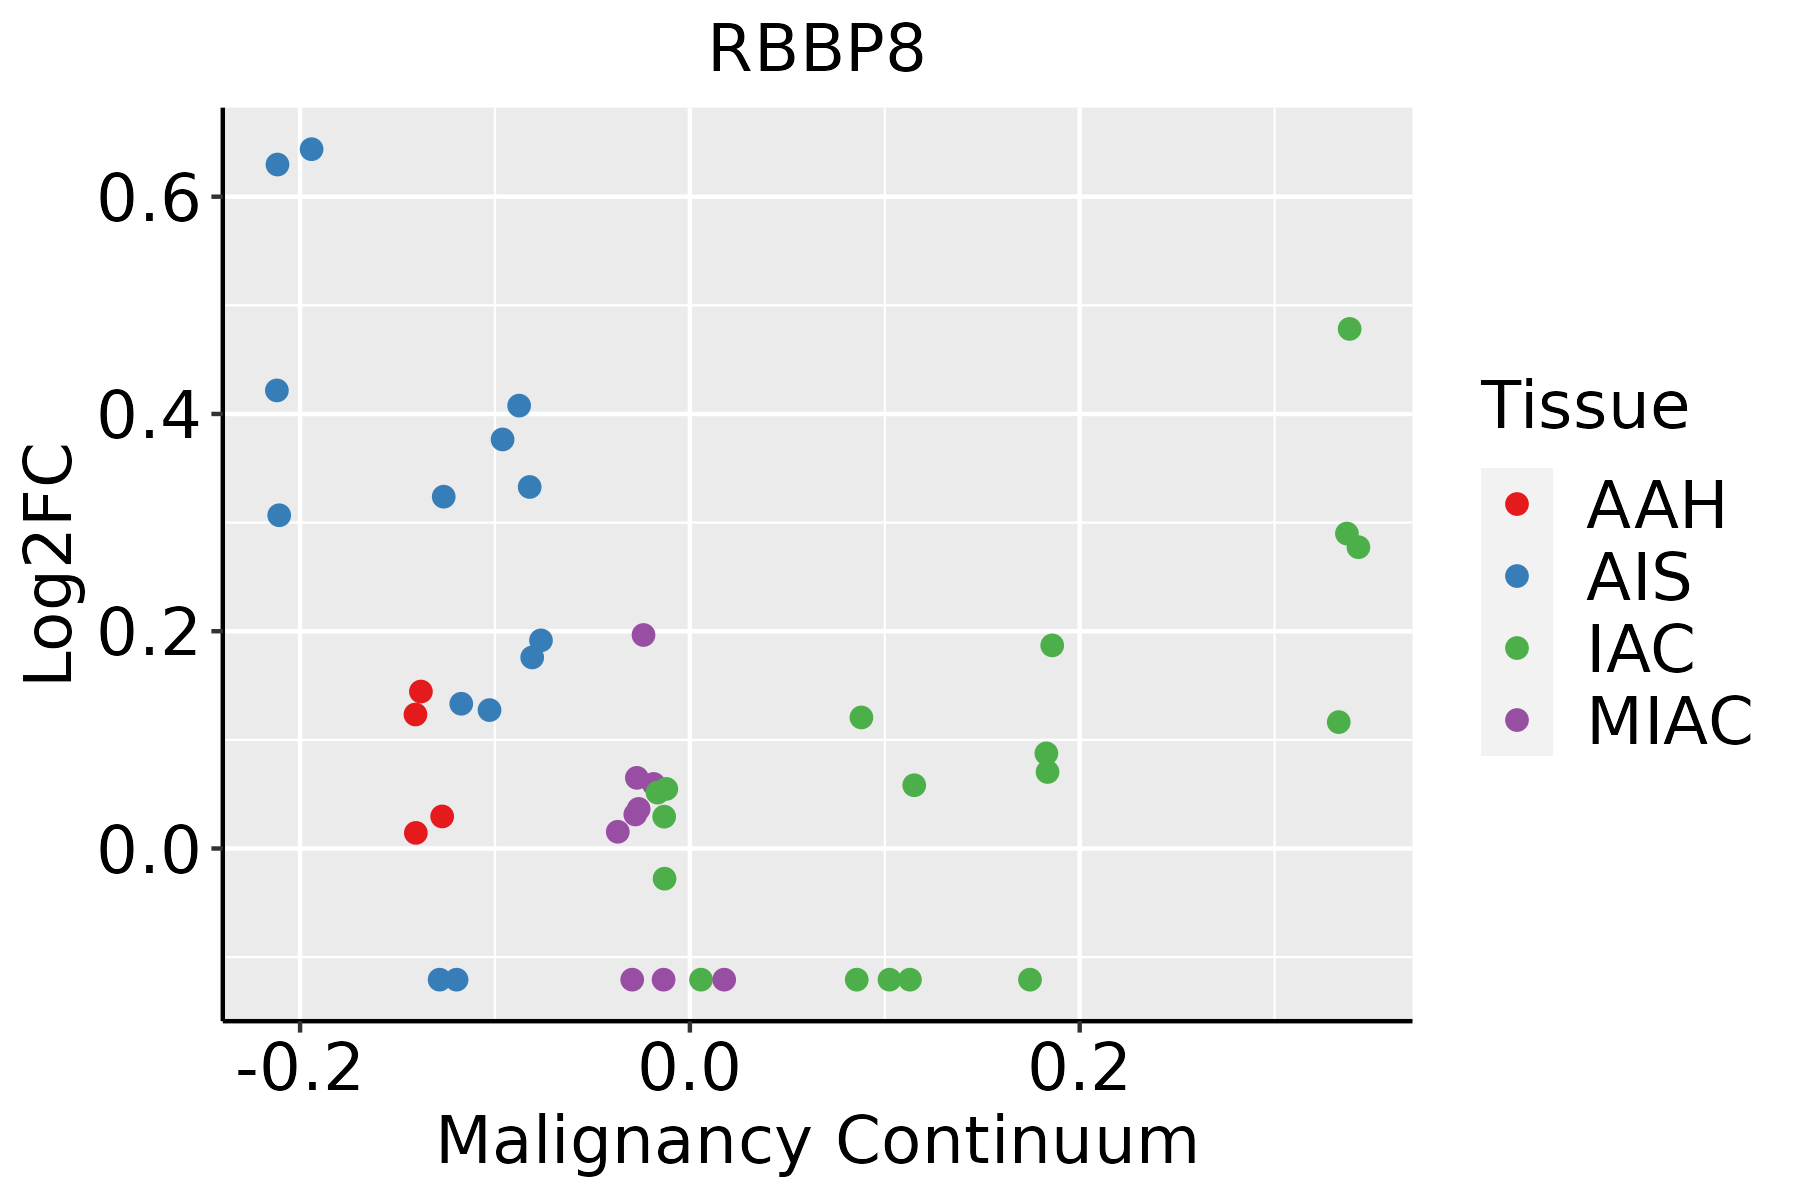
AAH: Atypical adenomatous hyperplasia
AIS: Adenocarcinoma in situ
IAC: Invasive lung adenocarcinoma
MIA: Minimally invasive adenocarcinoma
Oral CavityThe image shows the transcriptomic changes along malignancy continuum.log2FC in expression of this searched gene in stem-like cells from each diseased tissue sample relative to stem-like cells in normal samples in each tissue plotted against the malignancy continuum. Samples are colored based on if they are from different disease stage.EOLP: Erosive Oral lichen planus
LP: leukoplakia
NEOLP: Non-erosive oral lichen planus
OSCC: Oral squamous cell carcinoma
ProstateThe image shows the transcriptomic changes along malignancy continuum.log2FC in expression of this searched gene in stem-like cells from each diseased tissue sample relative to stem-like cells in normal samples in each tissue plotted against the malignancy continuum. Samples are colored based on if they are from different disease stage.BPH: Benign Prostatic Hyperplasia
SkinThe image shows the transcriptomic changes along malignancy continuum.log2FC in expression of this searched gene in stem-like cells from each diseased tissue sample relative to stem-like cells in normal samples in each tissue plotted against the malignancy continuum. Samples are colored based on if they are from different disease stage.
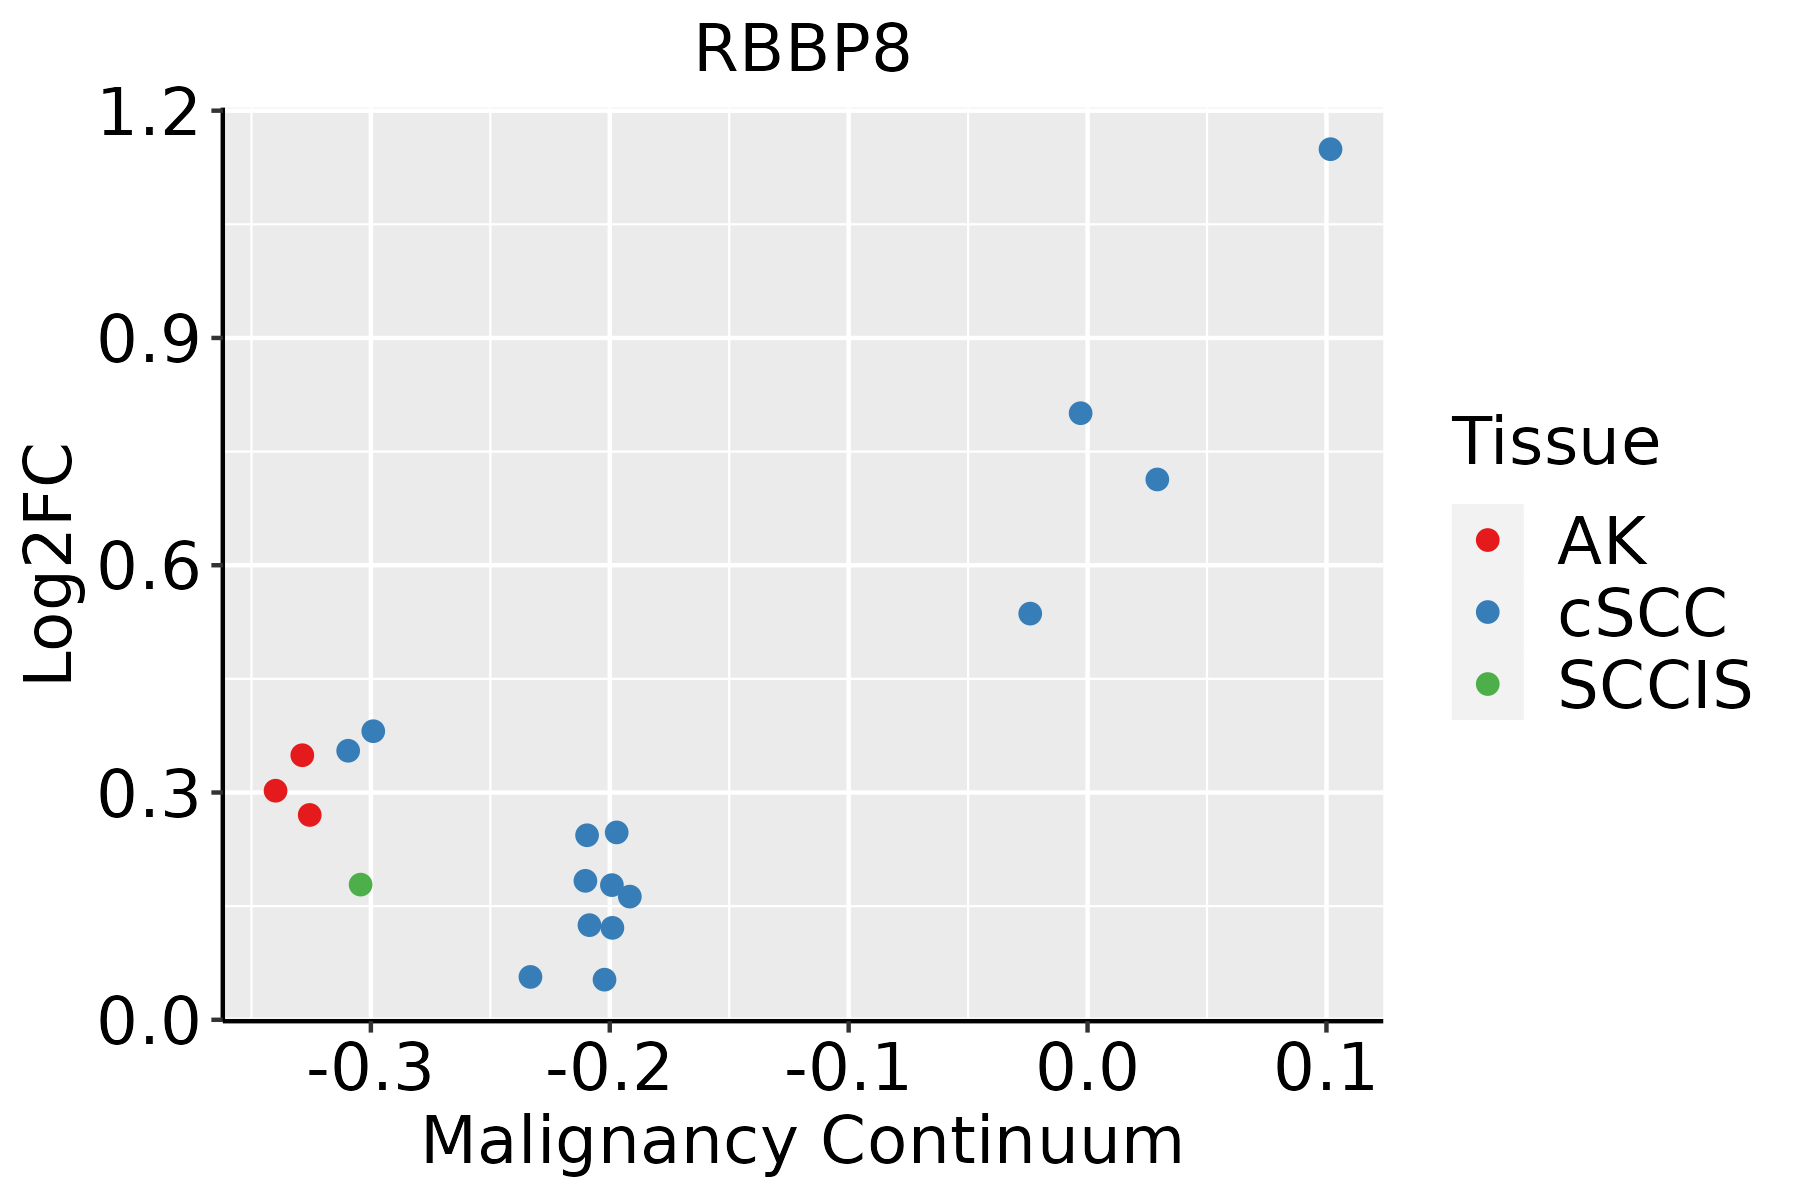
AK: Actinic keratosis
cSCC: Cutaneous squamous cell carcinoma
SCCIS:squamous cell carcinoma in situ
ThyroidThe image shows the transcriptomic changes along malignancy continuum.log2FC in expression of this searched gene in stem-like cells from each diseased tissue sample relative to stem-like cells in normal samples in each tissue plotted against the malignancy continuum. Samples are colored based on if they are from different disease stage.ATC: Anaplastic thyroid cancer
HT: Hashimoto's thyroiditis
PTC: Papillary thyroid cancer
∗log2FC in expression of this searched gene in stem-like cells from each diseased tissue sample relative to stem-like cells in normal samples in each tissue plotted against the malignancy continuum. Samples are colored based on if they are from different disease stage.

Top

Malignant transformation related pathway analysis

check buttonFind out the enriched GO biological processes and KEGG pathways involved in transition from healthy to precancer to cancer
check button Figure of enriched GO biological processes.
TissueDisease StageEnriched GO biological Processes
ColorectumADGO analysis - Figure of enriched GO biological processes: Top 15 enriched GO BP terms are showed in the bar plot of each disease state in each tissue. Each row represents a significant GO biological process which is colored according to the -log10(p.adjust).
ColorectumSERGO analysis - Figure of enriched GO biological processes: Top 15 enriched GO BP terms are showed in the bar plot of each disease state in each tissue. Each row represents a significant GO biological process which is colored according to the -log10(p.adjust).
ColorectumMSSGO analysis - Figure of enriched GO biological processes: Top 15 enriched GO BP terms are showed in the bar plot of each disease state in each tissue. Each row represents a significant GO biological process which is colored according to the -log10(p.adjust).
ColorectumMSI-HGO analysis - Figure of enriched GO biological processes: Top 15 enriched GO BP terms are showed in the bar plot of each disease state in each tissue. Each row represents a significant GO biological process which is colored according to the -log10(p.adjust).
ColorectumFAPGO analysis - Figure of enriched GO biological processes: Top 15 enriched GO BP terms are showed in the bar plot of each disease state in each tissue. Each row represents a significant GO biological process which is colored according to the -log10(p.adjust).
∗Top 15 enriched GO BP terms are showed in the bar plot of each disease state in each tissue. Each row represents a significant GO biological process which is colored according to the -log10(p.adjust).
Page: 1 2 3 4 5 6 7 8 9 

check button Enriched GO biological processes.
GO IDTissueDisease StageDescriptionGene RatioBg Ratiopvaluep.adjustCount
GO:004477216EsophagusESCCmitotic cell cycle phase transition281/8552424/187234.63e-184.45e-16281
GO:000170119EsophagusESCCin utero embryonic development243/8552367/187231.00e-156.86e-14243
GO:00903053EsophagusESCCnucleic acid phosphodiester bond hydrolysis163/8552261/187233.07e-085.73e-07163
GO:000008214EsophagusESCCG1/S transition of mitotic cell cycle134/8552214/187234.04e-075.55e-06134
GO:004484314EsophagusESCCcell cycle G1/S phase transition148/8552241/187235.68e-077.48e-06148
GO:000182412EsophagusESCCblastocyst development73/8552106/187231.13e-061.40e-0573
GO:00063024EsophagusESCCdouble-strand break repair152/8552251/187231.33e-061.62e-05152
GO:00063101EsophagusESCCDNA recombination168/8552305/187235.58e-043.05e-03168
GO:00007241EsophagusESCCdouble-strand break repair via homologous recombination79/8552138/187234.05e-031.62e-0279
GO:00007251EsophagusESCCrecombinational repair80/8552140/187234.10e-031.63e-0280
GO:0044772LiverNAFLDmitotic cell cycle phase transition67/1882424/187231.25e-042.39e-0367
GO:0044843LiverNAFLDcell cycle G1/S phase transition43/1882241/187231.40e-042.63e-0343
GO:0000082LiverNAFLDG1/S transition of mitotic cell cycle39/1882214/187231.78e-043.14e-0339
GO:00323553LiverNAFLDresponse to estradiol25/1882141/187233.51e-033.01e-0225
GO:00017015LiverCirrhoticin utero embryonic development134/4634367/187232.78e-076.86e-06134
GO:00447721LiverCirrhoticmitotic cell cycle phase transition139/4634424/187231.02e-041.06e-03139
GO:00323551LiverCirrhoticresponse to estradiol51/4634141/187231.60e-031.04e-0251
GO:00000821LiverCirrhoticG1/S transition of mitotic cell cycle72/4634214/187232.07e-031.28e-0272
GO:00448431LiverCirrhoticcell cycle G1/S phase transition77/4634241/187236.68e-033.30e-0277
GO:00447722LiverHCCmitotic cell cycle phase transition240/7958424/187232.47e-096.84e-08240
Page: 1 2 3 4 5 

check button Enriched KEGG pathways.
Pathway IDTissueDisease StageDescriptionGene RatioBg Ratiopvaluep.adjustqvalueCount
Page: 1 

Top

Cell-cell communication analysis

check buttonIdentification of potential cell-cell interactions between two cell types and their ligand-receptor pairs for different disease states
LigandReceptorLRpairPathwayTissueDisease Stage
Page: 1 

Top

Single-cell gene regulatory network inference analysis

check buttonFind out the significant the regulons (TFs) and the target genes of each regulon across cell types for different disease states
TFCell TypeTissueDisease StageTarget GeneRSSRegulon Activity
∗The dot plots of a searched regulon are shown for all cell subpopulations in each disease state of each tissue based on the regulon specific score inferred using pySCENIC and by calculating the average expression.
Page: 1 

Top

Somatic mutation of malignant transformation related genes

check buttonAnnotation of somatic variants for genes involved in malignant transformation
Hugo SymbolVariant ClassVariant ClassificationdbSNP RSHGVScHGVSpHGVSp ShortSWISSPROTBIOTYPESIFTPolyPhenTumor Sample BarcodeTissueHistologySexAgeStageTherapy TypesDrugsOutcome
RBBP8SNVMissense_Mutationc.2429N>Tp.Gly810Valp.G810VQ99708protein_codingdeleterious(0)probably_damaging(1)TCGA-A2-A25A-01Breastbreast invasive carcinomaFemale<65I/IIUnspecificCytoxanSD
RBBP8SNVMissense_Mutationnovelc.2530N>Ap.Pro844Thrp.P844TQ99708protein_codingdeleterious(0)probably_damaging(1)TCGA-AR-A0TY-01Breastbreast invasive carcinomaFemale<65I/IIUnspecificPaclitaxelPD
RBBP8SNVMissense_Mutationc.2429N>Tp.Gly810Valp.G810VQ99708protein_codingdeleterious(0)probably_damaging(1)TCGA-D8-A1XL-01Breastbreast invasive carcinomaFemale<65I/IIChemotherapydoxorubicine+cyclophosphamide+tamoxifenSD
RBBP8SNVMissense_Mutationrs201845876c.1351N>Ap.Glu451Lysp.E451KQ99708protein_codingdeleterious(0.01)possibly_damaging(0.647)TCGA-EW-A1J5-01Breastbreast invasive carcinomaFemale<65I/IIChemotherapyadriamycinSD
RBBP8SNVMissense_Mutationrs768802597c.2254N>Cp.Glu752Glnp.E752QQ99708protein_codingdeleterious(0.02)benign(0.116)TCGA-EW-A1PB-01Breastbreast invasive carcinomaFemale>=65III/IVUnknownUnknownSD
RBBP8insertionNonsense_Mutationnovelc.2531_2532insTGATTACTGTTAGTAATTAATACTGTCTGTAAGAp.Pro845AspfsTer4p.P845Dfs*4Q99708protein_codingTCGA-AR-A0TY-01Breastbreast invasive carcinomaFemale<65I/IIUnspecificPaclitaxelPD
RBBP8insertionNonsense_Mutationnovelc.1820_1821insTAAAATCTAGACAGAAGCAp.Ser608LysfsTer3p.S608Kfs*3Q99708protein_codingTCGA-C8-A134-01Breastbreast invasive carcinomaFemale<65I/IIChemotherapy5-fluorouracilCR
RBBP8deletionFrame_Shift_Delc.1544_1571delNNNNNNNNNNNNNNNNNNNNNNNNNNNNp.Lys515IlefsTer2p.K515Ifs*2Q99708protein_codingTCGA-D8-A146-01Breastbreast invasive carcinomaFemale<65I/IIUnknownUnknownSD
RBBP8SNVMissense_Mutationnovelc.2561N>Cp.Val854Alap.V854AQ99708protein_codingdeleterious(0)probably_damaging(0.994)TCGA-C5-A8XI-01Cervixcervical & endocervical cancerFemale>=65I/IIChemotherapycisplatinSD
RBBP8SNVMissense_Mutationc.1951N>Cp.Glu651Glnp.E651QQ99708protein_codingdeleterious(0.01)possibly_damaging(0.621)TCGA-EA-A5ZF-01Cervixcervical & endocervical cancerFemale<65I/IIUnknownUnknownPD
Page: 1 2 3 4 5 6 7 8 

Top

Related drugs of malignant transformation related genes

check buttonIdentification of chemicals and drugs interact with genes involved in malignant transfromation
(DGIdb 4.0)
Entrez IDSymbolCategoryInteraction TypesDrug Claim NameDrug NamePMIDs
Page: 1