Schematic overview of the cellular and molecular mechanisms involved in the cancer progression, including the proposed cellular and molecular mechanisms in cancer cells trajectory. AT1: alveolar type 1 cells; AT2: alveolar type 2 cells; AAH: atypical adenomatous hyperplasia; AIS: adenocarcinoma in situ; MIA: minimally invasive adenocarcinoma; IA: invasive adenocarcinoma; EMT: epithelial-mesenchymal transition

Home

Download

Statistics

Help

Contact

Center for Computational Systems Medicine
leaf

Gene summary

leaf

Malignant transformation analysis

leaf

Malignant transformation related pathway analysis

leaf

Cell-cell communication analysis

leaf

Single-cell gene regulatory network inference analysis

leaf

Somatic mutation of malignant transformation related genes

leaf

Related drugs of malignant transformation related genes

Gene: RABGAP1L

Gene summary for RABGAP1L

check button Gene summary.

Gene informationSpeciesHuman
Gene symbol

RABGAP1L

Gene ID

9910

Gene nameRAB GTPase activating protein 1 like
Gene AliasHHL
Cytomap1q25.1
Gene Typeprotein-coding
GO ID

GO:0006810

UniProtAcc

Q5R372


Top

Malignant transformation analysis

check button Identification of the aberrant gene expression in precancerous and cancerous lesions by comparing the gene expression of stem-like cells in diseased tissues with normal stem cells
check button Malignant transformation involving gene list.
Entrez IDSymbolReplicatesSpeciesOrganTissueAdj P-valueLog2FCMalignancy
9910RABGAP1LLZE8THumanEsophagusESCC9.75e-081.72e-010.067
9910RABGAP1LLZE20THumanEsophagusESCC1.12e-082.49e-010.0662
9910RABGAP1LLZE22THumanEsophagusESCC2.60e-053.32e-010.068
9910RABGAP1LLZE24THumanEsophagusESCC2.90e-145.57e-010.0596
9910RABGAP1LLZE21THumanEsophagusESCC2.45e-063.67e-010.0655
9910RABGAP1LLZE6THumanEsophagusESCC1.05e-051.99e-010.0845
9910RABGAP1LP1T-EHumanEsophagusESCC3.51e-084.73e-010.0875
9910RABGAP1LP2T-EHumanEsophagusESCC1.74e-153.37e-010.1177
9910RABGAP1LP4T-EHumanEsophagusESCC4.01e-224.87e-010.1323
9910RABGAP1LP5T-EHumanEsophagusESCC7.17e-284.23e-010.1327
9910RABGAP1LP8T-EHumanEsophagusESCC2.18e-265.09e-010.0889
9910RABGAP1LP9T-EHumanEsophagusESCC1.27e-192.85e-010.1131
9910RABGAP1LP10T-EHumanEsophagusESCC1.14e-143.17e-010.116
9910RABGAP1LP11T-EHumanEsophagusESCC3.05e-137.44e-010.1426
9910RABGAP1LP12T-EHumanEsophagusESCC3.40e-173.86e-010.1122
9910RABGAP1LP15T-EHumanEsophagusESCC1.06e-336.77e-010.1149
9910RABGAP1LP16T-EHumanEsophagusESCC3.41e-153.24e-010.1153
9910RABGAP1LP19T-EHumanEsophagusESCC4.07e-052.93e-010.1662
9910RABGAP1LP20T-EHumanEsophagusESCC2.77e-256.02e-010.1124
9910RABGAP1LP21T-EHumanEsophagusESCC7.48e-306.06e-010.1617
Page: 1 2 3 4 5 6 7 8 9 10 11 12 

check button Transcriptomic changes along malignancy continuum.
TissueExpression DynamicsAbbreviation
CervixThe image shows the transcriptomic changes along malignancy continuum.log2FC in expression of this searched gene in stem-like cells from each diseased tissue sample relative to stem-like cells in normal samples in each tissue plotted against the malignancy continuum. Samples are colored based on if they are from different disease stage.CC: Cervix cancer
HSIL_HPV: HPV-infected high-grade squamous intraepithelial lesions
N_HPV: HPV-infected normal cervix
Colorectum (GSE201348)The image shows the transcriptomic changes along malignancy continuum.log2FC in expression of this searched gene in stem-like cells from each diseased tissue sample relative to stem-like cells in normal samples in each tissue plotted against the malignancy continuum. Samples are colored based on if they are from different disease stage.FAP: Familial adenomatous polyposis
CRC: Colorectal cancer
Colorectum (HTA11)The image shows the transcriptomic changes along malignancy continuum.log2FC in expression of this searched gene in stem-like cells from each diseased tissue sample relative to stem-like cells in normal samples in each tissue plotted against the malignancy continuum. Samples are colored based on if they are from different disease stage.AD: Adenomas
SER: Sessile serrated lesions
MSI-H: Microsatellite-high colorectal cancer
MSS: Microsatellite stable colorectal cancer
EndometriumThe image shows the transcriptomic changes along malignancy continuum.log2FC in expression of this searched gene in stem-like cells from each diseased tissue sample relative to stem-like cells in normal samples in each tissue plotted against the malignancy continuum. Samples are colored based on if they are from different disease stage.AEH: Atypical endometrial hyperplasia
EEC: Endometrioid Cancer
EsophagusThe image shows the transcriptomic changes along malignancy continuum.log2FC in expression of this searched gene in stem-like cells from each diseased tissue sample relative to stem-like cells in normal samples in each tissue plotted against the malignancy continuum. Samples are colored based on if they are from different disease stage.
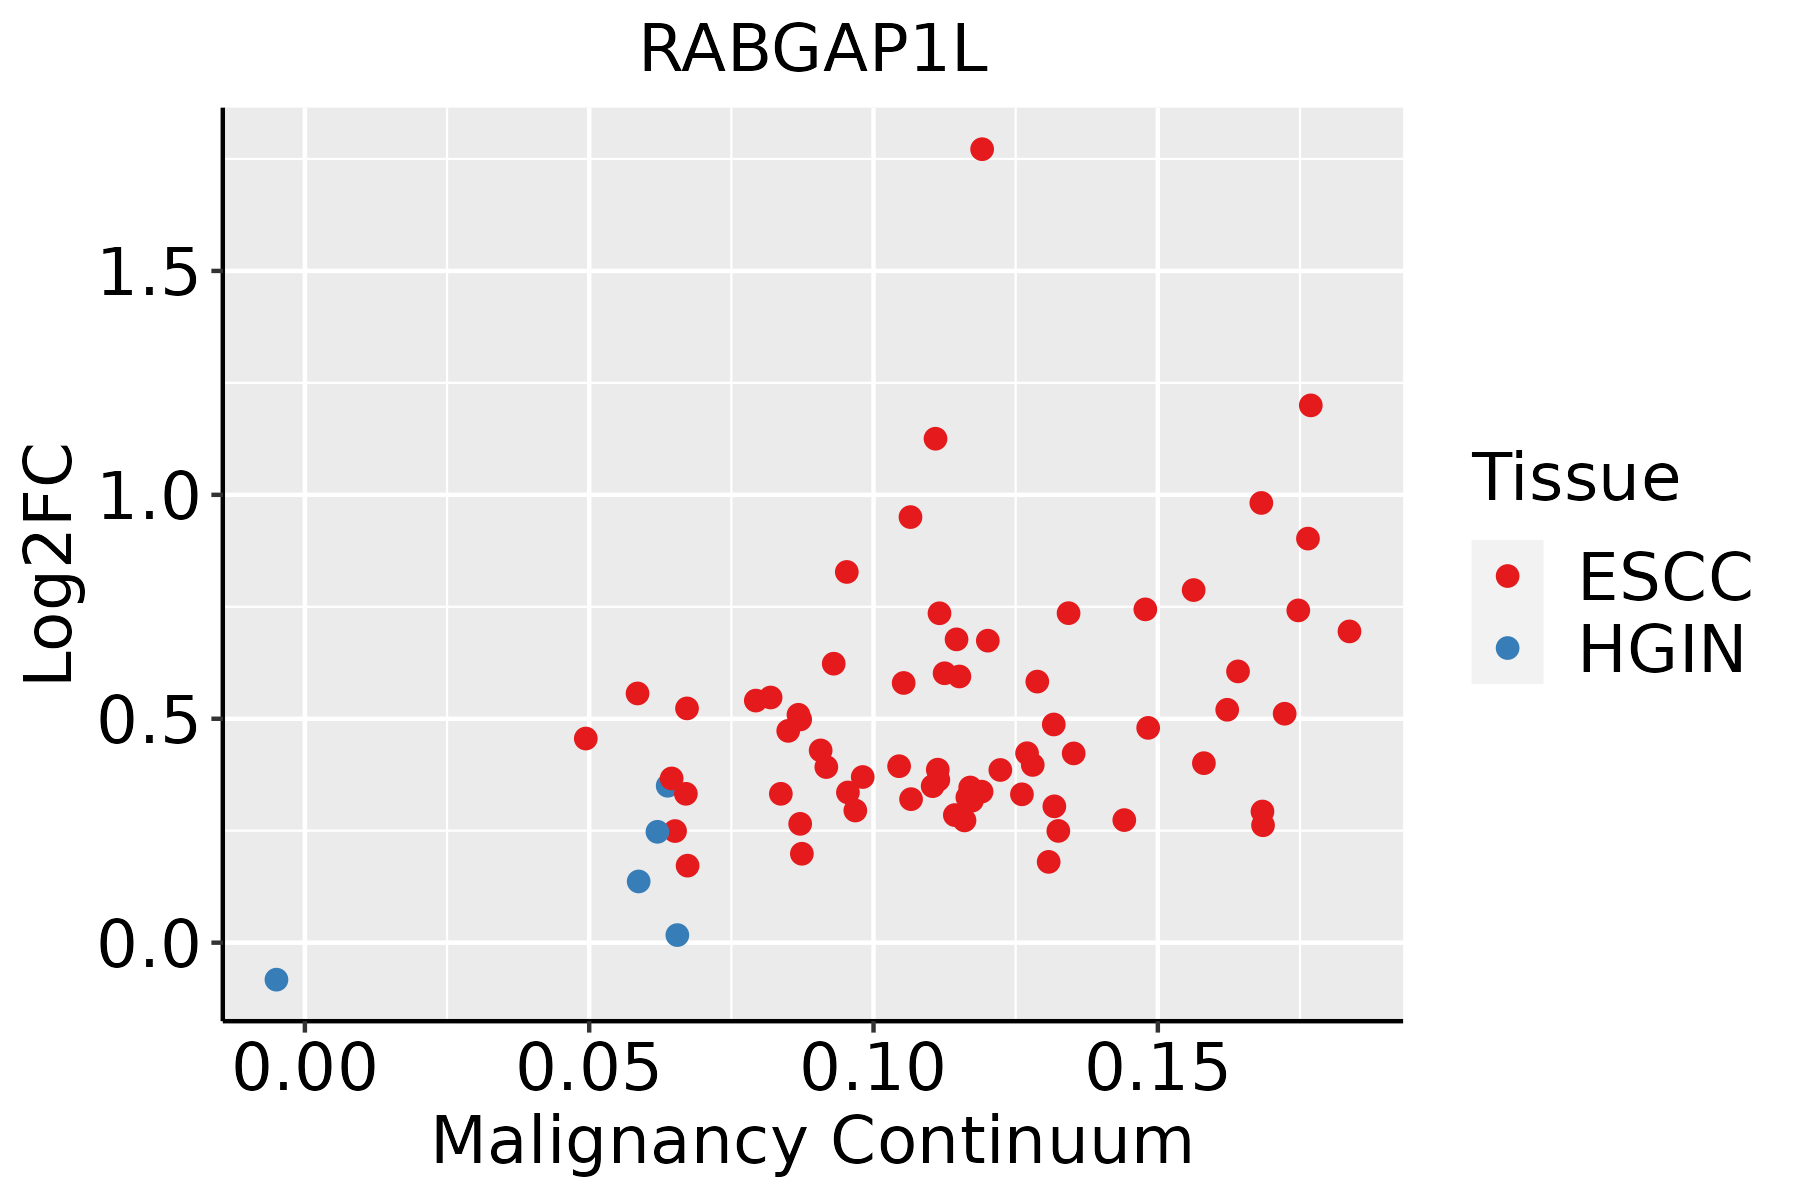
ESCC: Esophageal squamous cell carcinoma
HGIN: High-grade intraepithelial neoplasias
LGIN: Low-grade intraepithelial neoplasias
GCThe image shows the transcriptomic changes along malignancy continuum.log2FC in expression of this searched gene in stem-like cells from each diseased tissue sample relative to stem-like cells in normal samples in each tissue plotted against the malignancy continuum. Samples are colored based on if they are from different disease stage.CAG: Chronic atrophic gastritis
CAG with IM: Chronic atrophic gastritis with intestinal metaplasia
CSG: Chronic superficial gastritis
GC: Gastric cancer
SIM: Severe intestinal metaplasia
WIM: Wild intestinal metaplasia
LiverThe image shows the transcriptomic changes along malignancy continuum.log2FC in expression of this searched gene in stem-like cells from each diseased tissue sample relative to stem-like cells in normal samples in each tissue plotted against the malignancy continuum. Samples are colored based on if they are from different disease stage.
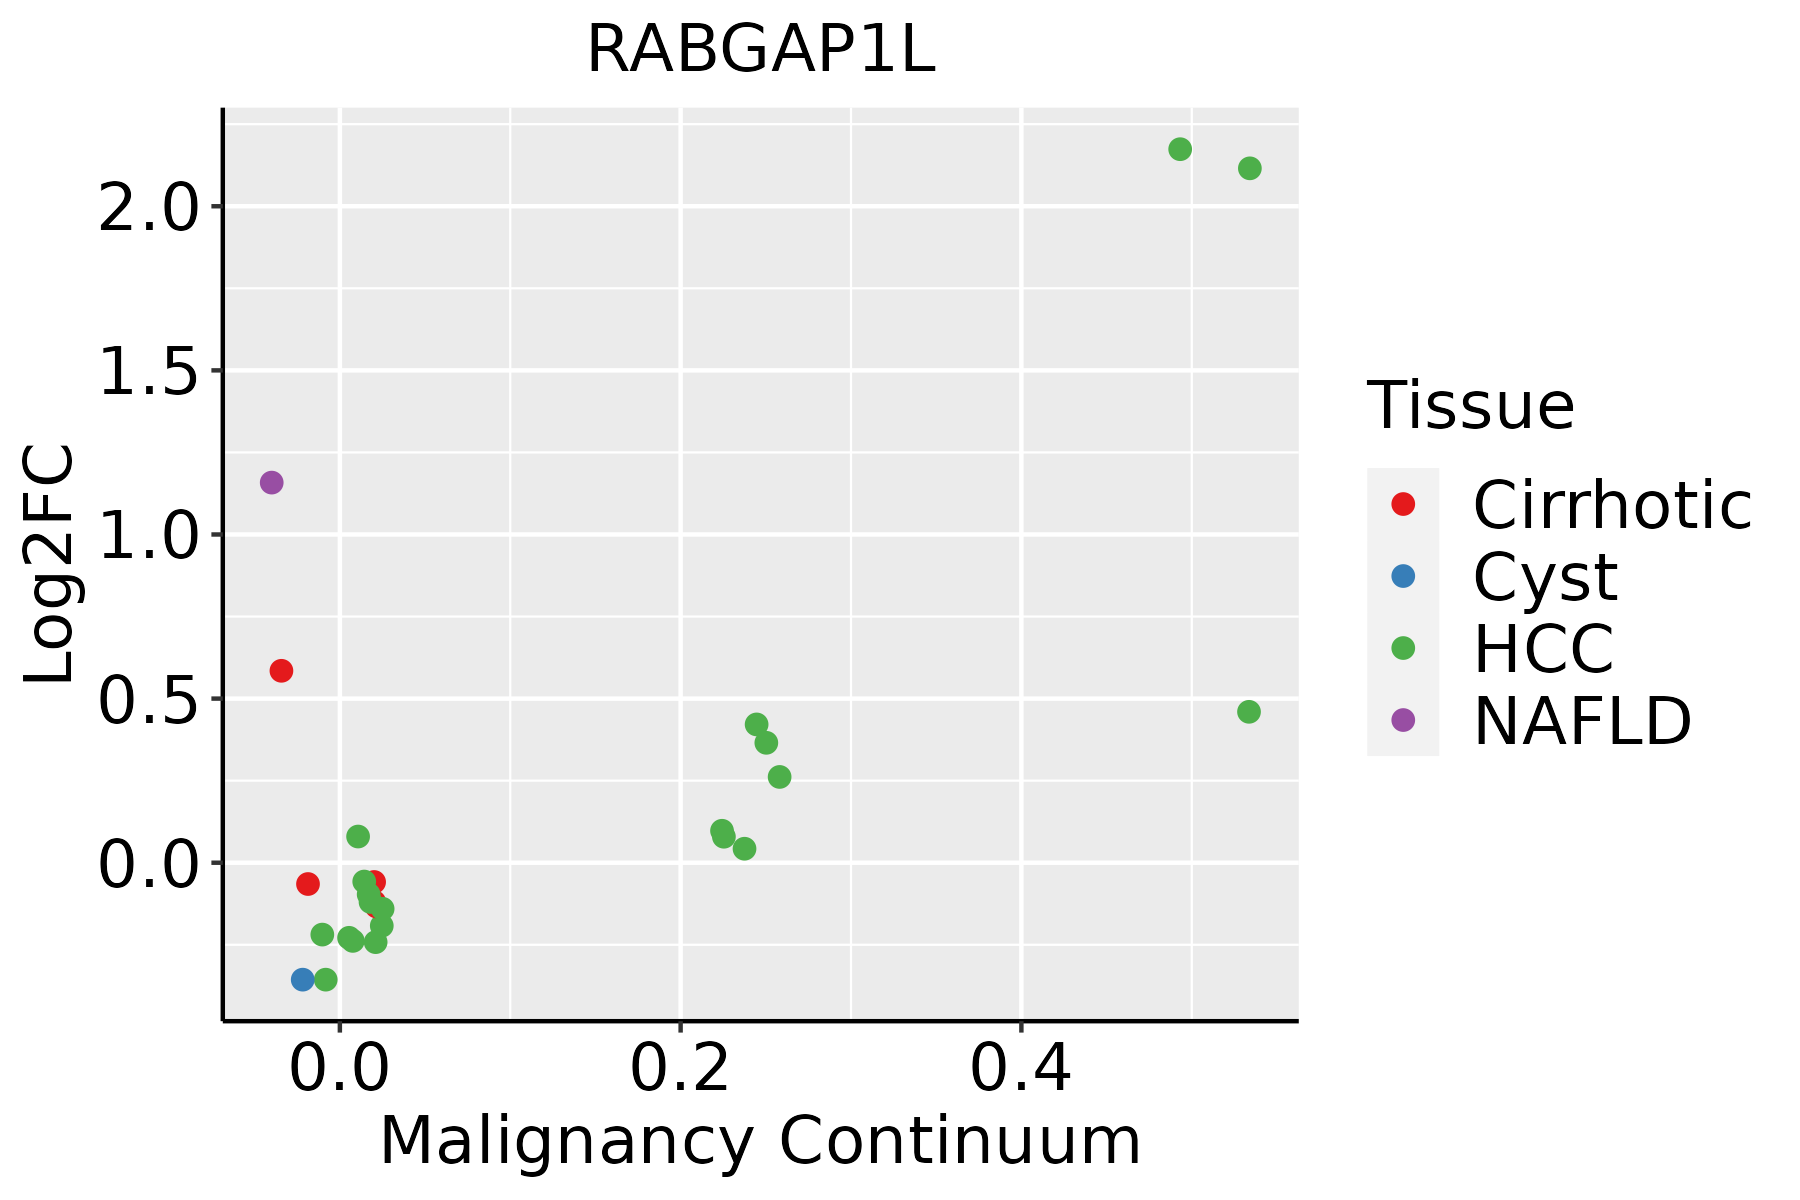
HCC: Hepatocellular carcinoma
NAFLD: Non-alcoholic fatty liver disease
LungThe image shows the transcriptomic changes along malignancy continuum.log2FC in expression of this searched gene in stem-like cells from each diseased tissue sample relative to stem-like cells in normal samples in each tissue plotted against the malignancy continuum. Samples are colored based on if they are from different disease stage.
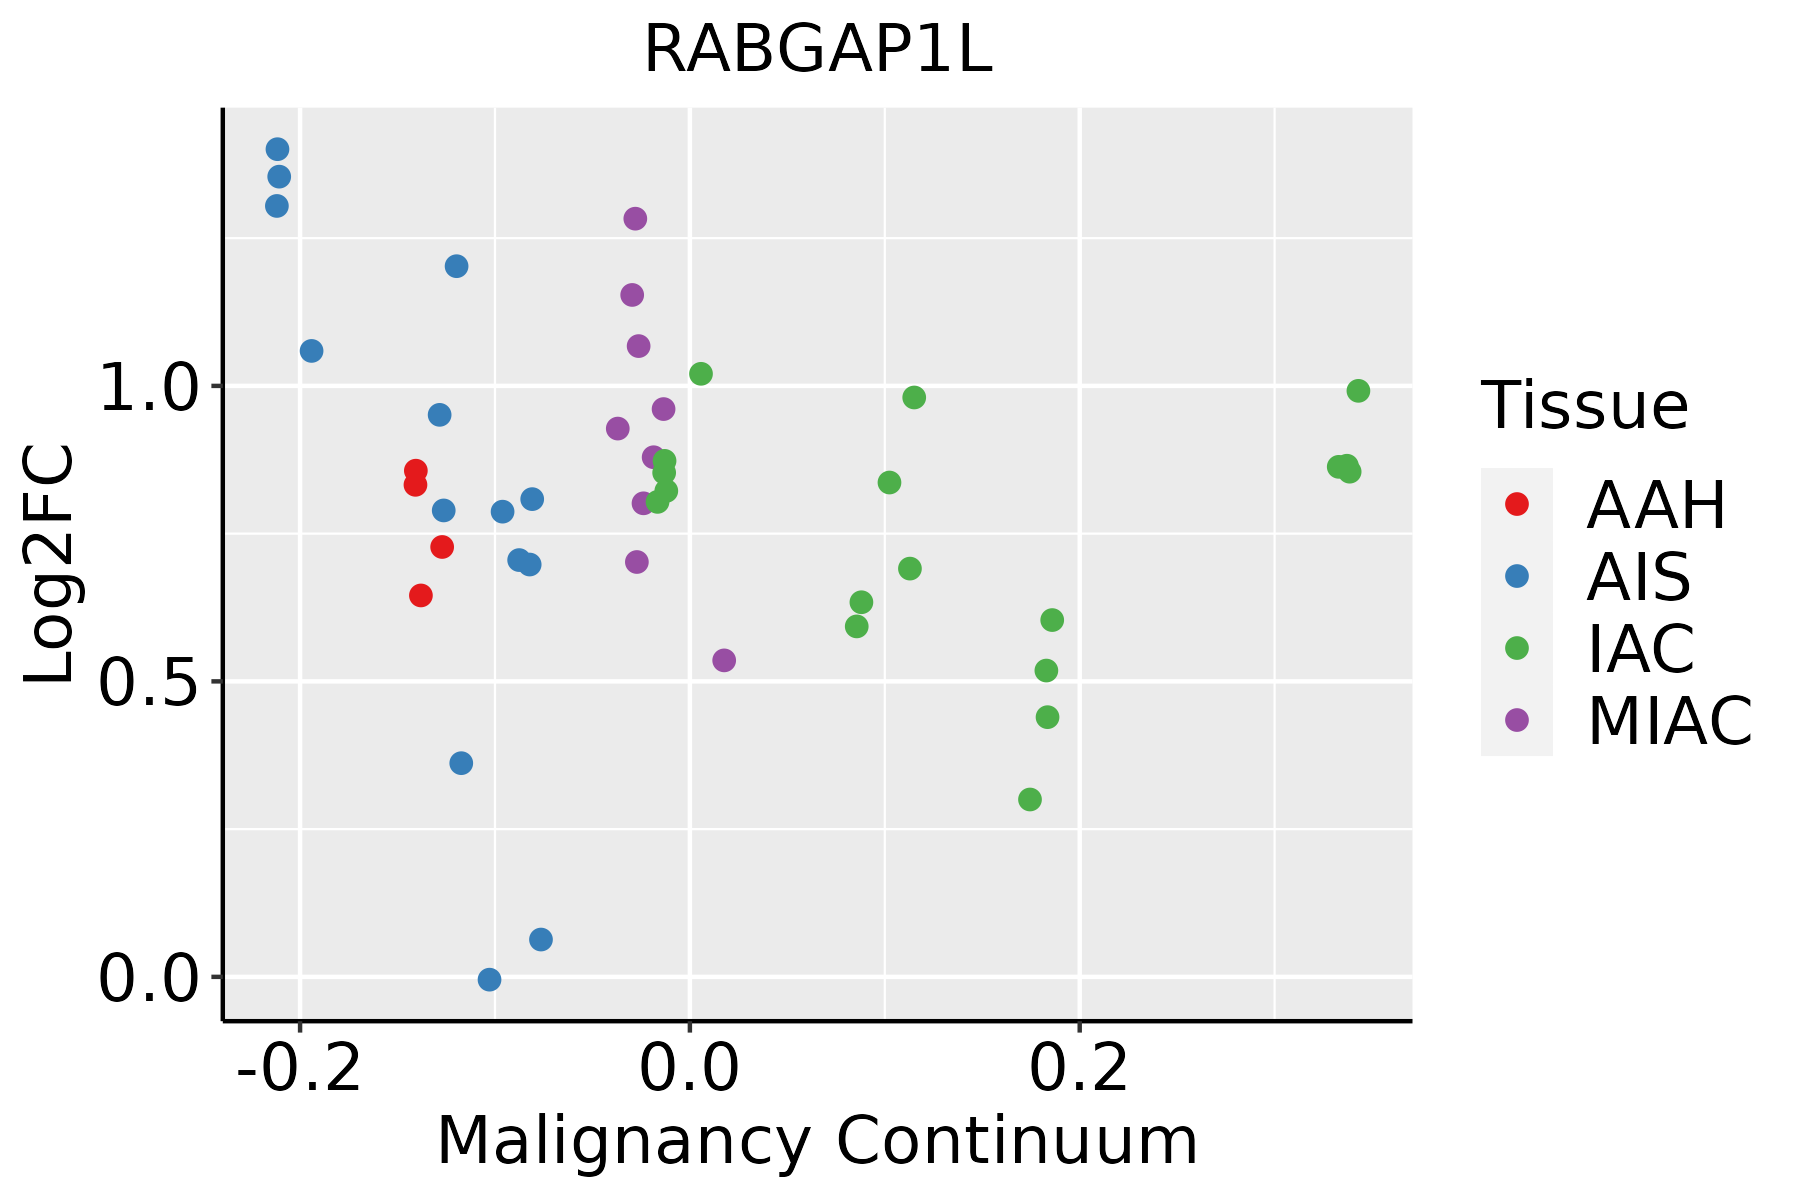
AAH: Atypical adenomatous hyperplasia
AIS: Adenocarcinoma in situ
IAC: Invasive lung adenocarcinoma
MIA: Minimally invasive adenocarcinoma
Oral CavityThe image shows the transcriptomic changes along malignancy continuum.log2FC in expression of this searched gene in stem-like cells from each diseased tissue sample relative to stem-like cells in normal samples in each tissue plotted against the malignancy continuum. Samples are colored based on if they are from different disease stage.
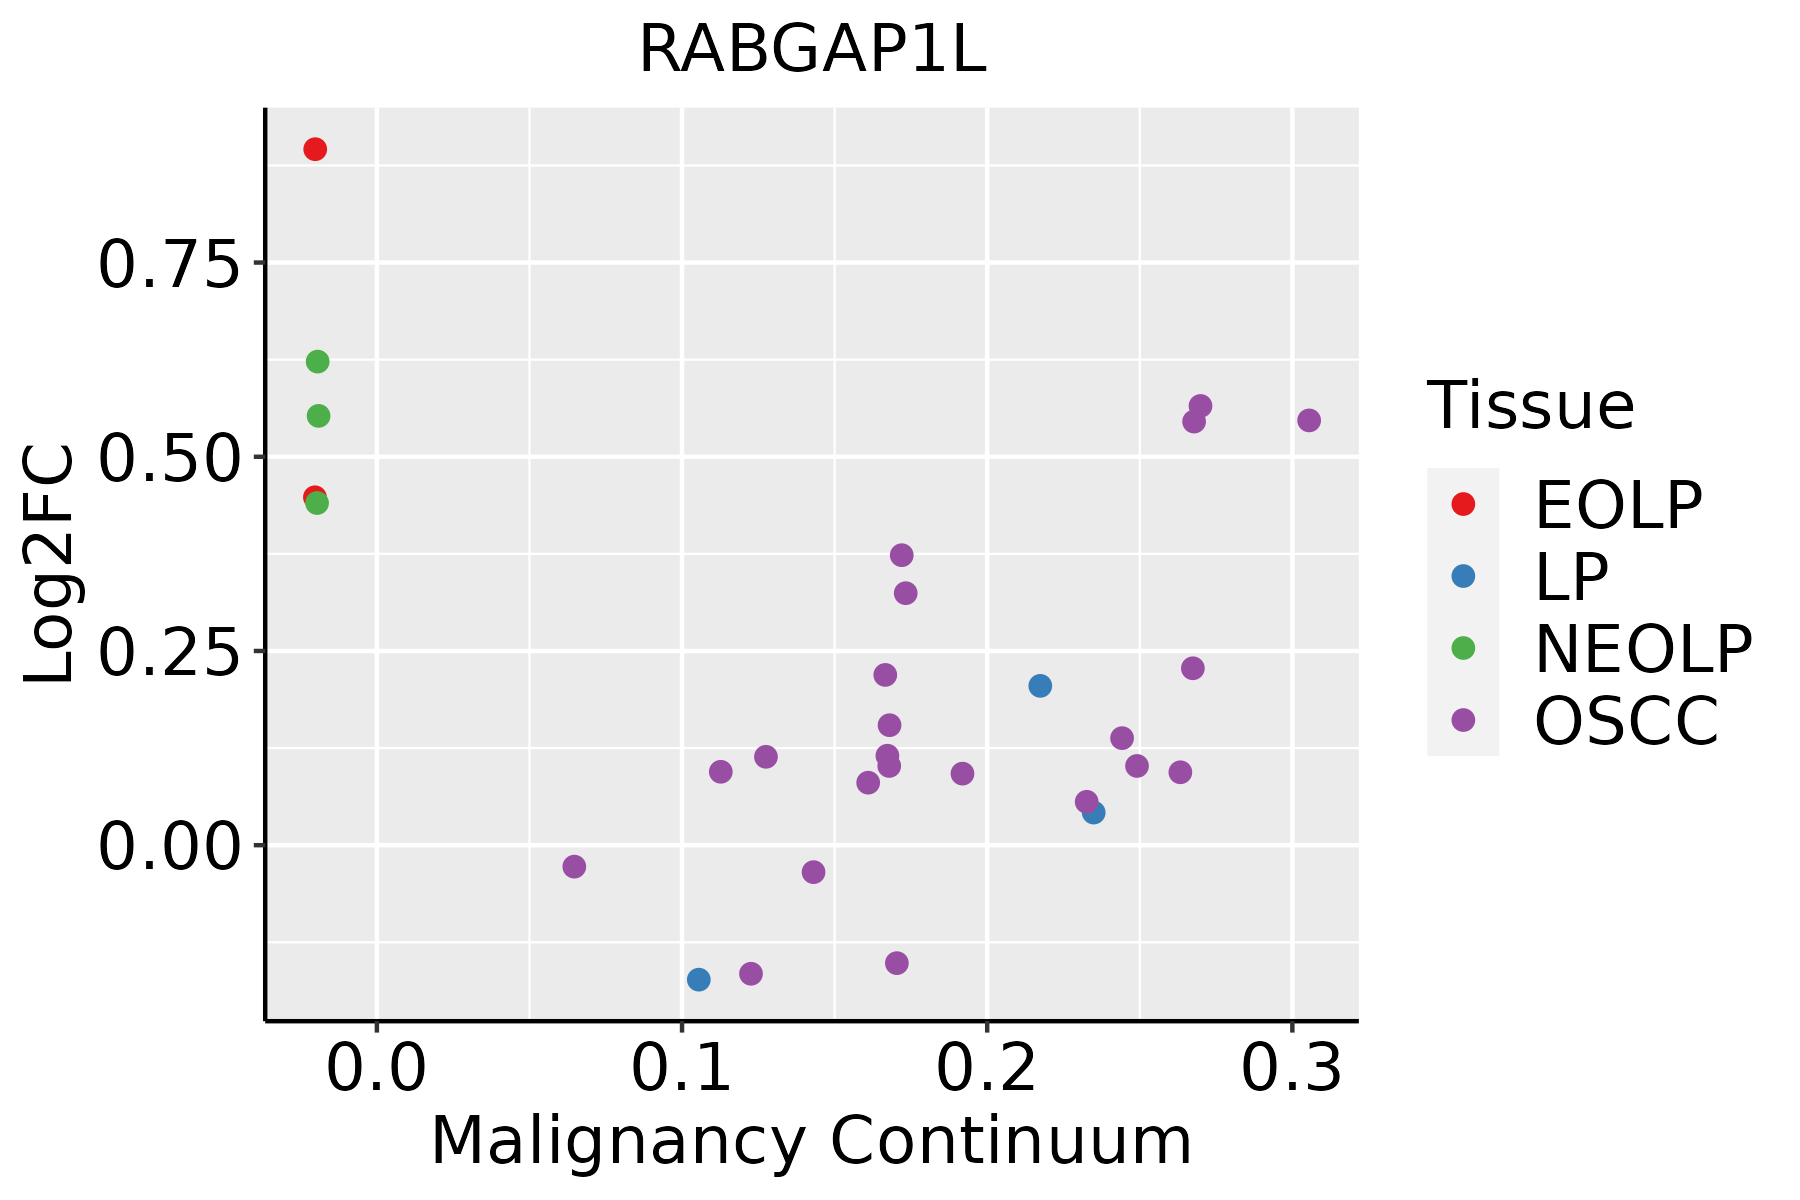
EOLP: Erosive Oral lichen planus
LP: leukoplakia
NEOLP: Non-erosive oral lichen planus
OSCC: Oral squamous cell carcinoma
ProstateThe image shows the transcriptomic changes along malignancy continuum.log2FC in expression of this searched gene in stem-like cells from each diseased tissue sample relative to stem-like cells in normal samples in each tissue plotted against the malignancy continuum. Samples are colored based on if they are from different disease stage.
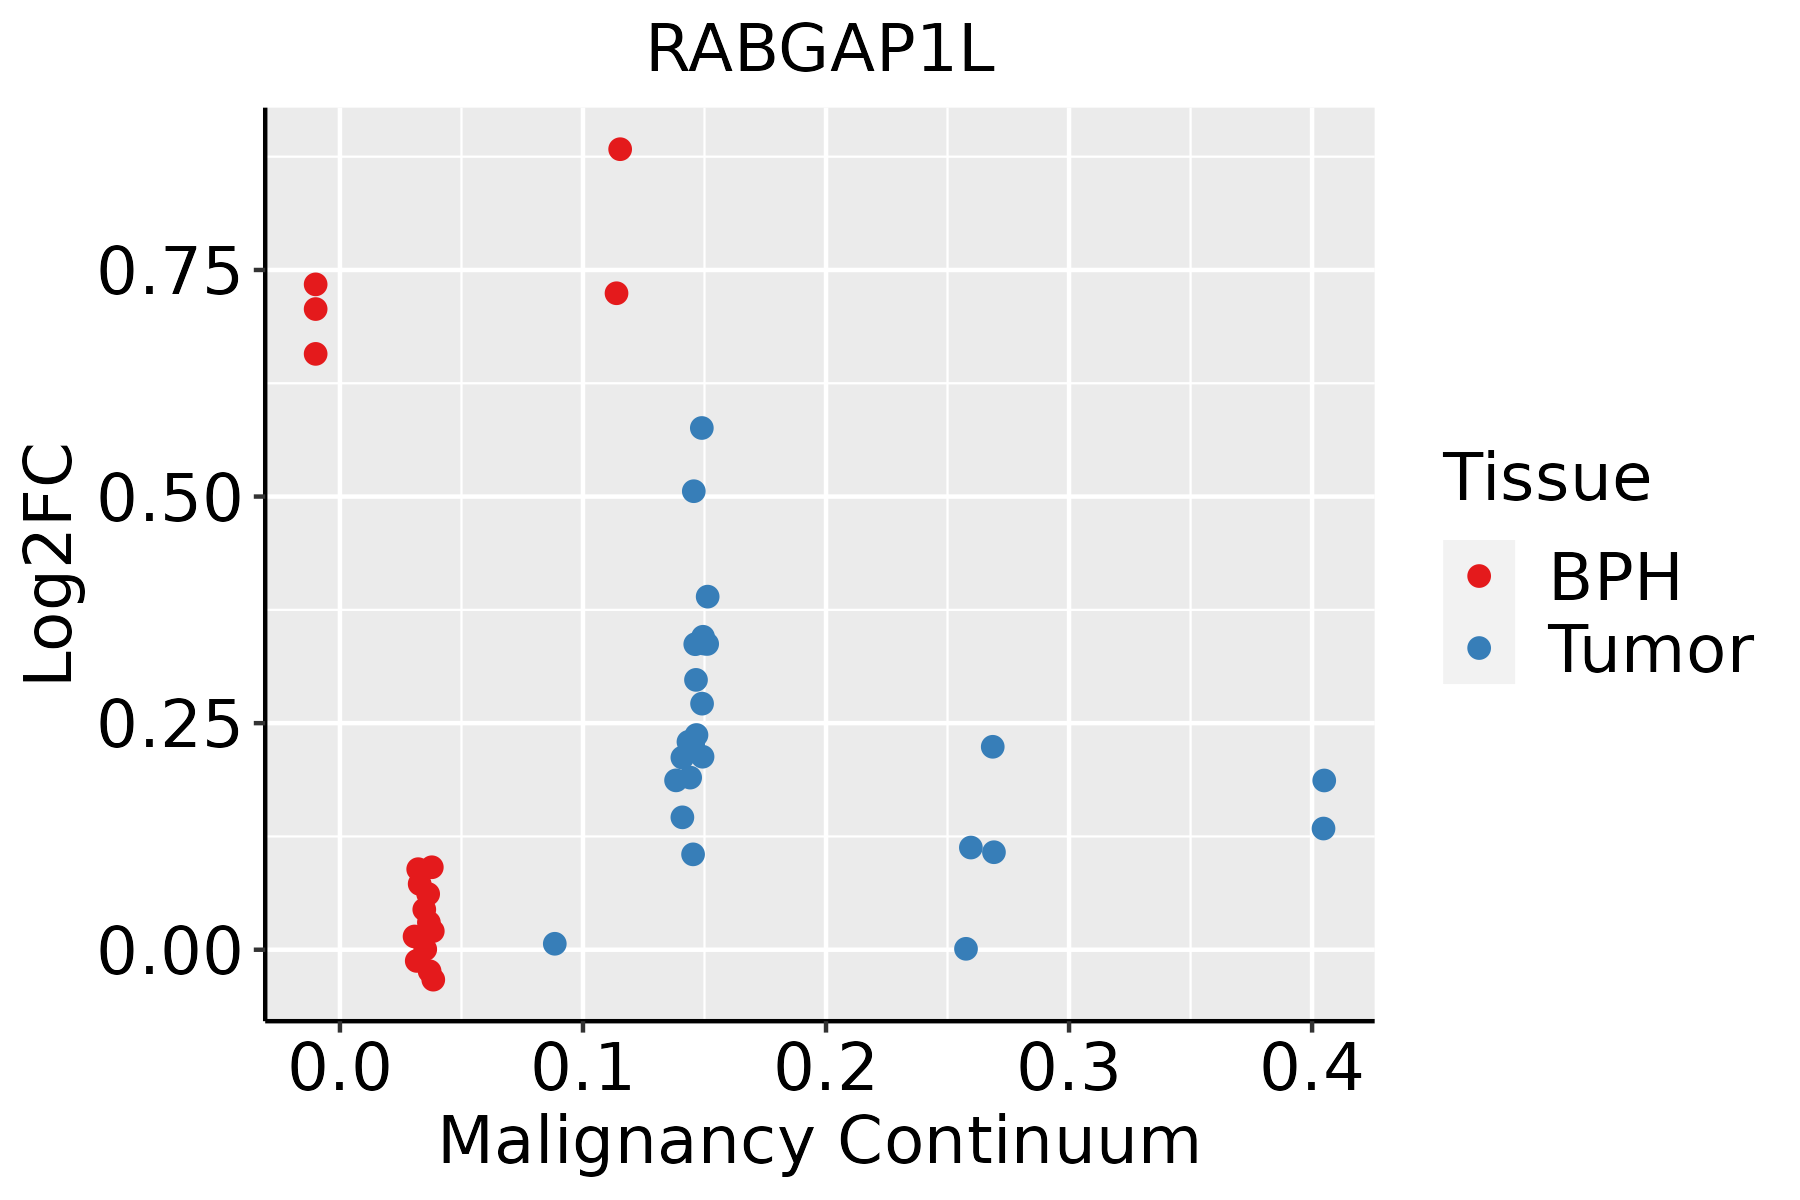
BPH: Benign Prostatic Hyperplasia
SkinThe image shows the transcriptomic changes along malignancy continuum.log2FC in expression of this searched gene in stem-like cells from each diseased tissue sample relative to stem-like cells in normal samples in each tissue plotted against the malignancy continuum. Samples are colored based on if they are from different disease stage.
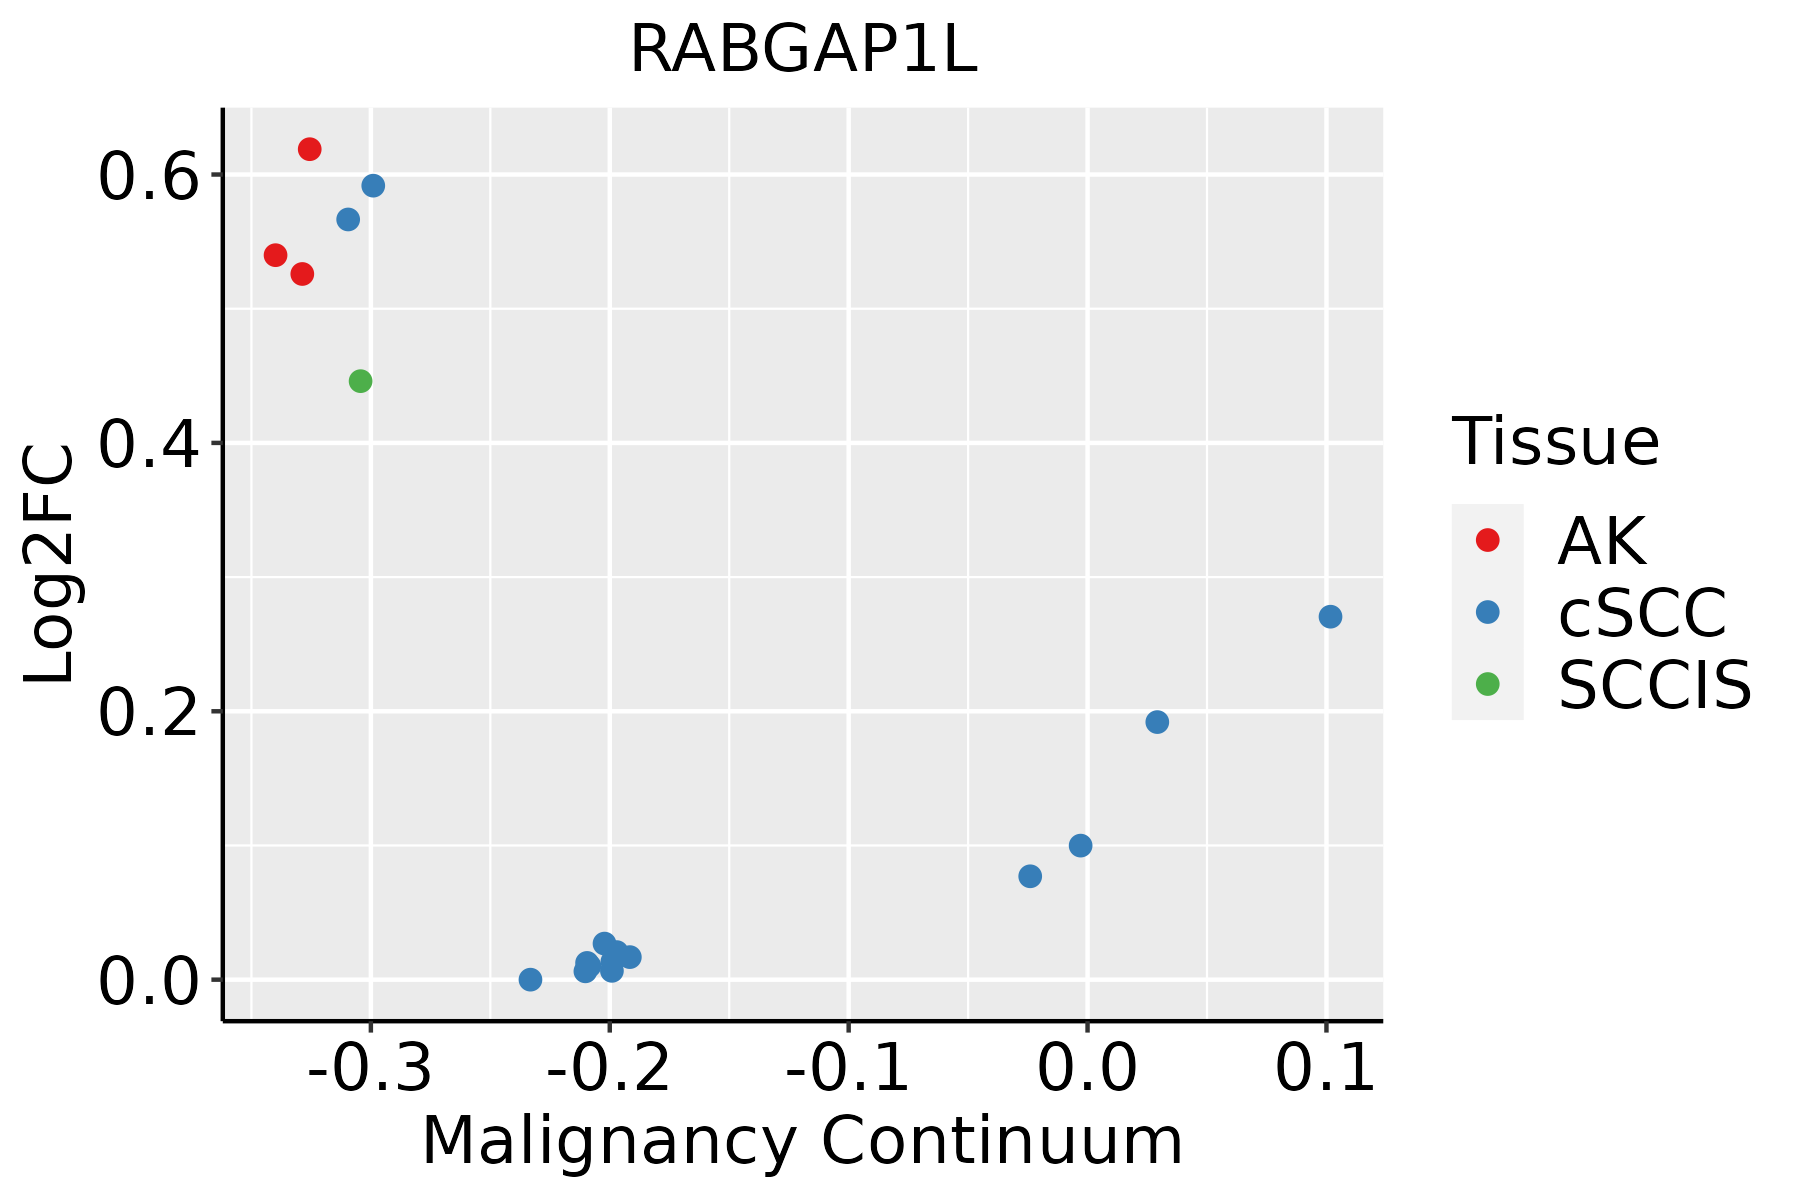
AK: Actinic keratosis
cSCC: Cutaneous squamous cell carcinoma
SCCIS:squamous cell carcinoma in situ
∗log2FC in expression of this searched gene in stem-like cells from each diseased tissue sample relative to stem-like cells in normal samples in each tissue plotted against the malignancy continuum. Samples are colored based on if they are from different disease stage.

Top

Malignant transformation related pathway analysis

check buttonFind out the enriched GO biological processes and KEGG pathways involved in transition from healthy to precancer to cancer
check button Figure of enriched GO biological processes.
TissueDisease StageEnriched GO biological Processes
ColorectumADGO analysis - Figure of enriched GO biological processes: Top 15 enriched GO BP terms are showed in the bar plot of each disease state in each tissue. Each row represents a significant GO biological process which is colored according to the -log10(p.adjust).
ColorectumSERGO analysis - Figure of enriched GO biological processes: Top 15 enriched GO BP terms are showed in the bar plot of each disease state in each tissue. Each row represents a significant GO biological process which is colored according to the -log10(p.adjust).
ColorectumMSSGO analysis - Figure of enriched GO biological processes: Top 15 enriched GO BP terms are showed in the bar plot of each disease state in each tissue. Each row represents a significant GO biological process which is colored according to the -log10(p.adjust).
ColorectumMSI-HGO analysis - Figure of enriched GO biological processes: Top 15 enriched GO BP terms are showed in the bar plot of each disease state in each tissue. Each row represents a significant GO biological process which is colored according to the -log10(p.adjust).
ColorectumFAPGO analysis - Figure of enriched GO biological processes: Top 15 enriched GO BP terms are showed in the bar plot of each disease state in each tissue. Each row represents a significant GO biological process which is colored according to the -log10(p.adjust).
∗Top 15 enriched GO BP terms are showed in the bar plot of each disease state in each tissue. Each row represents a significant GO biological process which is colored according to the -log10(p.adjust).
Page: 1 2 3 4 5 6 7 8 9 

check button Enriched GO biological processes.
GO IDTissueDisease StageDescriptionGene RatioBg Ratiopvaluep.adjustCount
GO:00430877CervixCCregulation of GTPase activity79/2311348/187234.21e-082.60e-0679
GO:00435476CervixCCpositive regulation of GTPase activity53/2311255/187238.72e-051.16e-0353
GO:0043087ColorectumADregulation of GTPase activity110/3918348/187231.64e-065.03e-05110
GO:0043547ColorectumADpositive regulation of GTPase activity75/3918255/187237.95e-047.91e-0375
GO:00430871ColorectumSERregulation of GTPase activity77/2897348/187235.90e-048.07e-0377
GO:00430872ColorectumMSSregulation of GTPase activity101/3467348/187231.00e-063.46e-05101
GO:00435471ColorectumMSSpositive regulation of GTPase activity68/3467255/187237.97e-048.38e-0368
GO:00430873ColorectumFAPregulation of GTPase activity85/2622348/187231.20e-077.68e-0685
GO:00435472ColorectumFAPpositive regulation of GTPase activity61/2622255/187231.39e-053.73e-0461
GO:0090630ColorectumFAPactivation of GTPase activity27/2622115/187234.23e-032.90e-0227
GO:00430874ColorectumCRCregulation of GTPase activity69/2078348/187231.11e-066.69e-0569
GO:00435473ColorectumCRCpositive regulation of GTPase activity49/2078255/187238.67e-051.77e-0349
GO:00430878EndometriumAEHregulation of GTPase activity66/2100348/187231.26e-052.77e-0466
GO:00435477EndometriumAEHpositive regulation of GTPase activity48/2100255/187232.18e-042.67e-0348
GO:00906304EndometriumAEHactivation of GTPase activity22/2100115/187238.42e-034.60e-0222
GO:004308712EndometriumEECregulation of GTPase activity67/2168348/187231.84e-053.43e-0467
GO:004354712EndometriumEECpositive regulation of GTPase activity50/2168255/187231.26e-041.66e-0350
GO:009063012EndometriumEECactivation of GTPase activity23/2168115/187236.04e-033.57e-0223
GO:004308715EsophagusESCCregulation of GTPase activity183/8552348/187235.34e-032.00e-02183
GO:00430875LiverNAFLDregulation of GTPase activity62/1882348/187235.65e-062.03e-0462
Page: 1 2 3 

check button Enriched KEGG pathways.
Pathway IDTissueDisease StageDescriptionGene RatioBg Ratiopvaluep.adjustqvalueCount
Page: 1 

Top

Cell-cell communication analysis

check buttonIdentification of potential cell-cell interactions between two cell types and their ligand-receptor pairs for different disease states
LigandReceptorLRpairPathwayTissueDisease Stage
Page: 1 

Top

Single-cell gene regulatory network inference analysis

check buttonFind out the significant the regulons (TFs) and the target genes of each regulon across cell types for different disease states
TFCell TypeTissueDisease StageTarget GeneRSSRegulon Activity
∗The dot plots of a searched regulon are shown for all cell subpopulations in each disease state of each tissue based on the regulon specific score inferred using pySCENIC and by calculating the average expression.
Page: 1 

Top

Somatic mutation of malignant transformation related genes

check buttonAnnotation of somatic variants for genes involved in malignant transformation
Hugo SymbolVariant ClassVariant ClassificationdbSNP RSHGVScHGVSpHGVSp ShortSWISSPROTBIOTYPESIFTPolyPhenTumor Sample BarcodeTissueHistologySexAgeStageTherapy TypesDrugsOutcome
RABGAP1LSNVMissense_Mutationc.536N>Ap.Ser179Tyrp.S179YQ5R372protein_codingtolerated(0.47)possibly_damaging(0.703)TCGA-A8-A07U-01Breastbreast invasive carcinomaFemale>=65III/IVChemotherapy5-fluorouracilSD
RABGAP1LSNVMissense_Mutationnovelc.56C>Ap.Thr19Lysp.T19KQ5R372protein_codingdeleterious(0)benign(0.196)TCGA-A8-A095-01Breastbreast invasive carcinomaFemale<65I/IIChemotherapy5-fluorouracilCR
RABGAP1LSNVMissense_Mutationc.1144G>Cp.Glu382Glnp.E382QQ5R372protein_codingdeleterious(0.01)probably_damaging(0.982)TCGA-AC-A23H-01Breastbreast invasive carcinomaFemale>=65I/IIUnknownUnknownPD
RABGAP1LSNVMissense_Mutationnovelc.871T>Ap.Phe291Ilep.F291IQ5R372protein_codingdeleterious(0)probably_damaging(0.924)TCGA-AC-A3QQ-01Breastbreast invasive carcinomaFemale<65I/IIUnknownUnknownSD
RABGAP1LSNVMissense_Mutationnovelc.1154A>Gp.Lys385Argp.K385RQ5R372protein_codingtolerated(0.22)probably_damaging(1)TCGA-AR-A5QN-01Breastbreast invasive carcinomaFemale>=65III/IVChemotherapytaxotereSD
RABGAP1LSNVMissense_Mutationnovelc.56N>Ap.Thr19Lysp.T19KQ5R372protein_codingdeleterious(0)benign(0.196)TCGA-B6-A1KF-01Breastbreast invasive carcinomaFemale>=65I/IIUnknownUnknownSD
RABGAP1LSNVMissense_Mutationc.872N>Cp.Phe291Serp.F291SQ5R372protein_codingdeleterious(0)probably_damaging(0.944)TCGA-D8-A1XK-01Breastbreast invasive carcinomaFemale<65I/IIChemotherapydoxorubicine+cyclophosphamideSD
RABGAP1LinsertionNonsense_Mutationnovelc.1152_1153insTCATAGCTCTTTCCCATGGATTCCTATp.Pro384_Lys385insSerTerLeuPheProMetAspSerTyrp.P384_K385insS*LFPMDSYQ5R372protein_codingTCGA-A2-A0CX-01Breastbreast invasive carcinomaFemale<65I/IIChemotherapyadriamycinSD
RABGAP1LinsertionIn_Frame_Insnovelc.869_870insTACp.Asn290_Phe291insThrp.N290_F291insTQ5R372protein_codingTCGA-AC-A3QQ-01Breastbreast invasive carcinomaFemale<65I/IIUnknownUnknownSD
RABGAP1LinsertionFrame_Shift_Insnovelc.634_635insCAGACTGGGACAGACTGCCTCCTCAAGTGGGTCCCCCp.Ser212ThrfsTer36p.S212Tfs*36Q5R372protein_codingTCGA-AO-A124-01Breastbreast invasive carcinomaFemale<65I/IIChemotherapydoxorubicinSD
Page: 1 2 3 4 5 6 7 8 9 10 11 12 

Top

Related drugs of malignant transformation related genes

check buttonIdentification of chemicals and drugs interact with genes involved in malignant transfromation
(DGIdb 4.0)
Entrez IDSymbolCategoryInteraction TypesDrug Claim NameDrug NamePMIDs
9910RABGAP1LNAethanolALCOHOL
Page: 1