
|
|||||
|
 | |
| |
| |
| |
| |
| |
|
Gene: RAB5IF |
Gene summary for RAB5IF |
| Gene information | Species | Human | Gene symbol | RAB5IF | Gene ID | 55969 |
| Gene name | RAB5 interacting factor | |
| Gene Alias | C20orf24 | |
| Cytomap | 20q11.23 | |
| Gene Type | protein-coding | GO ID | GO:0006996 | UniProtAcc | Q9BUV8 |
Top |
Malignant transformation analysis |
| Identification of the aberrant gene expression in precancerous and cancerous lesions by comparing the gene expression of stem-like cells in diseased tissues with normal stem cells |
| Entrez ID | Symbol | Replicates | Species | Organ | Tissue | Adj P-value | Log2FC | Malignancy |
| 55969 | RAB5IF | GSM5353244_PA_PR5261_T2_S24_L002 | Human | Prostate | Tumor | 4.75e-08 | -3.76e-01 | 0.1569 |
| 55969 | RAB5IF | P1_S1_AK | Human | Skin | AK | 3.06e-08 | 2.89e-01 | -0.3399 |
| 55969 | RAB5IF | P2_S3_AK | Human | Skin | AK | 8.50e-07 | 2.92e-01 | -0.3287 |
| 55969 | RAB5IF | P2_S4_SCCIS | Human | Skin | SCCIS | 1.73e-04 | 3.40e-01 | -0.3043 |
| 55969 | RAB5IF | P3_S6_AK | Human | Skin | AK | 3.33e-02 | 2.33e-01 | -0.3256 |
| 55969 | RAB5IF | P4_S8_cSCC | Human | Skin | cSCC | 8.13e-18 | 4.23e-01 | -0.3095 |
| 55969 | RAB5IF | P5_S10_cSCC | Human | Skin | cSCC | 2.27e-51 | 7.10e-01 | -0.299 |
| 55969 | RAB5IF | P2_cSCC | Human | Skin | cSCC | 1.35e-04 | -1.76e-01 | -0.024 |
| 55969 | RAB5IF | P4_cSCC | Human | Skin | cSCC | 8.47e-03 | -1.76e-01 | -0.00290000000000005 |
| 55969 | RAB5IF | P10_cSCC | Human | Skin | cSCC | 2.57e-03 | -1.76e-01 | 0.1017 |
| 55969 | RAB5IF | cSCC_p1 | Human | Skin | cSCC | 1.79e-02 | -1.76e-01 | -0.1916 |
| 55969 | RAB5IF | cSCC_p10 | Human | Skin | cSCC | 1.79e-02 | -1.76e-01 | -0.2095 |
| 55969 | RAB5IF | cSCC_p11 | Human | Skin | cSCC | 4.01e-03 | -1.76e-01 | -0.2102 |
| 55969 | RAB5IF | cSCC_p3 | Human | Skin | cSCC | 1.79e-02 | -1.76e-01 | -0.2085 |
| 55969 | RAB5IF | cSCC_p4 | Human | Skin | cSCC | 8.47e-03 | -1.76e-01 | -0.2022 |
| 55969 | RAB5IF | cSCC_p6 | Human | Skin | cSCC | 8.97e-04 | -1.76e-01 | -0.1989 |
| 55969 | RAB5IF | cSCC_p7 | Human | Skin | cSCC | 8.47e-03 | -1.76e-01 | -0.2332 |
| 55969 | RAB5IF | cSCC_p8 | Human | Skin | cSCC | 4.01e-03 | -1.76e-01 | -0.1971 |
| 55969 | RAB5IF | cSCC_p9 | Human | Skin | cSCC | 4.01e-03 | -1.76e-01 | -0.1991 |
| 55969 | RAB5IF | Pat01-B | Human | Stomach | GC | 3.58e-45 | 7.46e-01 | 0.5754 |
| Page: 1 2 3 4 5 6 |
| Tissue | Expression Dynamics | Abbreviation |
| Breast | 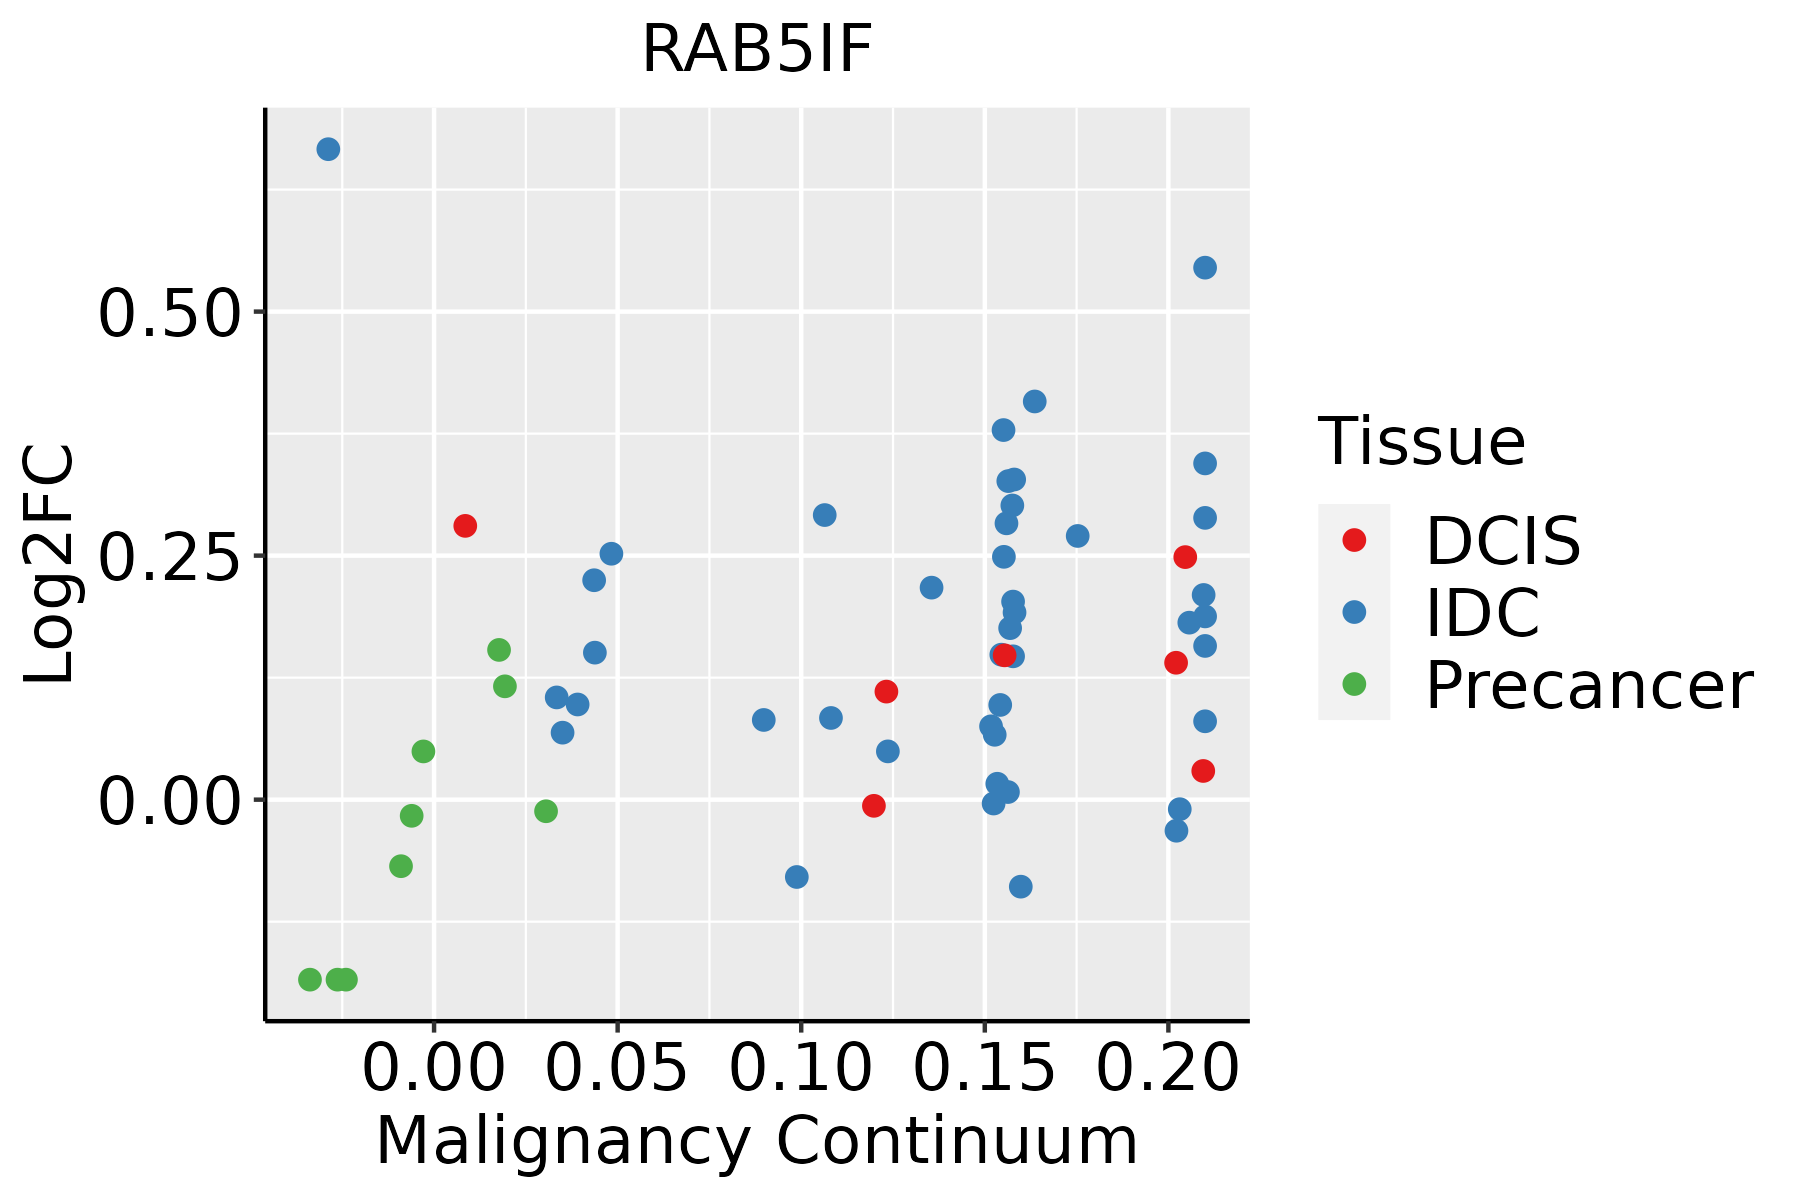 | IDC: Invasive ductal carcinoma |
| DCIS: Ductal carcinoma in situ | ||
| Precancer(BRCA1-mut): Precancerous lesion from BRCA1 mutation carriers | ||
| Esophagus | 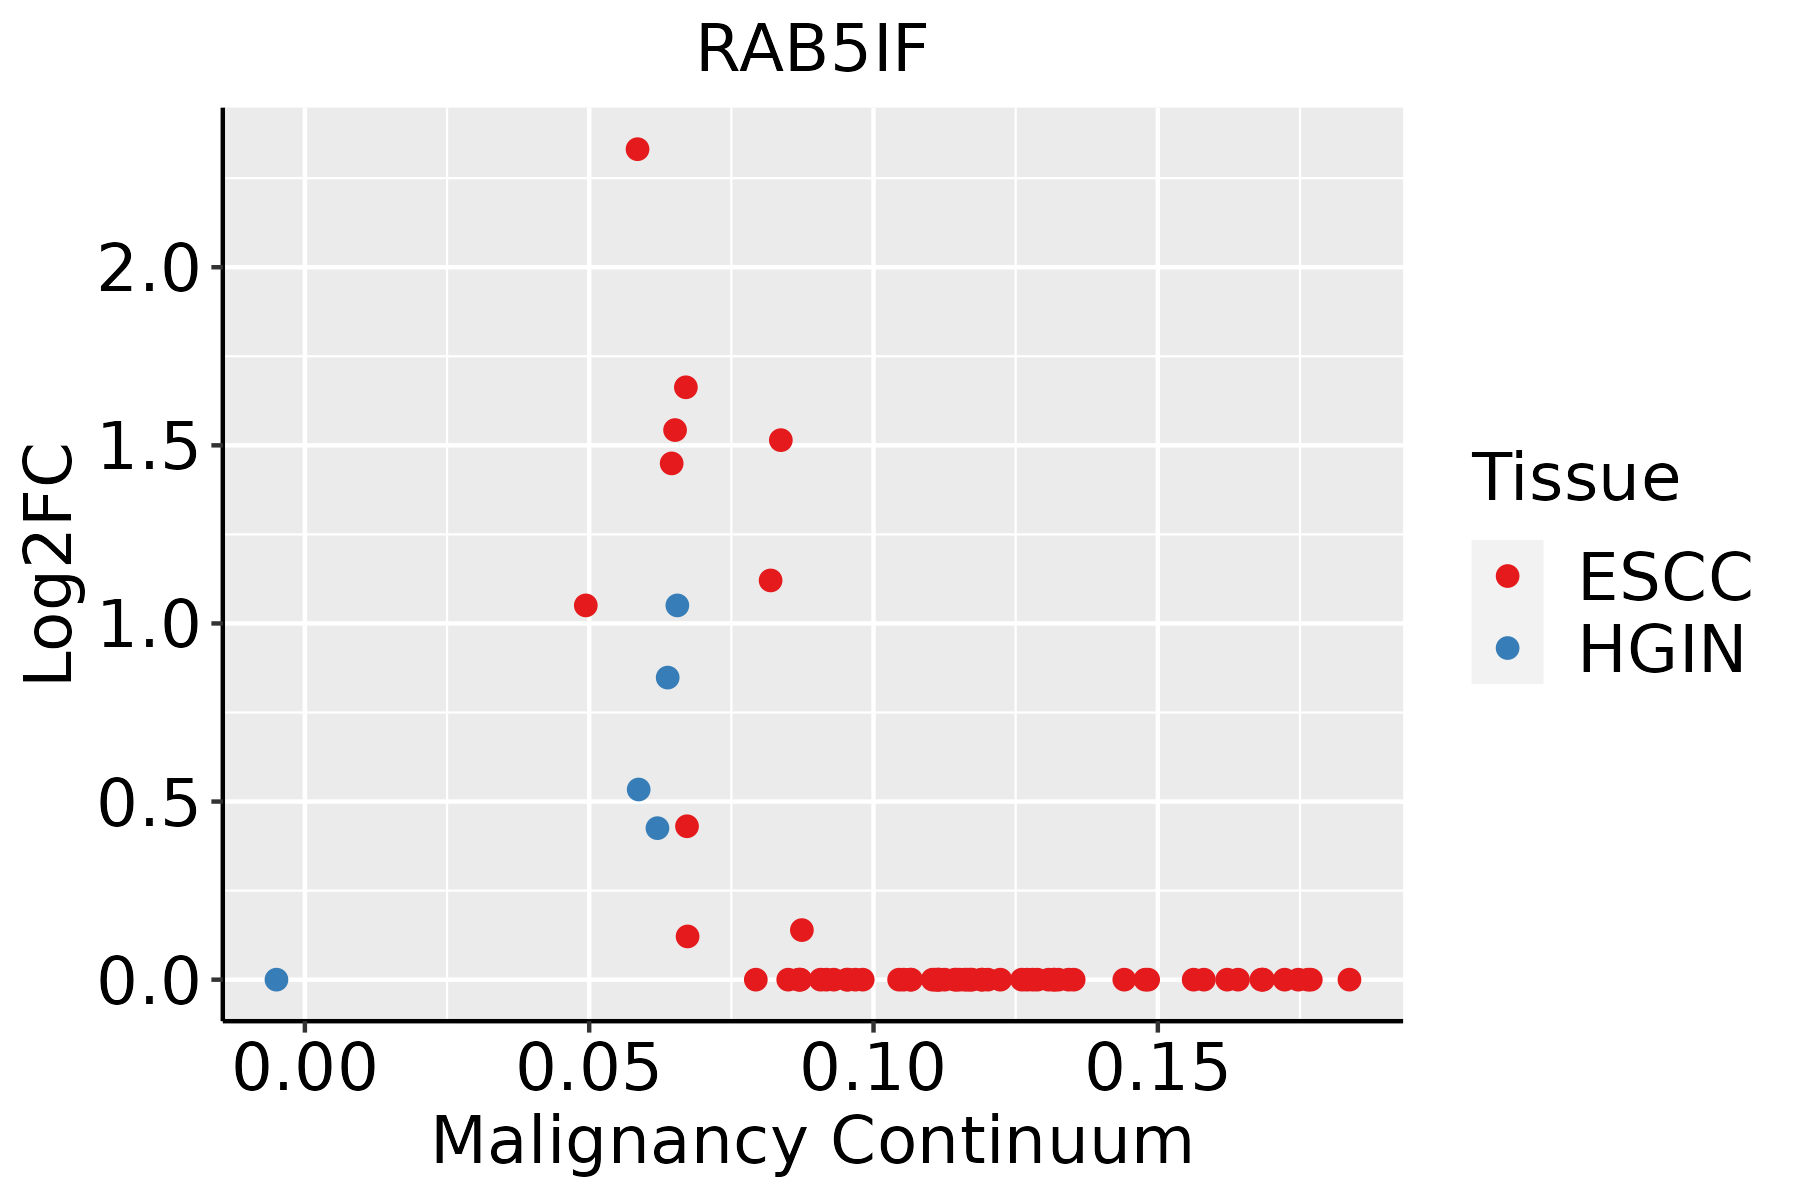 | ESCC: Esophageal squamous cell carcinoma |
| HGIN: High-grade intraepithelial neoplasias | ||
| LGIN: Low-grade intraepithelial neoplasias | ||
| GC |  | CAG: Chronic atrophic gastritis |
| CAG with IM: Chronic atrophic gastritis with intestinal metaplasia | ||
| CSG: Chronic superficial gastritis | ||
| GC: Gastric cancer | ||
| SIM: Severe intestinal metaplasia | ||
| WIM: Wild intestinal metaplasia | ||
| Liver |  | HCC: Hepatocellular carcinoma |
| NAFLD: Non-alcoholic fatty liver disease | ||
| Prostate | 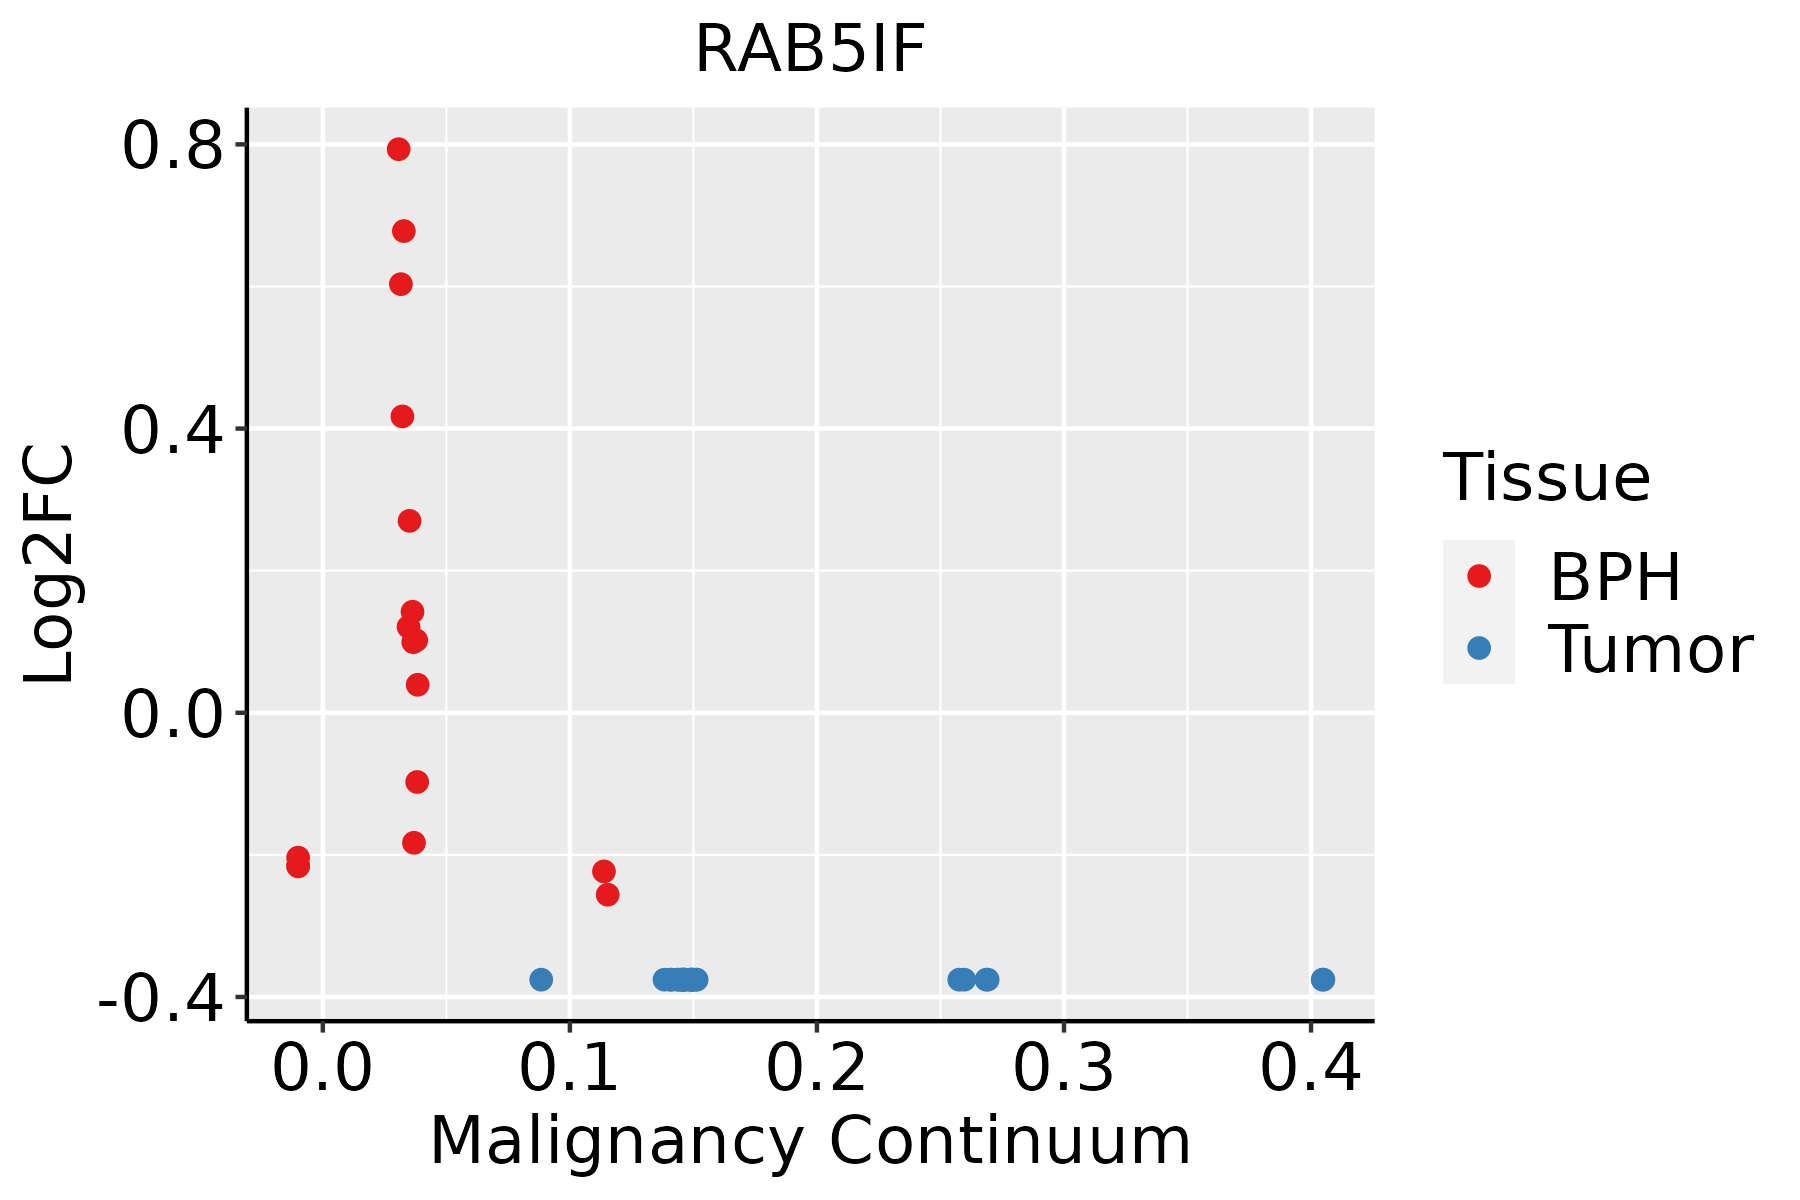 | BPH: Benign Prostatic Hyperplasia |
| Skin |  | AK: Actinic keratosis |
| cSCC: Cutaneous squamous cell carcinoma | ||
| SCCIS:squamous cell carcinoma in situ | ||
| Thyroid | 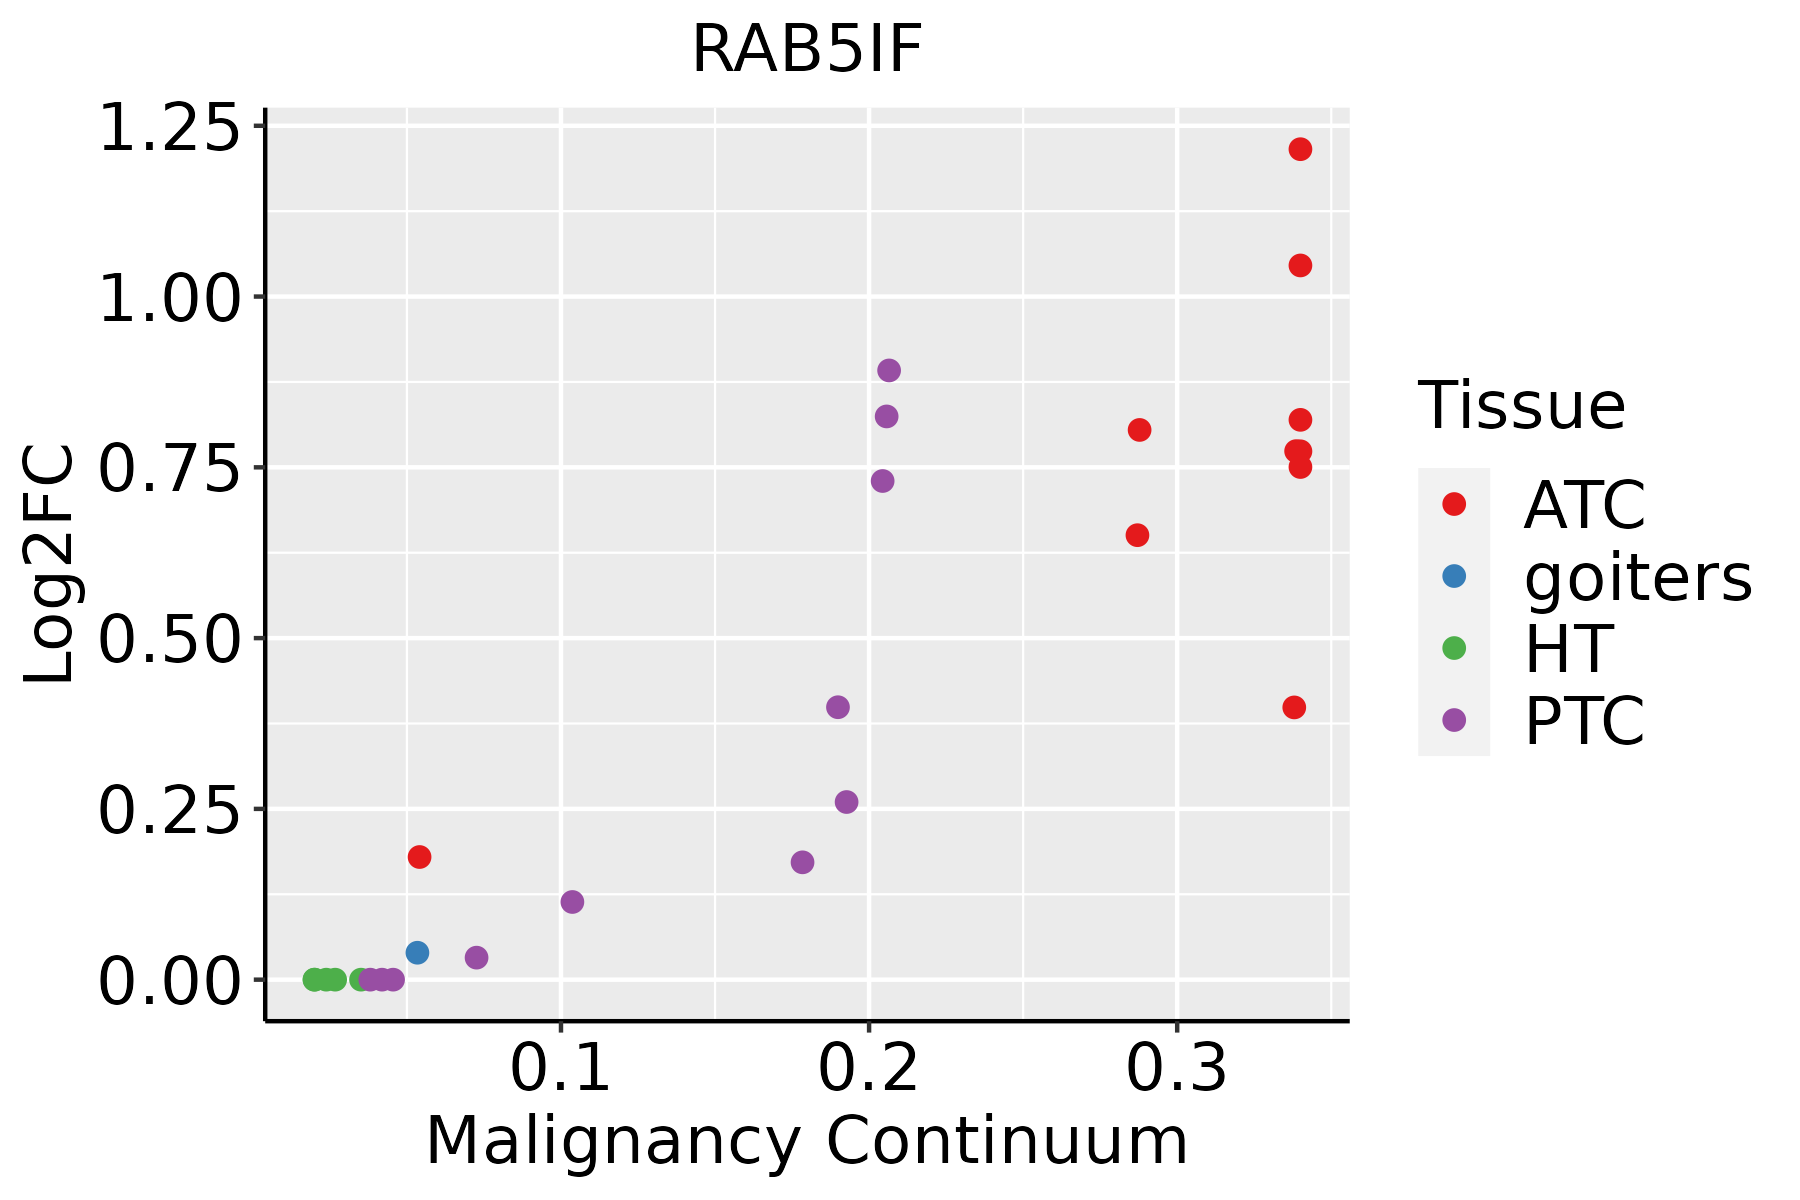 | ATC: Anaplastic thyroid cancer |
| HT: Hashimoto's thyroiditis | ||
| PTC: Papillary thyroid cancer |
| ∗log2FC in expression of this searched gene in stem-like cells from each diseased tissue sample relative to stem-like cells in normal samples in each tissue plotted against the malignancy continuum. Samples are colored based on if they are from different disease stage. |
Top |
Malignant transformation related pathway analysis |
| Find out the enriched GO biological processes and KEGG pathways involved in transition from healthy to precancer to cancer |
| Tissue | Disease Stage | Enriched GO biological Processes |
| Colorectum | AD |  |
| Colorectum | SER |  |
| Colorectum | MSS |  |
| Colorectum | MSI-H |  |
| Colorectum | FAP |  |
| ∗Top 15 enriched GO BP terms are showed in the bar plot of each disease state in each tissue. Each row represents a significant GO biological process which is colored according to the -log10(p.adjust). |
| Page: 1 2 3 4 5 6 7 8 9 |
| GO ID | Tissue | Disease Stage | Description | Gene Ratio | Bg Ratio | pvalue | p.adjust | Count |
| GO:0097250 | Stomach | GC | mitochondrial respirasome assembly | 4/1159 | 10/18723 | 2.27e-03 | 2.20e-02 | 4 |
| GO:00972501 | Stomach | CAG with IM | mitochondrial respirasome assembly | 4/1050 | 10/18723 | 1.57e-03 | 1.75e-02 | 4 |
| GO:00972502 | Stomach | CSG | mitochondrial respirasome assembly | 4/1034 | 10/18723 | 1.48e-03 | 1.68e-02 | 4 |
| Page: 1 |
| Pathway ID | Tissue | Disease Stage | Description | Gene Ratio | Bg Ratio | pvalue | p.adjust | qvalue | Count |
| Page: 1 |
Top |
Cell-cell communication analysis |
| Identification of potential cell-cell interactions between two cell types and their ligand-receptor pairs for different disease states |
| Ligand | Receptor | LRpair | Pathway | Tissue | Disease Stage |
| Page: 1 |
Top |
Single-cell gene regulatory network inference analysis |
| Find out the significant the regulons (TFs) and the target genes of each regulon across cell types for different disease states |
| TF | Cell Type | Tissue | Disease Stage | Target Gene | RSS | Regulon Activity |
| ∗The dot plots of a searched regulon are shown for all cell subpopulations in each disease state of each tissue based on the regulon specific score inferred using pySCENIC and by calculating the average expression. |
| Page: 1 |
Top |
Somatic mutation of malignant transformation related genes |
| Annotation of somatic variants for genes involved in malignant transformation |
| Hugo Symbol | Variant Class | Variant Classification | dbSNP RS | HGVSc | HGVSp | HGVSp Short | SWISSPROT | BIOTYPE | SIFT | PolyPhen | Tumor Sample Barcode | Tissue | Histology | Sex | Age | Stage | Therapy Types | Drugs | Outcome |
| Page: 1 |
Top |
Related drugs of malignant transformation related genes |
| Identification of chemicals and drugs interact with genes involved in malignant transfromation |
| (DGIdb 4.0) |
| Entrez ID | Symbol | Category | Interaction Types | Drug Claim Name | Drug Name | PMIDs |
| Page: 1 |

Copyright 2023-Present -The University of Texas Health Science Center at Houston |