
|
|||||
|
 | |
| |
| |
| |
| |
| |
|
Gene: PTRHD1 |
Gene summary for PTRHD1 |
| Gene information | Species | Human | Gene symbol | PTRHD1 | Gene ID | 391356 |
| Gene name | peptidyl-tRNA hydrolase domain containing 1 | |
| Gene Alias | C2orf79 | |
| Cytomap | 2p23.3 | |
| Gene Type | protein-coding | GO ID | GO:0003674 | UniProtAcc | Q6GMV3 |
Top |
Malignant transformation analysis |
| Identification of the aberrant gene expression in precancerous and cancerous lesions by comparing the gene expression of stem-like cells in diseased tissues with normal stem cells |
| Entrez ID | Symbol | Replicates | Species | Organ | Tissue | Adj P-value | Log2FC | Malignancy |
| 391356 | PTRHD1 | P26T-E | Human | Esophagus | ESCC | 2.03e-85 | 1.78e+00 | 0.1276 |
| 391356 | PTRHD1 | P27T-E | Human | Esophagus | ESCC | 3.52e-65 | 1.47e+00 | 0.1055 |
| 391356 | PTRHD1 | P28T-E | Human | Esophagus | ESCC | 5.92e-32 | 8.42e-01 | 0.1149 |
| 391356 | PTRHD1 | P30T-E | Human | Esophagus | ESCC | 1.05e-38 | 1.46e+00 | 0.137 |
| 391356 | PTRHD1 | P31T-E | Human | Esophagus | ESCC | 1.52e-29 | 6.10e-01 | 0.1251 |
| 391356 | PTRHD1 | P32T-E | Human | Esophagus | ESCC | 1.61e-31 | 7.40e-01 | 0.1666 |
| 391356 | PTRHD1 | P36T-E | Human | Esophagus | ESCC | 8.02e-17 | 6.29e-01 | 0.1187 |
| 391356 | PTRHD1 | P37T-E | Human | Esophagus | ESCC | 2.83e-28 | 7.24e-01 | 0.1371 |
| 391356 | PTRHD1 | P38T-E | Human | Esophagus | ESCC | 9.94e-16 | 8.39e-01 | 0.127 |
| 391356 | PTRHD1 | P39T-E | Human | Esophagus | ESCC | 6.25e-17 | 4.98e-01 | 0.0894 |
| 391356 | PTRHD1 | P40T-E | Human | Esophagus | ESCC | 2.38e-18 | 6.11e-01 | 0.109 |
| 391356 | PTRHD1 | P42T-E | Human | Esophagus | ESCC | 2.96e-24 | 5.25e-01 | 0.1175 |
| 391356 | PTRHD1 | P44T-E | Human | Esophagus | ESCC | 1.87e-15 | 5.94e-01 | 0.1096 |
| 391356 | PTRHD1 | P47T-E | Human | Esophagus | ESCC | 2.05e-18 | 4.96e-01 | 0.1067 |
| 391356 | PTRHD1 | P48T-E | Human | Esophagus | ESCC | 1.69e-26 | 7.90e-01 | 0.0959 |
| 391356 | PTRHD1 | P49T-E | Human | Esophagus | ESCC | 2.95e-10 | 1.37e+00 | 0.1768 |
| 391356 | PTRHD1 | P52T-E | Human | Esophagus | ESCC | 1.25e-39 | 1.11e+00 | 0.1555 |
| 391356 | PTRHD1 | P54T-E | Human | Esophagus | ESCC | 5.01e-39 | 1.22e+00 | 0.0975 |
| 391356 | PTRHD1 | P56T-E | Human | Esophagus | ESCC | 3.23e-09 | 1.49e+00 | 0.1613 |
| 391356 | PTRHD1 | P57T-E | Human | Esophagus | ESCC | 2.36e-25 | 6.63e-01 | 0.0926 |
| Page: 1 2 3 4 5 6 7 8 9 10 |
| Tissue | Expression Dynamics | Abbreviation |
| Colorectum (GSE201348) | 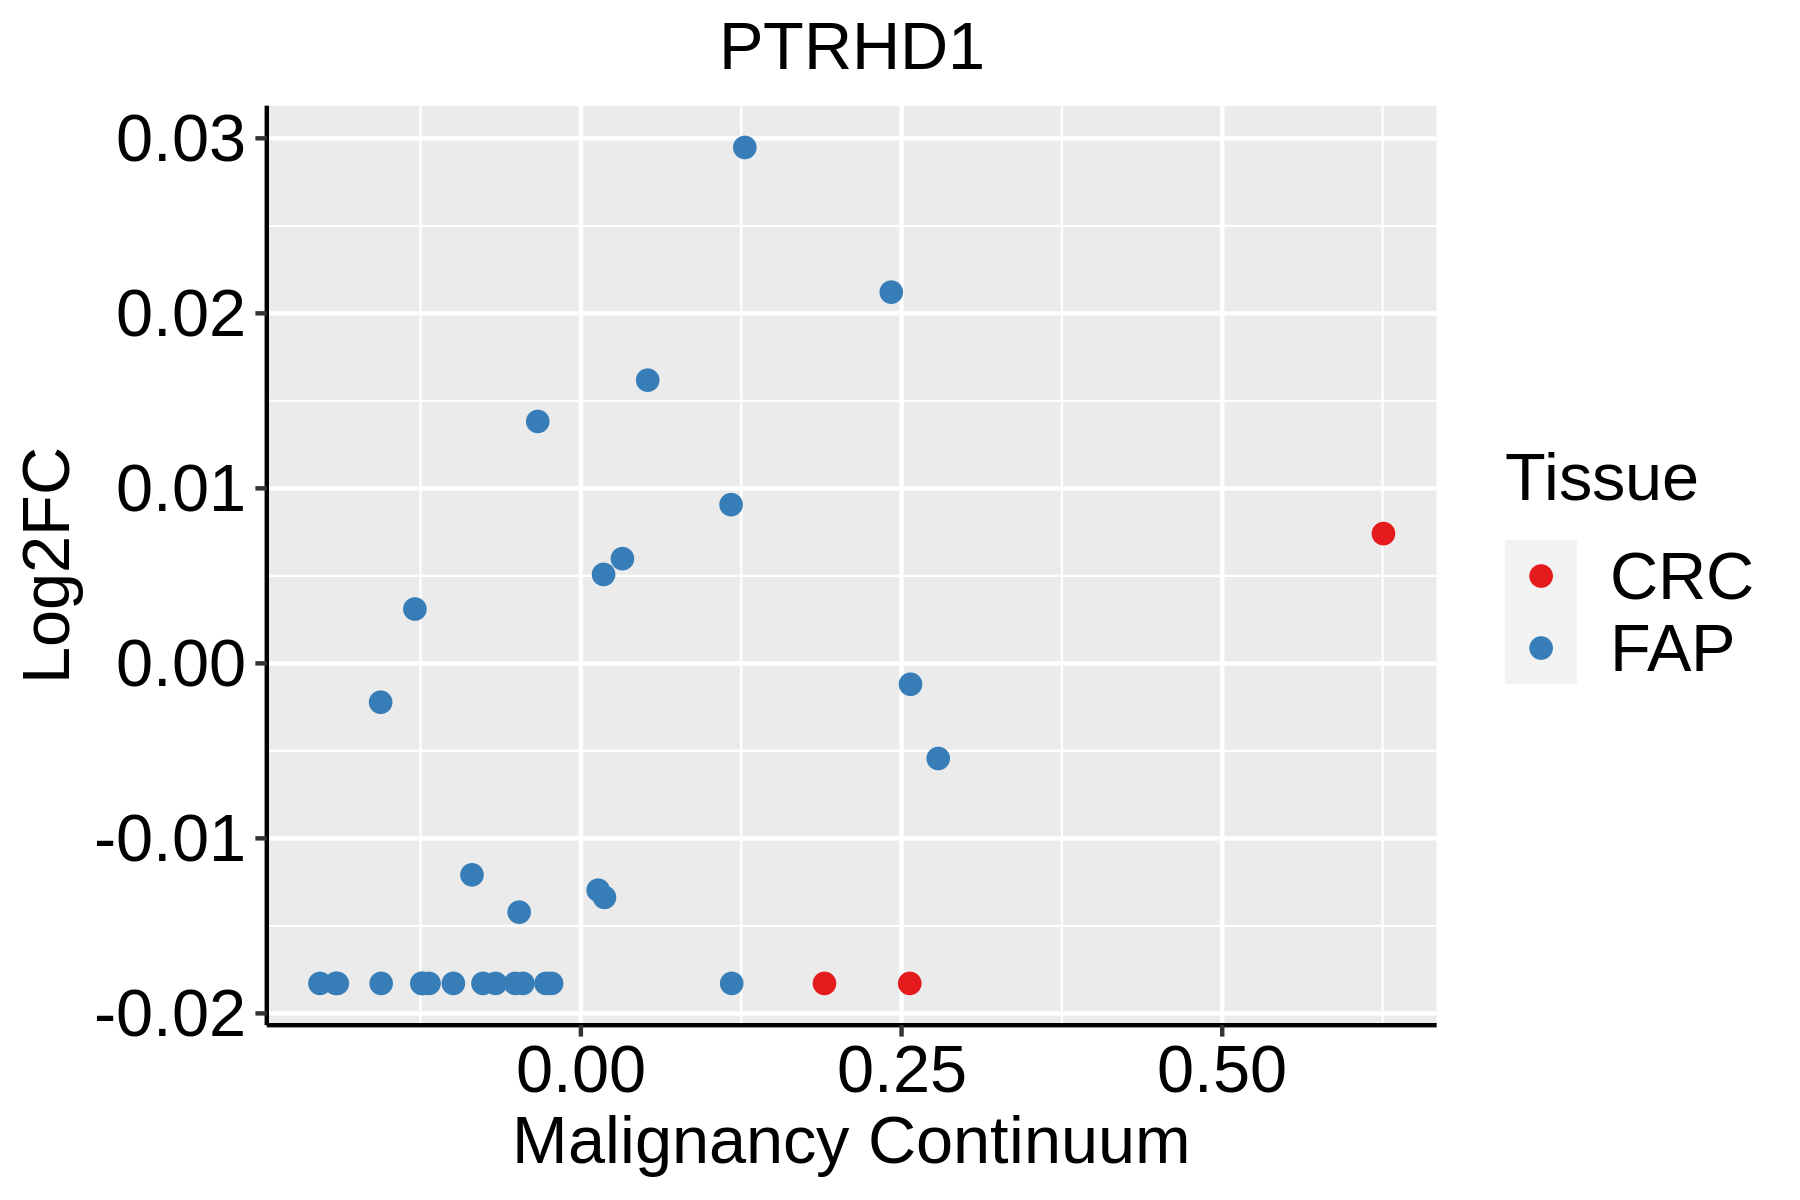 | FAP: Familial adenomatous polyposis |
| CRC: Colorectal cancer | ||
| Colorectum (HTA11) |  | AD: Adenomas |
| SER: Sessile serrated lesions | ||
| MSI-H: Microsatellite-high colorectal cancer | ||
| MSS: Microsatellite stable colorectal cancer | ||
| Esophagus | 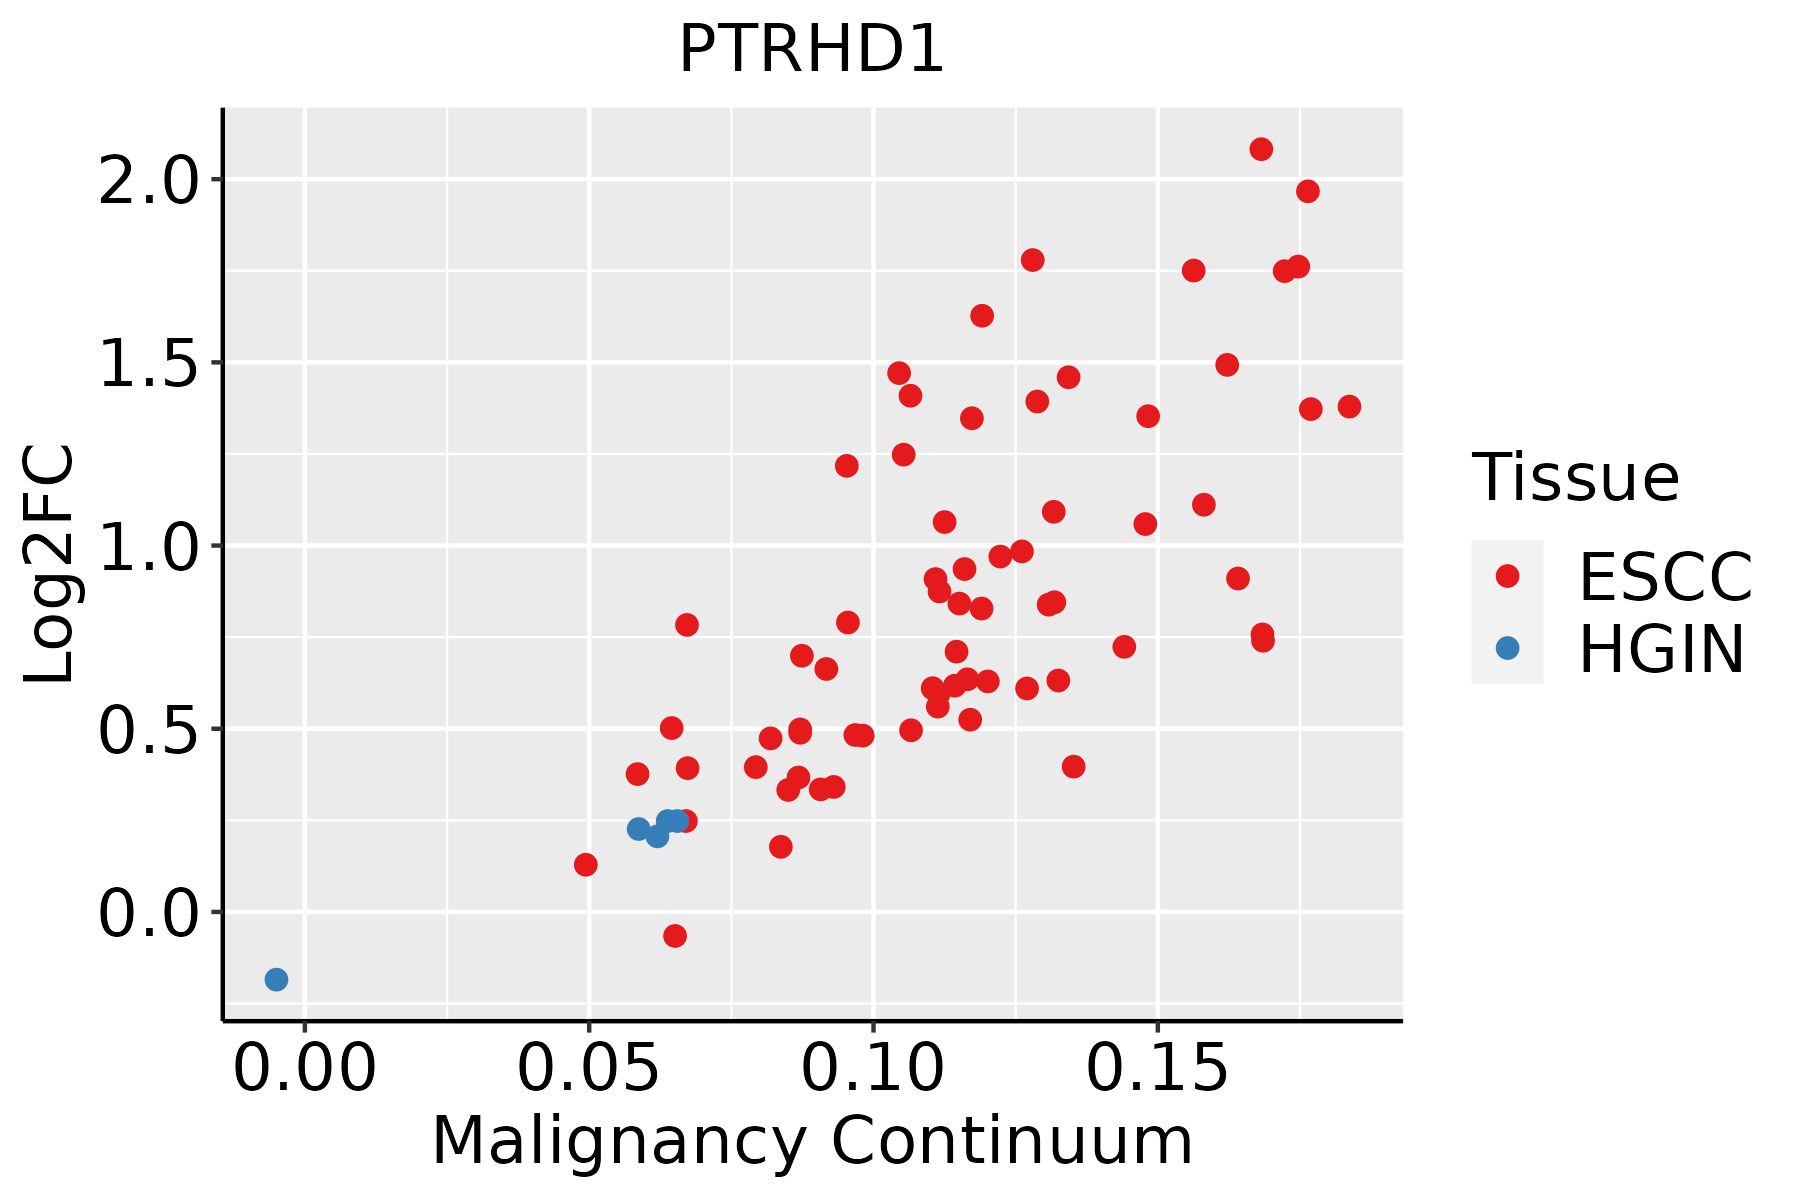 | ESCC: Esophageal squamous cell carcinoma |
| HGIN: High-grade intraepithelial neoplasias | ||
| LGIN: Low-grade intraepithelial neoplasias | ||
| GC |  | CAG: Chronic atrophic gastritis |
| CAG with IM: Chronic atrophic gastritis with intestinal metaplasia | ||
| CSG: Chronic superficial gastritis | ||
| GC: Gastric cancer | ||
| SIM: Severe intestinal metaplasia | ||
| WIM: Wild intestinal metaplasia | ||
| Liver | 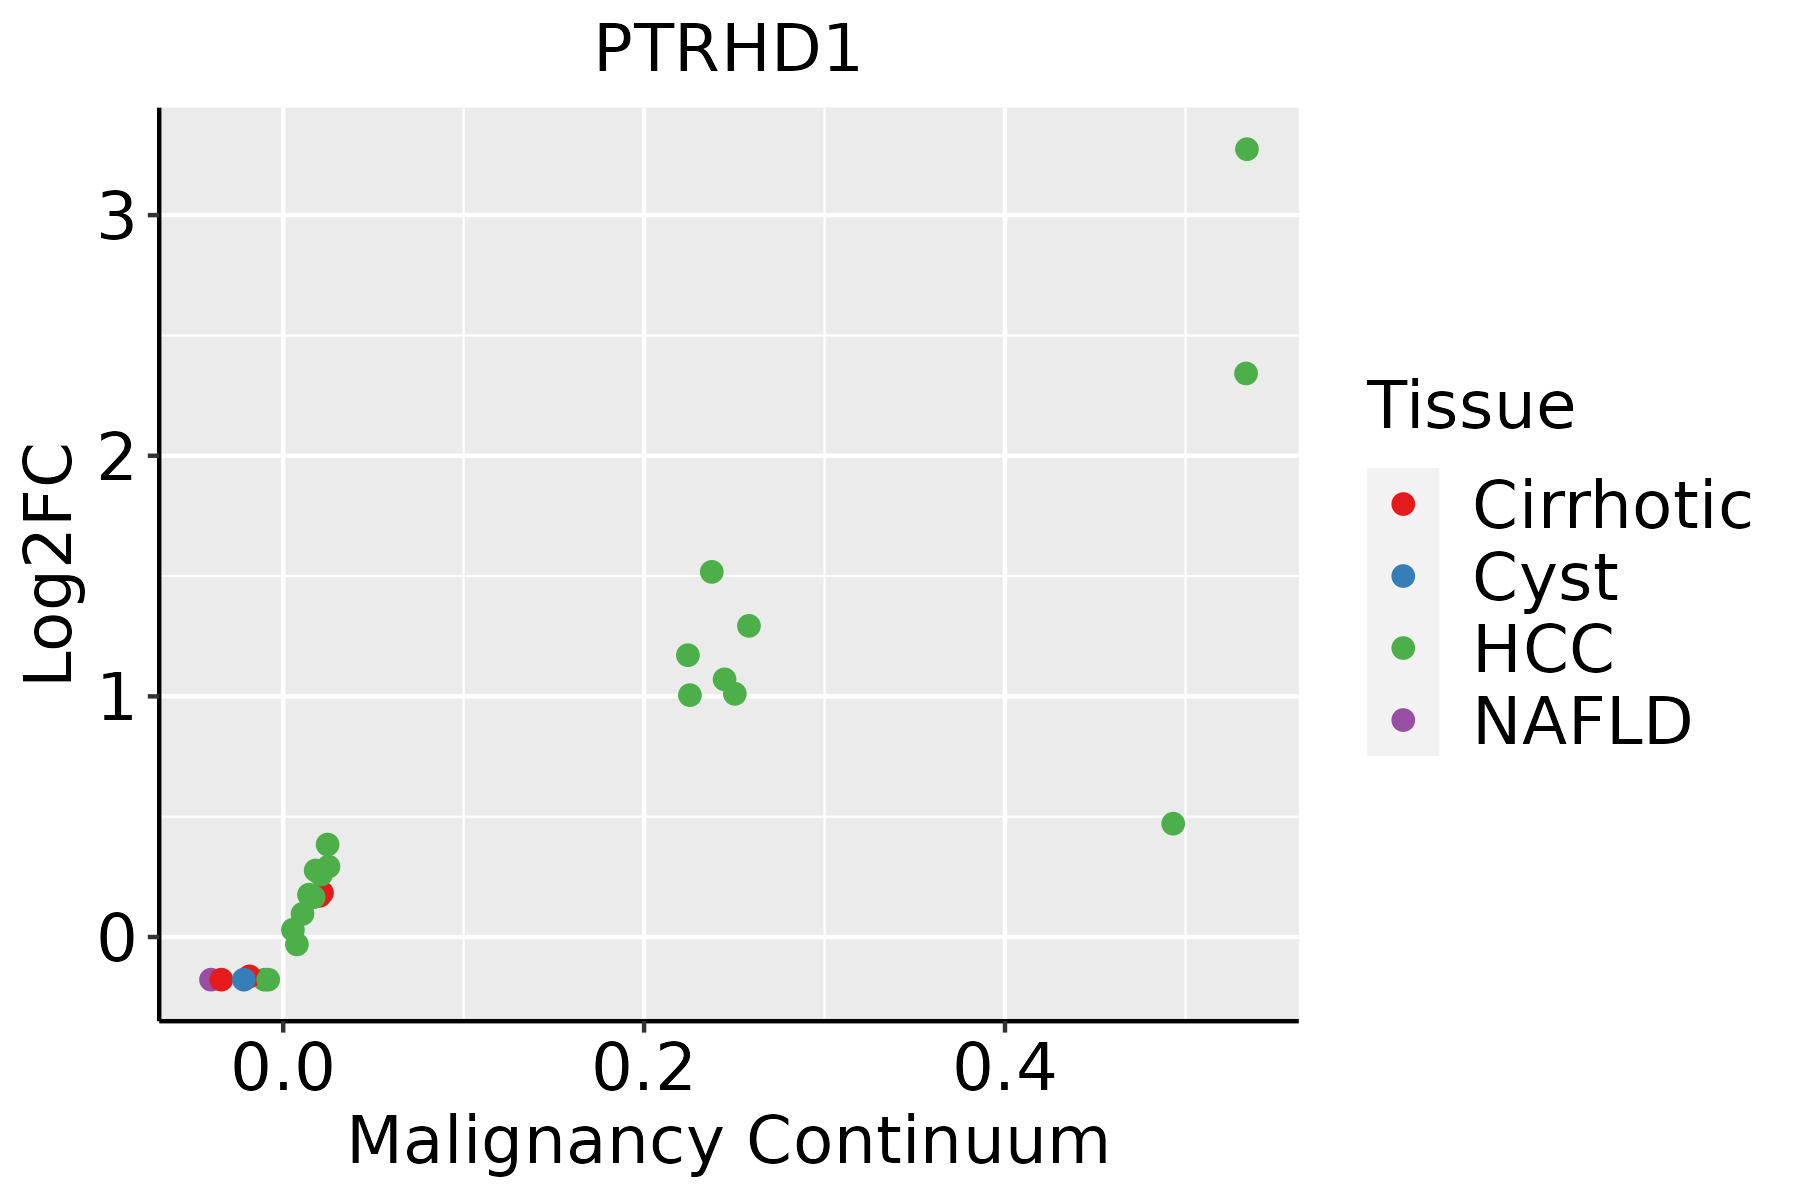 | HCC: Hepatocellular carcinoma |
| NAFLD: Non-alcoholic fatty liver disease | ||
| Oral Cavity | 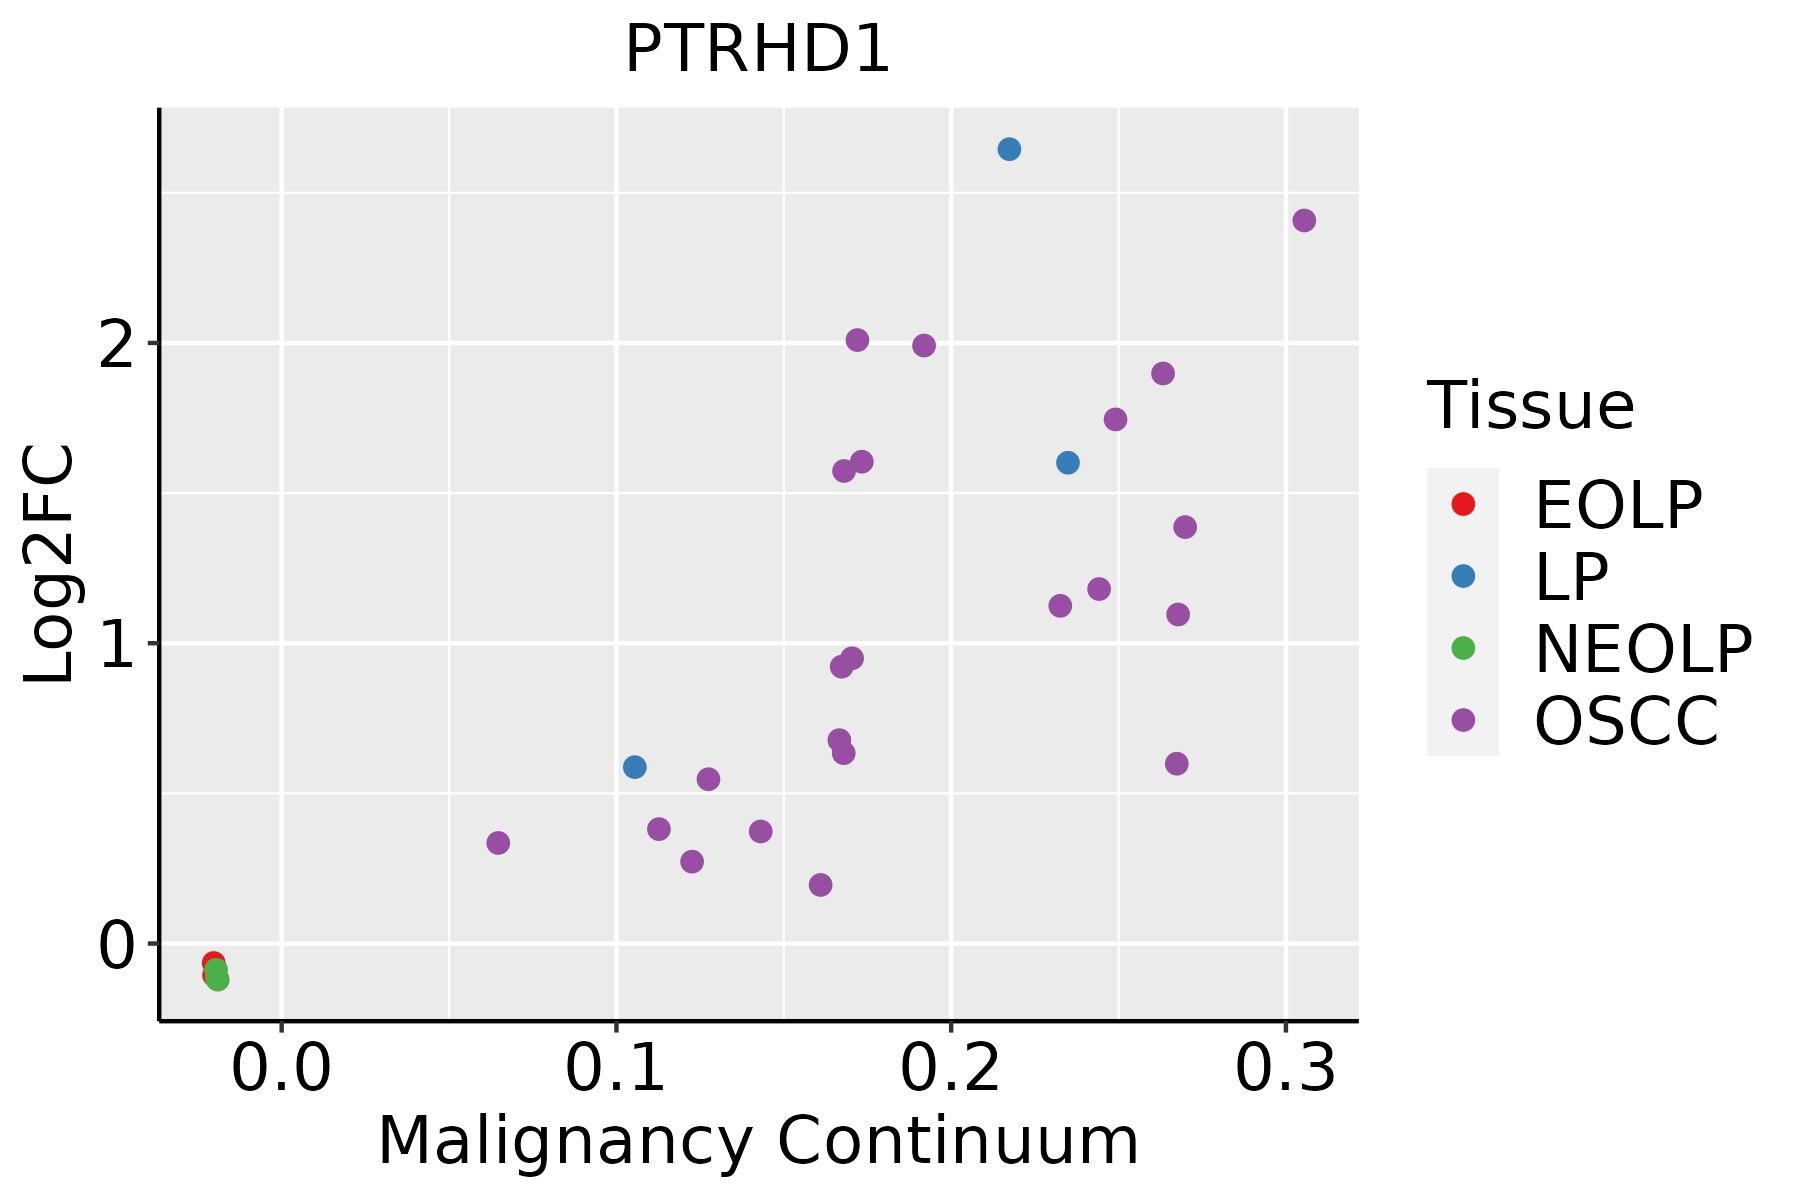 | EOLP: Erosive Oral lichen planus |
| LP: leukoplakia | ||
| NEOLP: Non-erosive oral lichen planus | ||
| OSCC: Oral squamous cell carcinoma | ||
| Prostate | 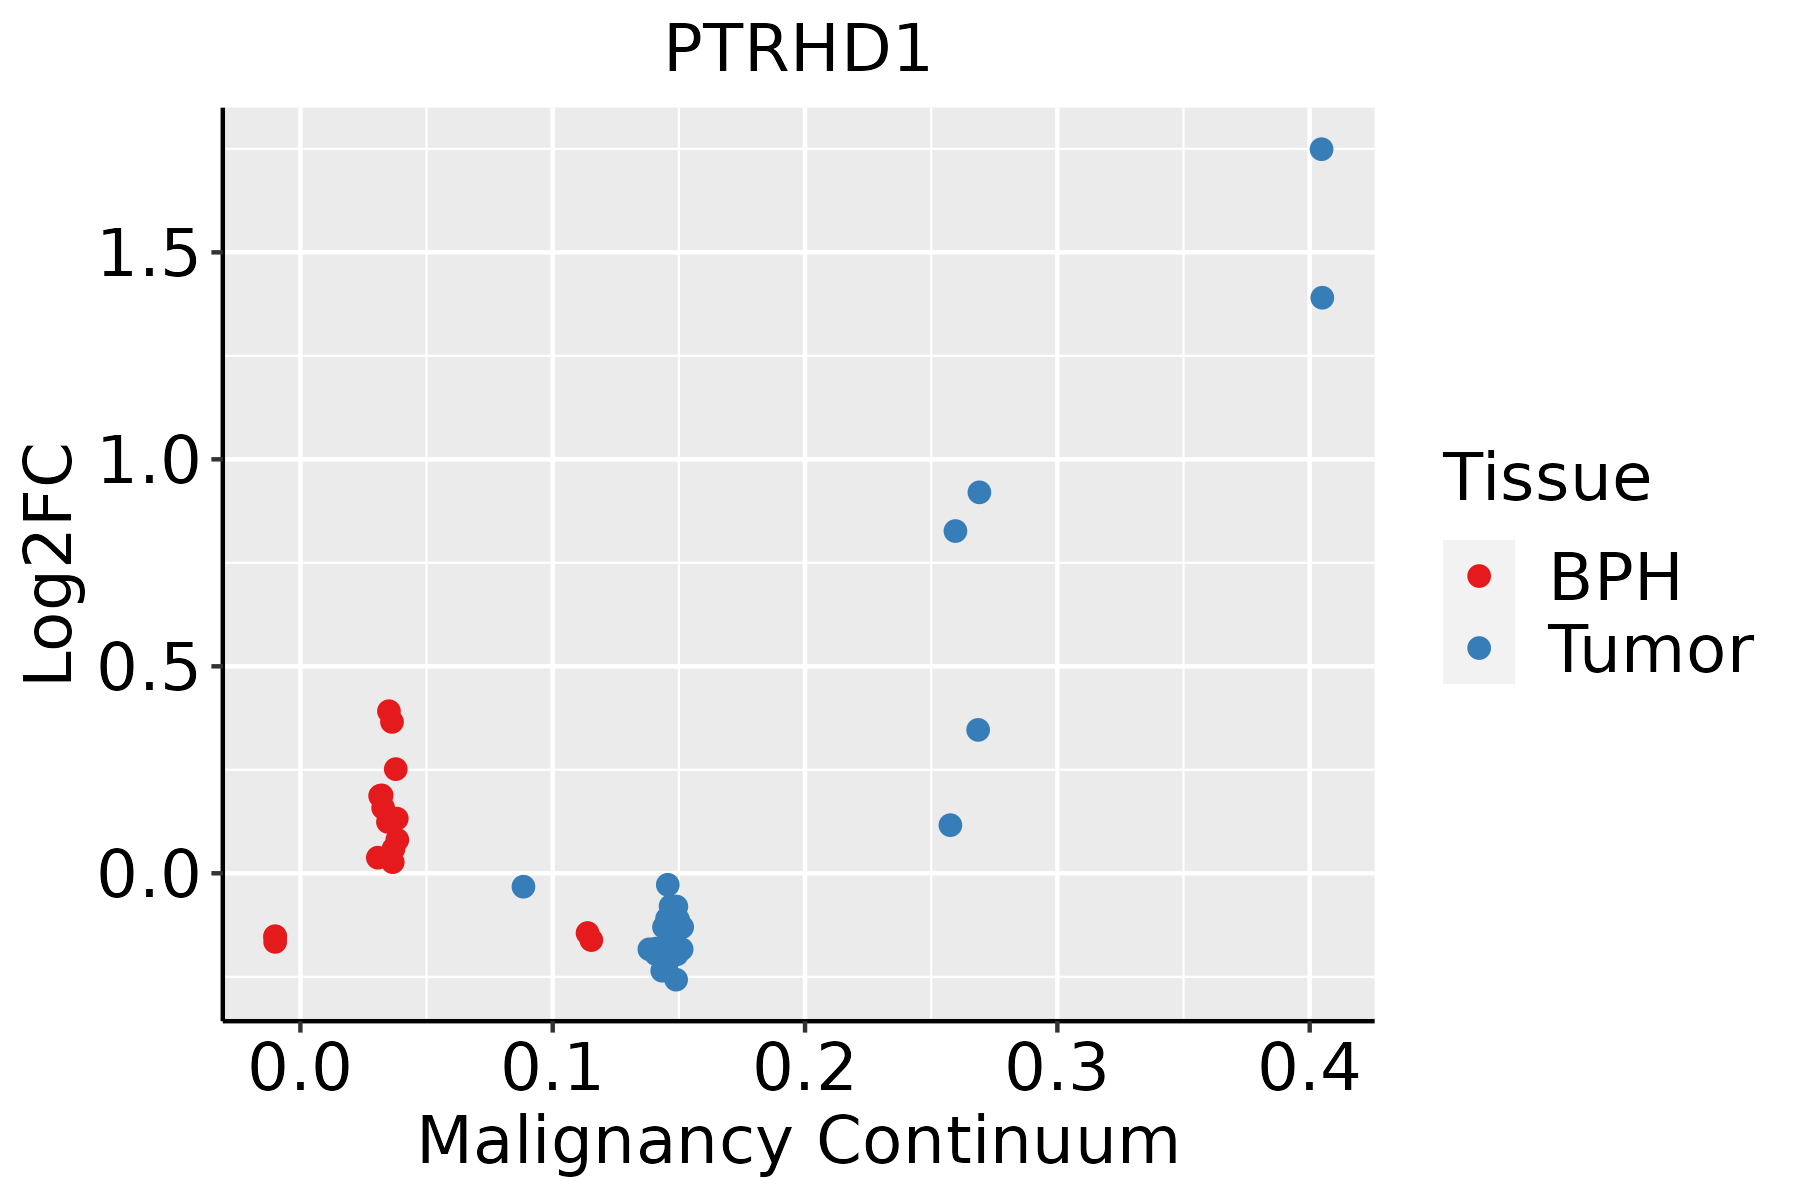 | BPH: Benign Prostatic Hyperplasia |
| Skin | 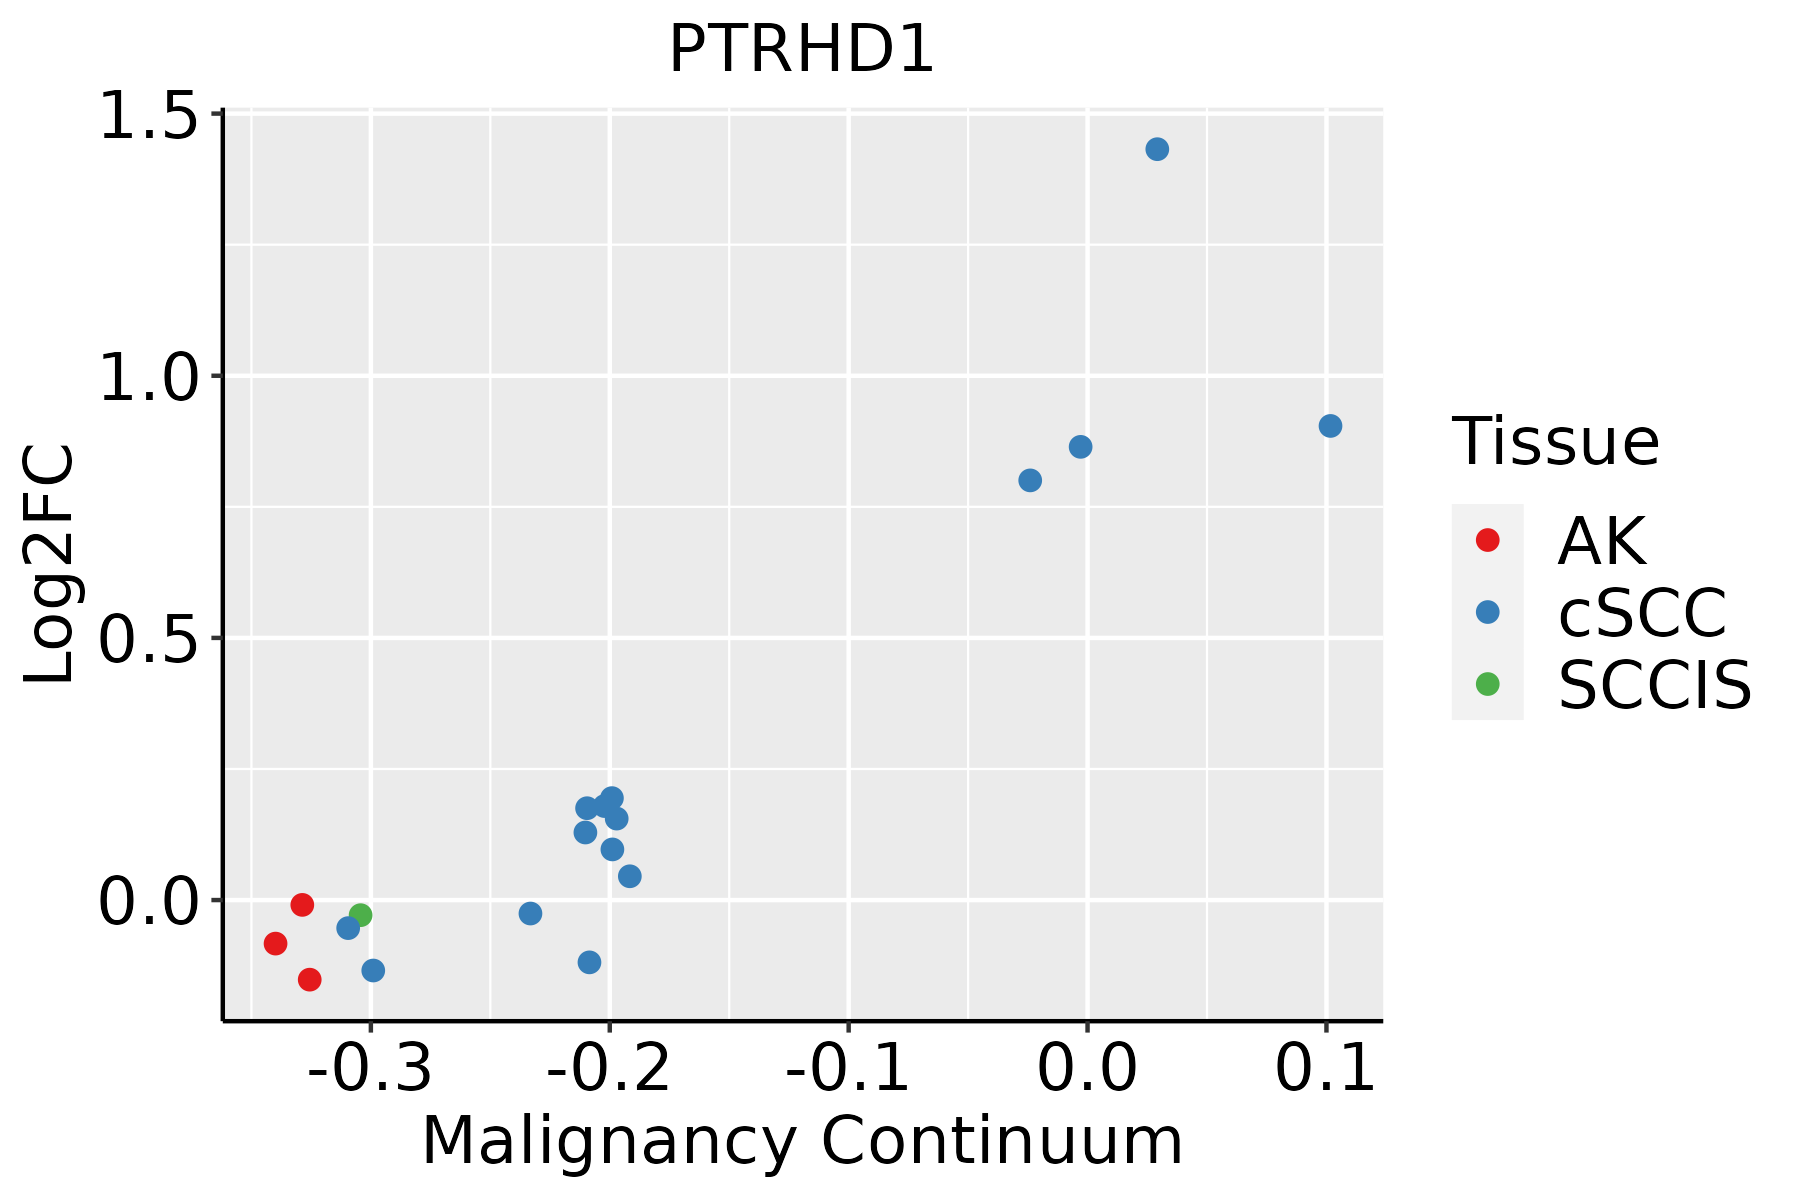 | AK: Actinic keratosis |
| cSCC: Cutaneous squamous cell carcinoma | ||
| SCCIS:squamous cell carcinoma in situ | ||
| Thyroid | 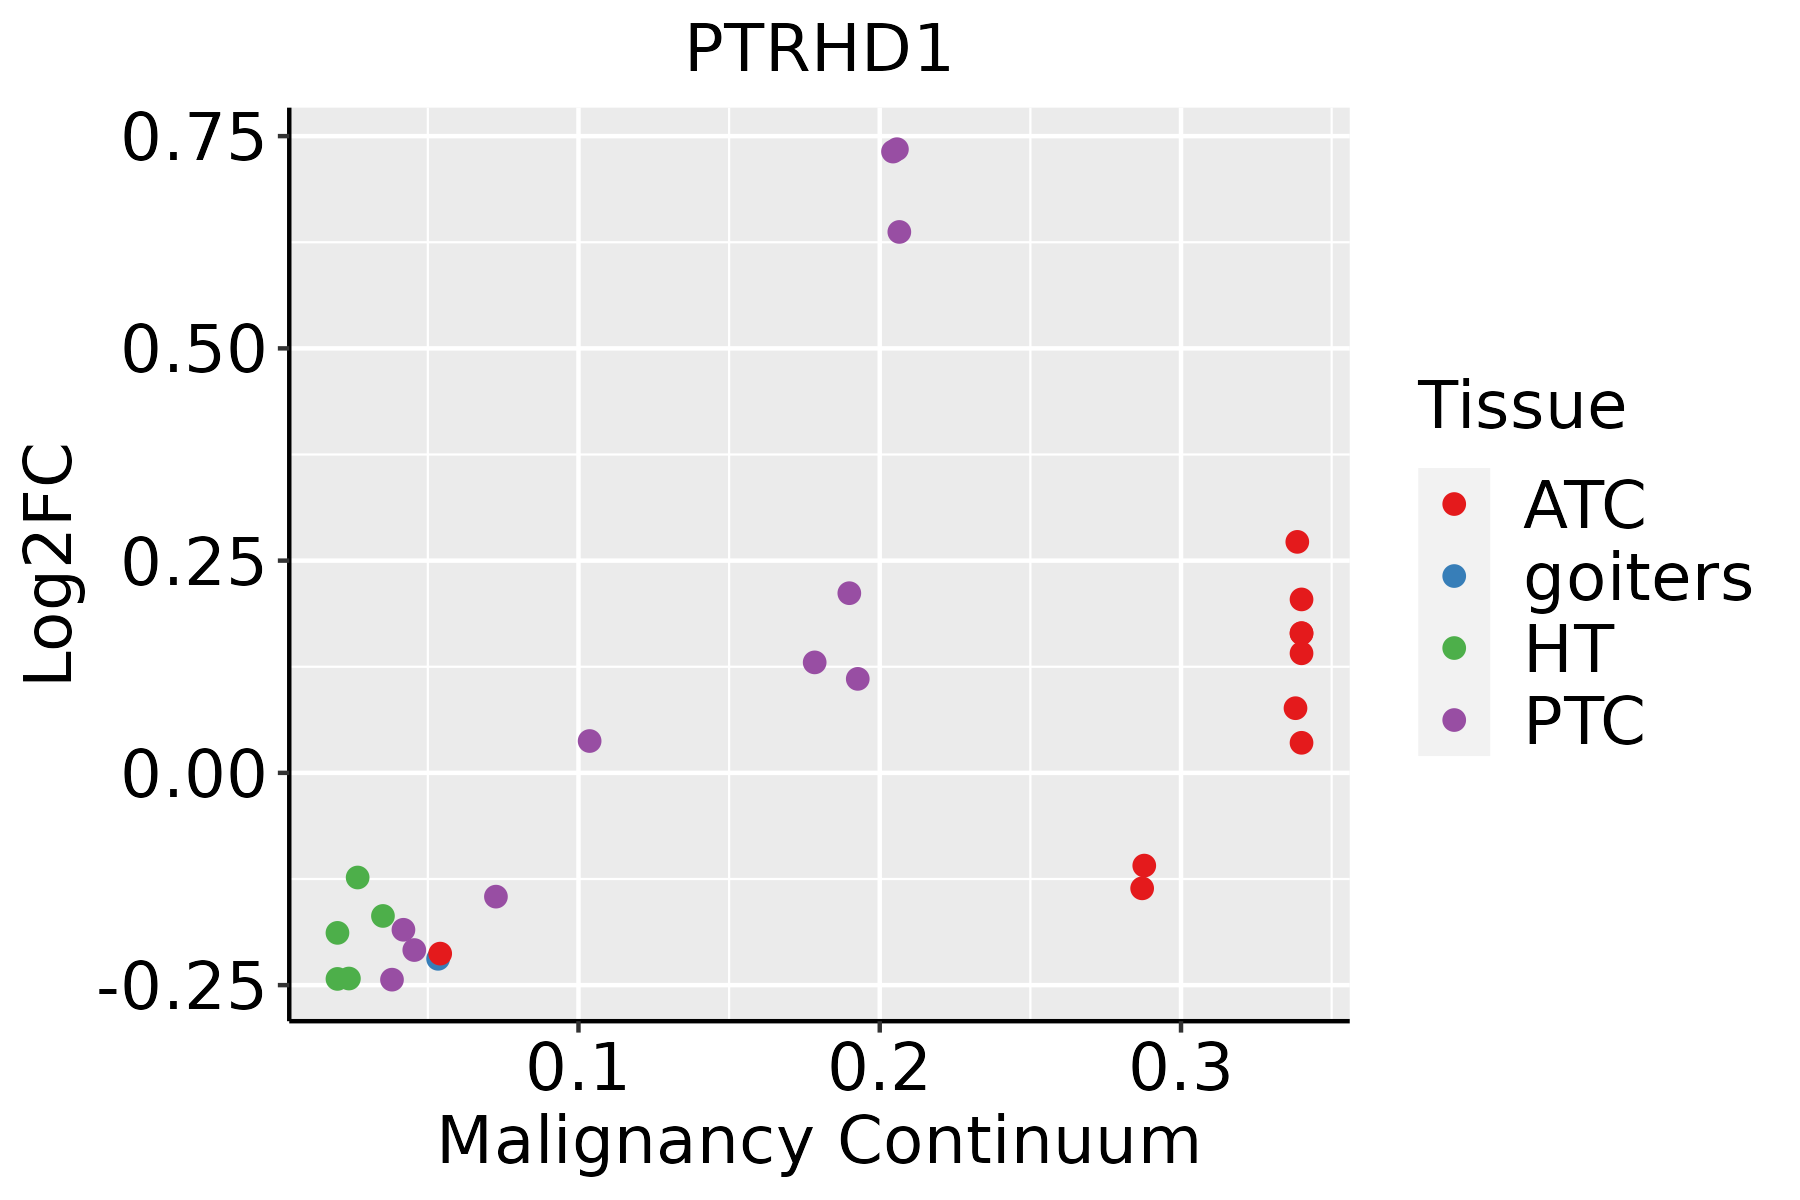 | ATC: Anaplastic thyroid cancer |
| HT: Hashimoto's thyroiditis | ||
| PTC: Papillary thyroid cancer |
| ∗log2FC in expression of this searched gene in stem-like cells from each diseased tissue sample relative to stem-like cells in normal samples in each tissue plotted against the malignancy continuum. Samples are colored based on if they are from different disease stage. |
Top |
Malignant transformation related pathway analysis |
| Find out the enriched GO biological processes and KEGG pathways involved in transition from healthy to precancer to cancer |
| Tissue | Disease Stage | Enriched GO biological Processes |
| Colorectum | AD |  |
| Colorectum | SER |  |
| Colorectum | MSS |  |
| Colorectum | MSI-H |  |
| Colorectum | FAP |  |
| ∗Top 15 enriched GO BP terms are showed in the bar plot of each disease state in each tissue. Each row represents a significant GO biological process which is colored according to the -log10(p.adjust). |
| Page: 1 2 3 4 5 6 7 8 9 |
| GO ID | Tissue | Disease Stage | Description | Gene Ratio | Bg Ratio | pvalue | p.adjust | Count |
| Page: 1 |
| Pathway ID | Tissue | Disease Stage | Description | Gene Ratio | Bg Ratio | pvalue | p.adjust | qvalue | Count |
| Page: 1 |
Top |
Cell-cell communication analysis |
| Identification of potential cell-cell interactions between two cell types and their ligand-receptor pairs for different disease states |
| Ligand | Receptor | LRpair | Pathway | Tissue | Disease Stage |
| Page: 1 |
Top |
Single-cell gene regulatory network inference analysis |
| Find out the significant the regulons (TFs) and the target genes of each regulon across cell types for different disease states |
| TF | Cell Type | Tissue | Disease Stage | Target Gene | RSS | Regulon Activity |
| ∗The dot plots of a searched regulon are shown for all cell subpopulations in each disease state of each tissue based on the regulon specific score inferred using pySCENIC and by calculating the average expression. |
| Page: 1 |
Top |
Somatic mutation of malignant transformation related genes |
| Annotation of somatic variants for genes involved in malignant transformation |
| Hugo Symbol | Variant Class | Variant Classification | dbSNP RS | HGVSc | HGVSp | HGVSp Short | SWISSPROT | BIOTYPE | SIFT | PolyPhen | Tumor Sample Barcode | Tissue | Histology | Sex | Age | Stage | Therapy Types | Drugs | Outcome |
| PTRHD1 | SNV | Missense_Mutation | c.109N>A | p.Gln37Lys | p.Q37K | Q6GMV3 | protein_coding | tolerated(1) | benign(0.007) | TCGA-AR-A1AR-01 | Breast | breast invasive carcinoma | Female | <65 | III/IV | Unspecific | Docetaxel | PD | |
| PTRHD1 | SNV | Missense_Mutation | novel | c.99G>T | p.Lys33Asn | p.K33N | Q6GMV3 | protein_coding | tolerated(0.2) | benign(0.346) | TCGA-AA-A00N-01 | Colorectum | colon adenocarcinoma | Male | >=65 | I/II | Unknown | Unknown | PD |
| PTRHD1 | SNV | Missense_Mutation | c.122C>T | p.Ser41Phe | p.S41F | Q6GMV3 | protein_coding | deleterious(0) | probably_damaging(0.987) | TCGA-AY-4070-01 | Colorectum | colon adenocarcinoma | Female | <65 | III/IV | Chemotherapy | 5-fu | PD | |
| PTRHD1 | SNV | Missense_Mutation | c.278N>C | p.Glu93Ala | p.E93A | Q6GMV3 | protein_coding | tolerated(0.64) | benign(0.001) | TCGA-CI-6624-01 | Colorectum | rectum adenocarcinoma | Female | <65 | I/II | Unknown | Unknown | SD | |
| PTRHD1 | SNV | Missense_Mutation | c.347N>T | p.Ala116Val | p.A116V | Q6GMV3 | protein_coding | deleterious(0) | benign(0.112) | TCGA-AP-A0LM-01 | Endometrium | uterine corpus endometrioid carcinoma | Female | <65 | III/IV | Chemotherapy | cisplatin | SD | |
| PTRHD1 | SNV | Missense_Mutation | c.314A>C | p.His105Pro | p.H105P | Q6GMV3 | protein_coding | deleterious(0) | probably_damaging(0.955) | TCGA-BS-A0UV-01 | Endometrium | uterine corpus endometrioid carcinoma | Female | <65 | III/IV | Unknown | Unknown | SD | |
| PTRHD1 | SNV | Missense_Mutation | novel | c.226N>T | p.Gly76Trp | p.G76W | Q6GMV3 | protein_coding | deleterious(0) | probably_damaging(0.984) | TCGA-49-6761-01 | Lung | lung adenocarcinoma | Female | >=65 | III/IV | Unknown | Unknown | SD |
| PTRHD1 | SNV | Missense_Mutation | c.29N>C | p.Arg10Pro | p.R10P | Q6GMV3 | protein_coding | tolerated_low_confidence(0.18) | benign(0) | TCGA-49-AAR3-01 | Lung | lung adenocarcinoma | Male | >=65 | I/II | Unknown | Unknown | PD | |
| PTRHD1 | SNV | Missense_Mutation | c.313N>G | p.His105Asp | p.H105D | Q6GMV3 | protein_coding | deleterious(0) | probably_damaging(0.955) | TCGA-91-6848-01 | Lung | lung adenocarcinoma | Male | <65 | III/IV | Chemotherapy | cisplatin | CR | |
| PTRHD1 | SNV | Missense_Mutation | novel | c.381N>C | p.Glu127Asp | p.E127D | Q6GMV3 | protein_coding | tolerated(0.56) | possibly_damaging(0.751) | TCGA-KK-A8IG-01 | Prostate | prostate adenocarcinoma | Male | <65 | 7 | Unknown | Unknown | SD |
| Page: 1 2 |
Top |
Related drugs of malignant transformation related genes |
| Identification of chemicals and drugs interact with genes involved in malignant transfromation |
| (DGIdb 4.0) |
| Entrez ID | Symbol | Category | Interaction Types | Drug Claim Name | Drug Name | PMIDs |
| Page: 1 |

Copyright 2023-Present -The University of Texas Health Science Center at Houston |