
|
|||||
|
 | |
| |
| |
| |
| |
| |
|
Gene: PRPSAP1 |
Gene summary for PRPSAP1 |
| Gene information | Species | Human | Gene symbol | PRPSAP1 | Gene ID | 5635 |
| Gene name | phosphoribosyl pyrophosphate synthetase associated protein 1 | |
| Gene Alias | PAP39 | |
| Cytomap | 17q25.1 | |
| Gene Type | protein-coding | GO ID | GO:0006015 | UniProtAcc | B4DP31 |
Top |
Malignant transformation analysis |
| Identification of the aberrant gene expression in precancerous and cancerous lesions by comparing the gene expression of stem-like cells in diseased tissues with normal stem cells |
| Entrez ID | Symbol | Replicates | Species | Organ | Tissue | Adj P-value | Log2FC | Malignancy |
| 5635 | PRPSAP1 | HCC1_Meng | Human | Liver | HCC | 1.14e-75 | 2.01e-01 | 0.0246 |
| 5635 | PRPSAP1 | HCC2_Meng | Human | Liver | HCC | 2.76e-15 | 2.01e-02 | 0.0107 |
| 5635 | PRPSAP1 | cirrhotic1 | Human | Liver | Cirrhotic | 4.02e-03 | 1.59e-01 | 0.0202 |
| 5635 | PRPSAP1 | cirrhotic2 | Human | Liver | Cirrhotic | 1.44e-09 | 1.93e-01 | 0.0201 |
| 5635 | PRPSAP1 | HCC1 | Human | Liver | HCC | 2.24e-11 | 3.80e+00 | 0.5336 |
| 5635 | PRPSAP1 | HCC2 | Human | Liver | HCC | 8.12e-15 | 3.73e+00 | 0.5341 |
| 5635 | PRPSAP1 | Pt13.b | Human | Liver | HCC | 4.24e-11 | 1.75e-01 | 0.0251 |
| 5635 | PRPSAP1 | Pt14.b | Human | Liver | HCC | 4.85e-05 | 3.33e-01 | 0.018 |
| 5635 | PRPSAP1 | S014 | Human | Liver | HCC | 2.11e-18 | 8.58e-01 | 0.2254 |
| 5635 | PRPSAP1 | S015 | Human | Liver | HCC | 3.96e-15 | 8.76e-01 | 0.2375 |
| 5635 | PRPSAP1 | S016 | Human | Liver | HCC | 1.14e-15 | 7.63e-01 | 0.2243 |
| 5635 | PRPSAP1 | S027 | Human | Liver | HCC | 1.85e-07 | 6.93e-01 | 0.2446 |
| 5635 | PRPSAP1 | S028 | Human | Liver | HCC | 1.78e-20 | 8.23e-01 | 0.2503 |
| 5635 | PRPSAP1 | S029 | Human | Liver | HCC | 3.61e-14 | 7.86e-01 | 0.2581 |
| 5635 | PRPSAP1 | C04 | Human | Oral cavity | OSCC | 6.88e-09 | 6.24e-01 | 0.2633 |
| 5635 | PRPSAP1 | C21 | Human | Oral cavity | OSCC | 2.98e-22 | 8.89e-01 | 0.2678 |
| 5635 | PRPSAP1 | C30 | Human | Oral cavity | OSCC | 8.87e-26 | 1.25e+00 | 0.3055 |
| 5635 | PRPSAP1 | C38 | Human | Oral cavity | OSCC | 6.04e-04 | 7.09e-01 | 0.172 |
| 5635 | PRPSAP1 | C43 | Human | Oral cavity | OSCC | 1.04e-33 | 6.14e-01 | 0.1704 |
| 5635 | PRPSAP1 | C46 | Human | Oral cavity | OSCC | 9.38e-15 | 5.46e-01 | 0.1673 |
| Page: 1 2 3 4 5 6 |
| Tissue | Expression Dynamics | Abbreviation |
| Esophagus | 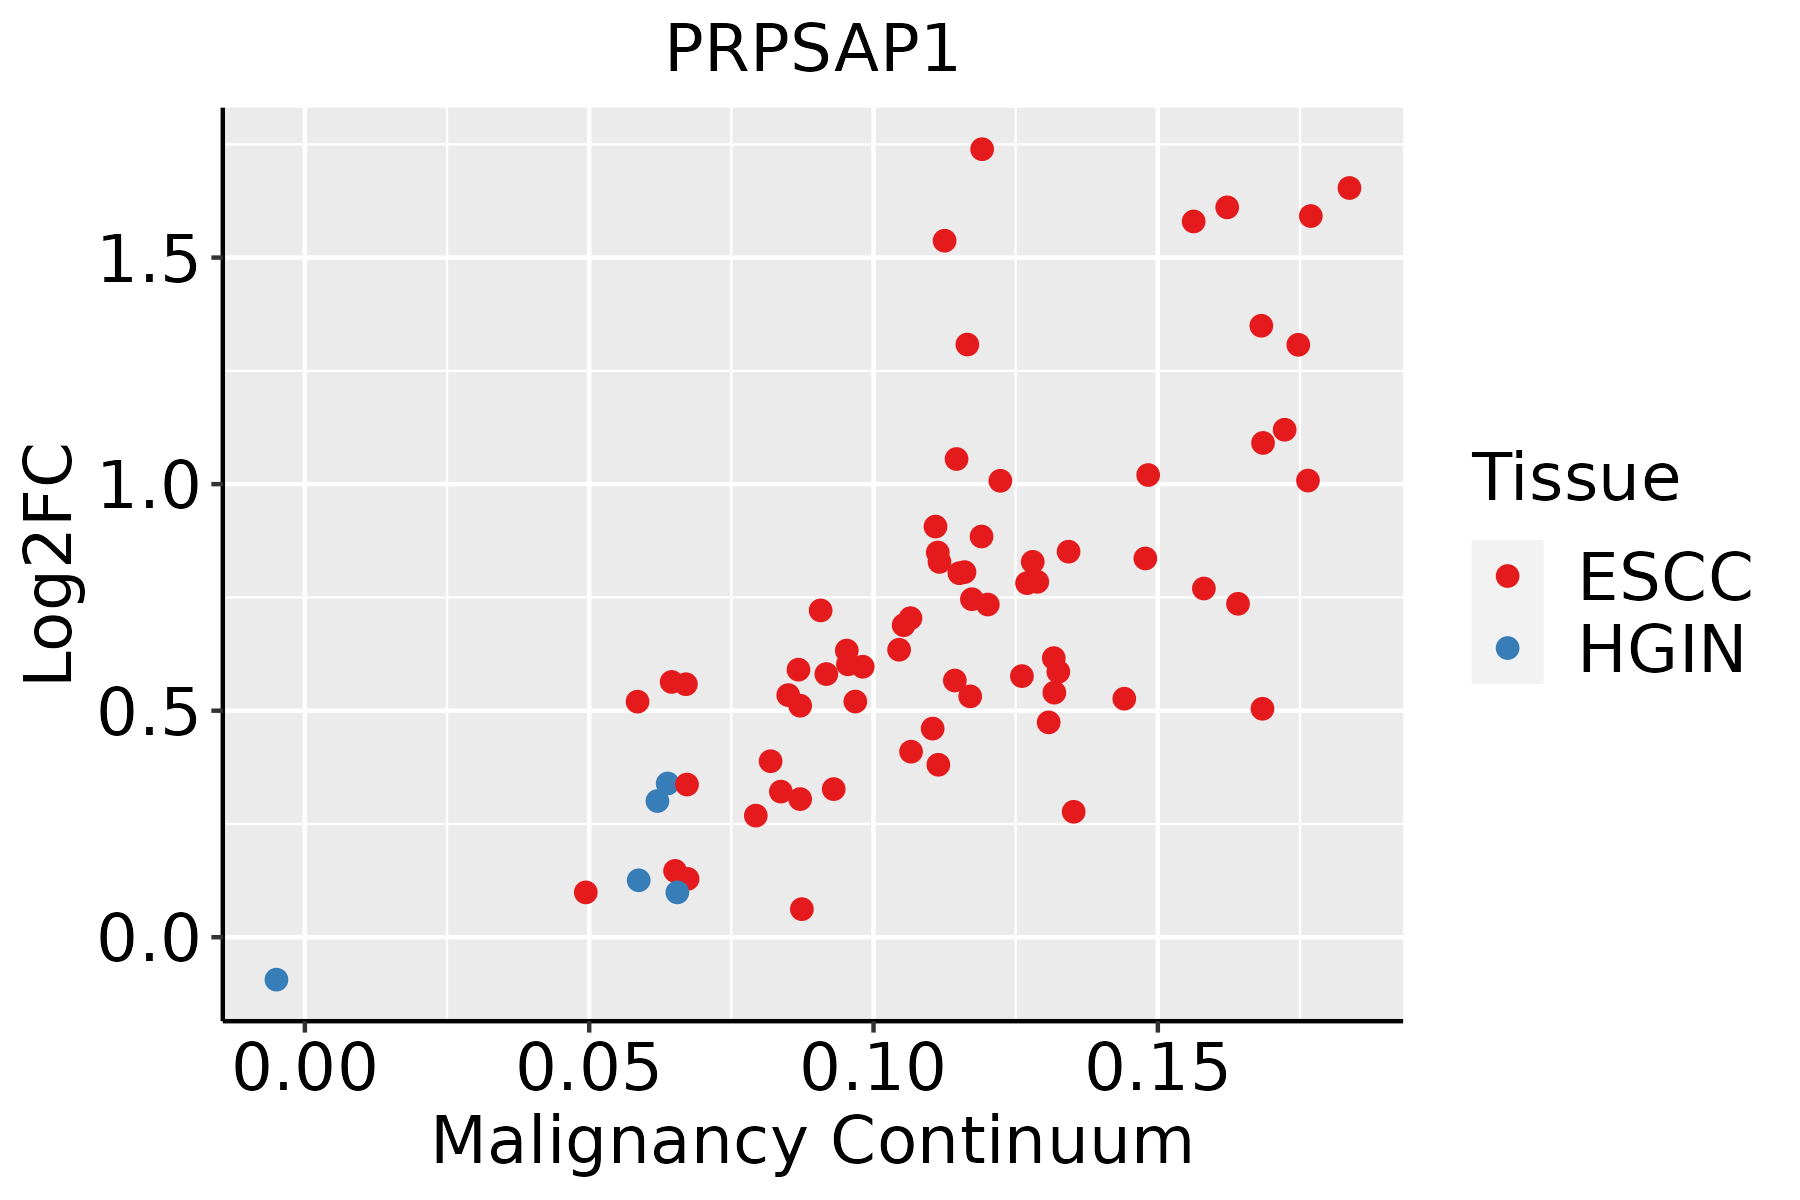 | ESCC: Esophageal squamous cell carcinoma |
| HGIN: High-grade intraepithelial neoplasias | ||
| LGIN: Low-grade intraepithelial neoplasias | ||
| Liver | 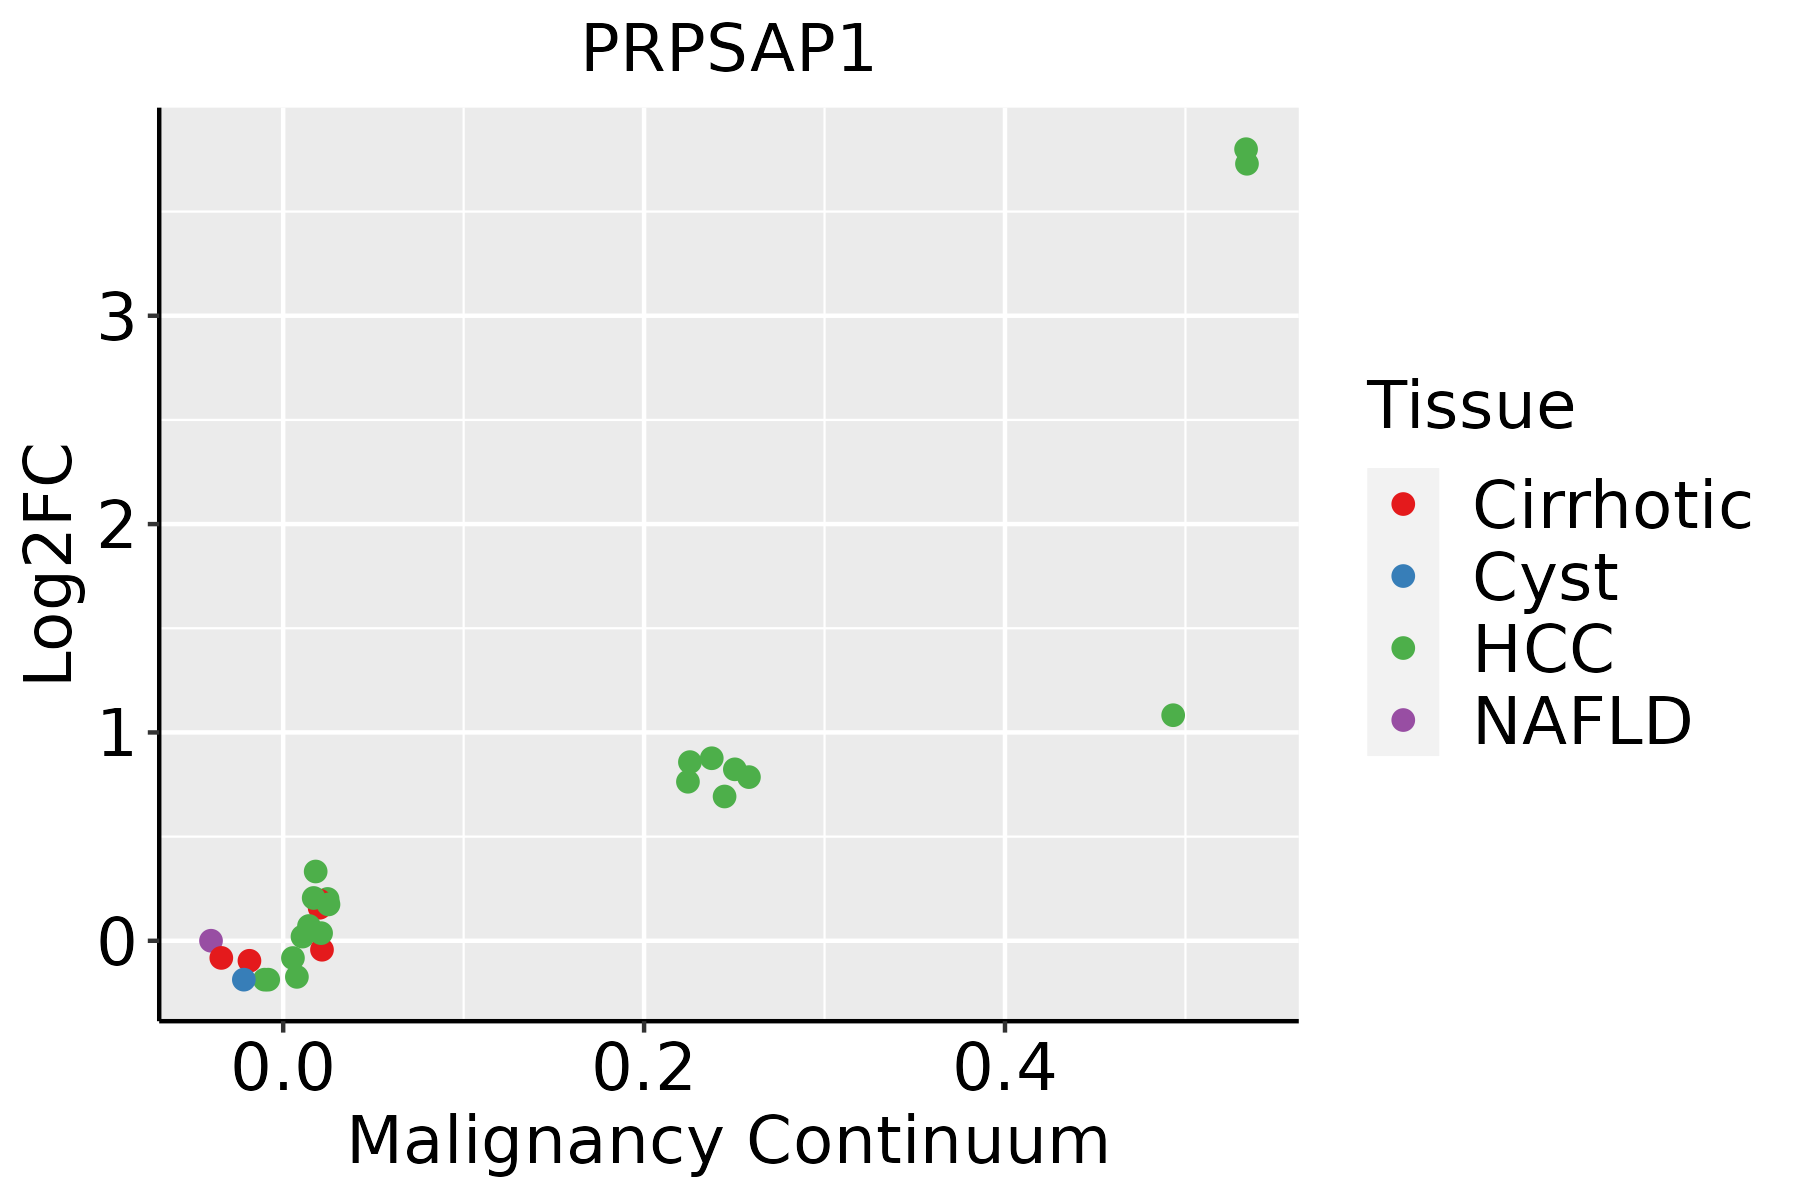 | HCC: Hepatocellular carcinoma |
| NAFLD: Non-alcoholic fatty liver disease | ||
| Oral Cavity | 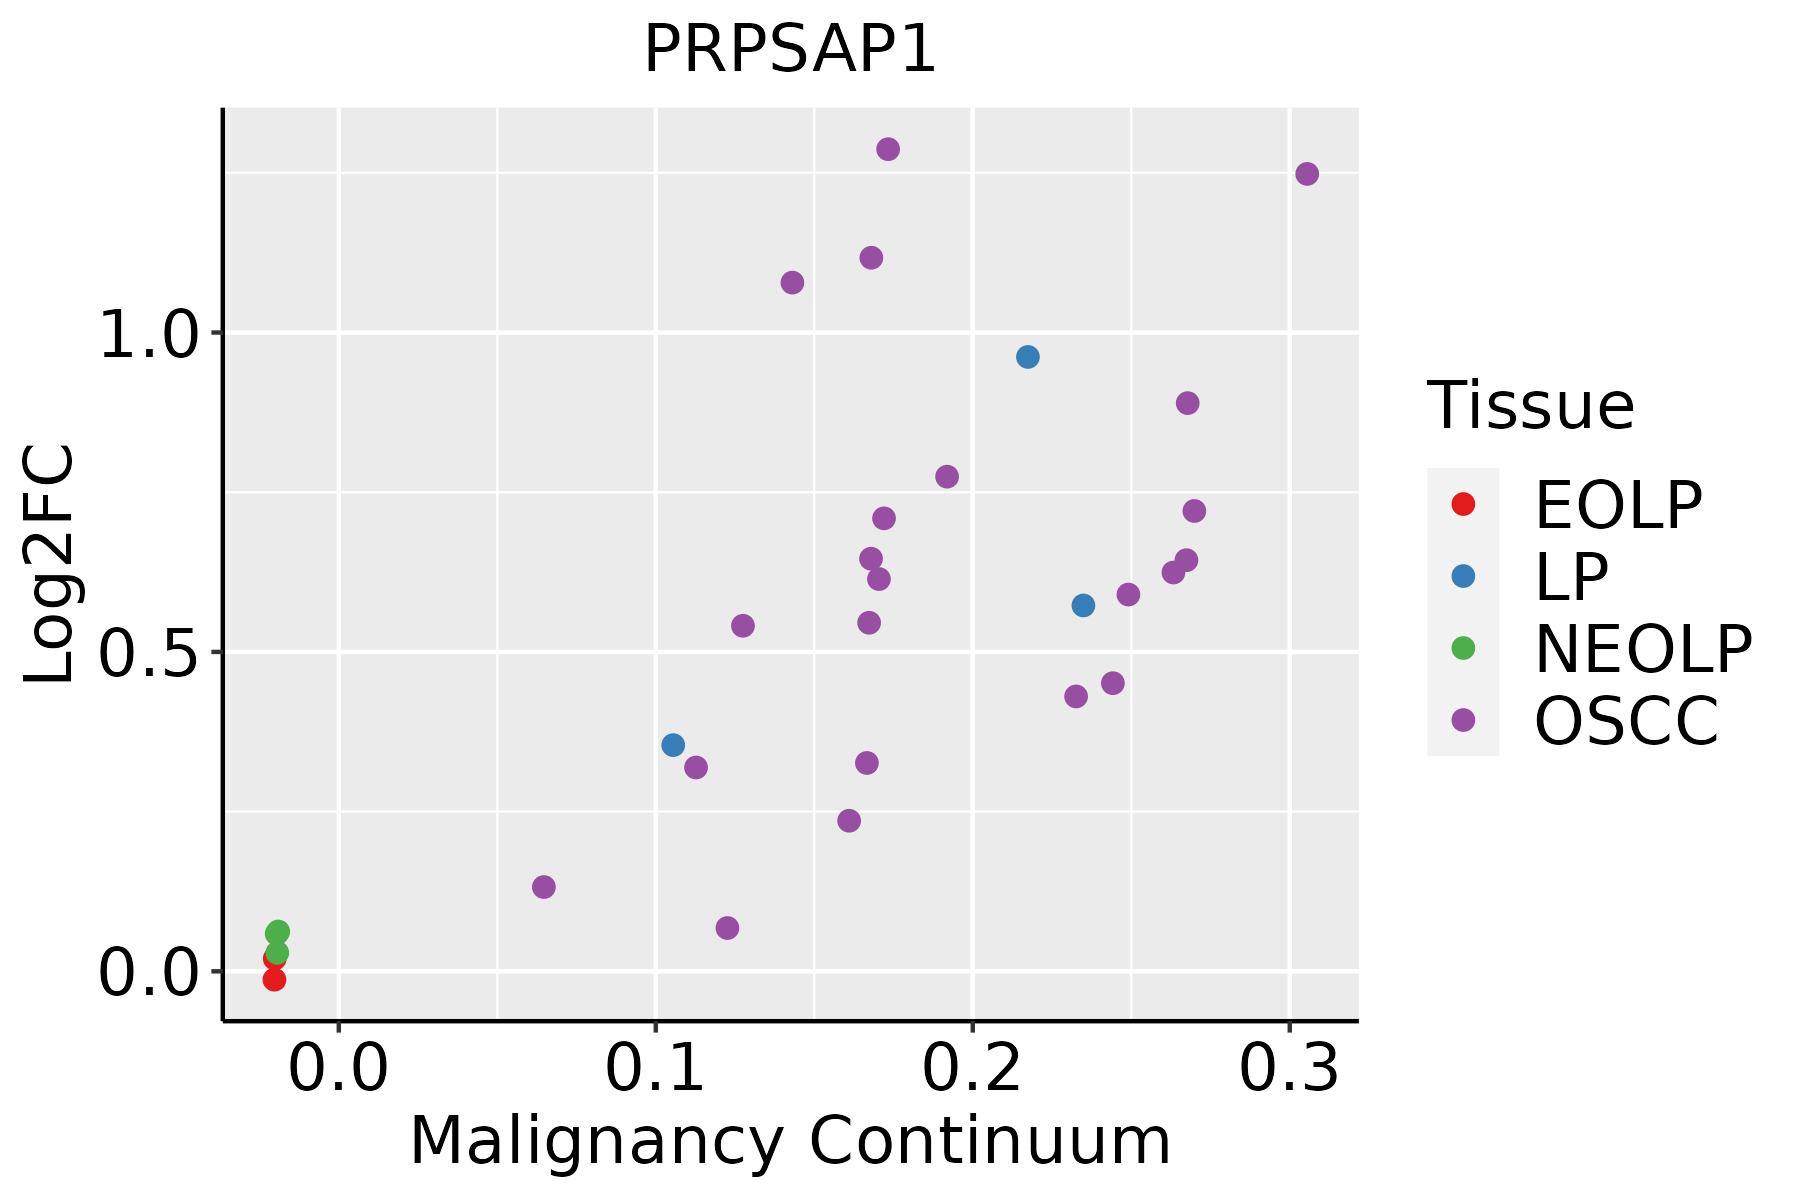 | EOLP: Erosive Oral lichen planus |
| LP: leukoplakia | ||
| NEOLP: Non-erosive oral lichen planus | ||
| OSCC: Oral squamous cell carcinoma | ||
| Skin | 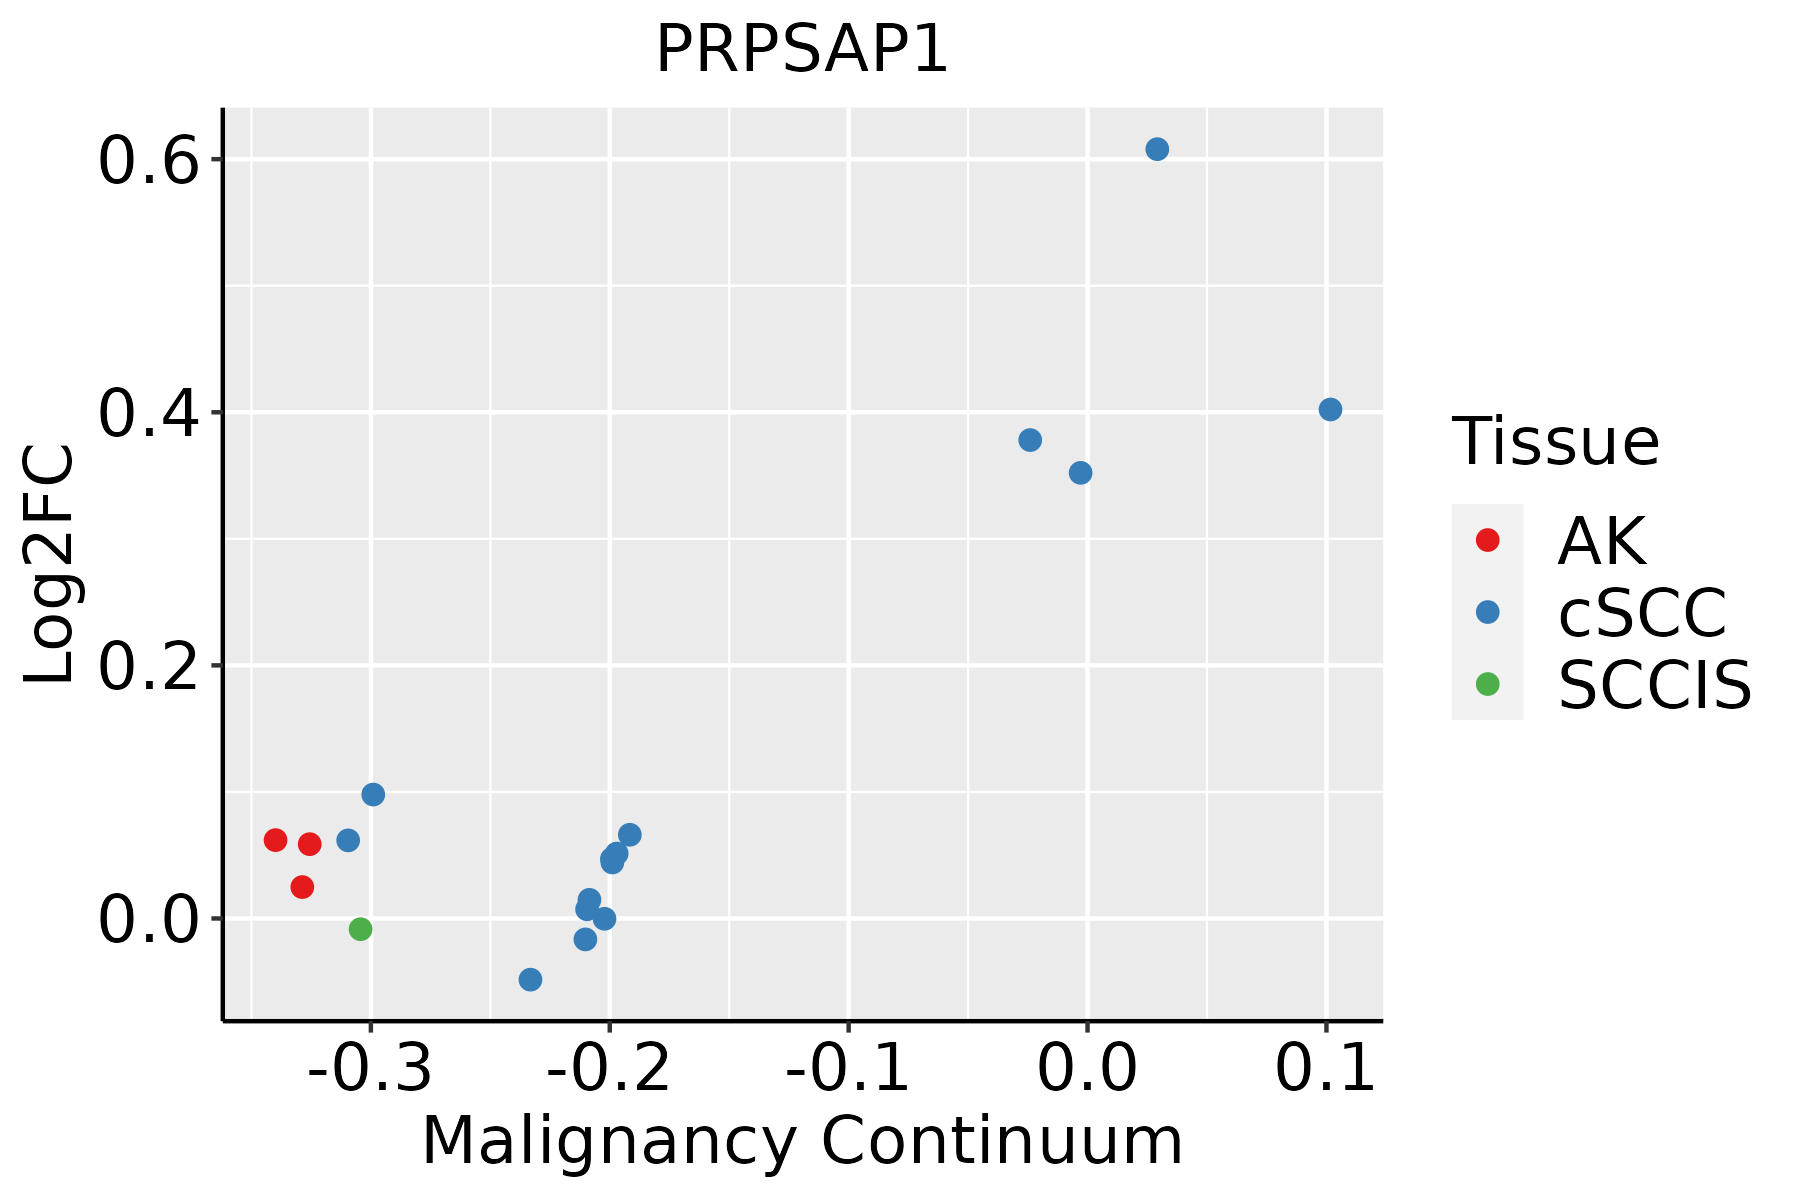 | AK: Actinic keratosis |
| cSCC: Cutaneous squamous cell carcinoma | ||
| SCCIS:squamous cell carcinoma in situ | ||
| Thyroid |  | ATC: Anaplastic thyroid cancer |
| HT: Hashimoto's thyroiditis | ||
| PTC: Papillary thyroid cancer |
| ∗log2FC in expression of this searched gene in stem-like cells from each diseased tissue sample relative to stem-like cells in normal samples in each tissue plotted against the malignancy continuum. Samples are colored based on if they are from different disease stage. |
Top |
Malignant transformation related pathway analysis |
| Find out the enriched GO biological processes and KEGG pathways involved in transition from healthy to precancer to cancer |
| Tissue | Disease Stage | Enriched GO biological Processes |
| Colorectum | AD |  |
| Colorectum | SER |  |
| Colorectum | MSS |  |
| Colorectum | MSI-H |  |
| Colorectum | FAP |  |
| ∗Top 15 enriched GO BP terms are showed in the bar plot of each disease state in each tissue. Each row represents a significant GO biological process which is colored according to the -log10(p.adjust). |
| Page: 1 2 3 4 5 6 7 8 9 |
| GO ID | Tissue | Disease Stage | Description | Gene Ratio | Bg Ratio | pvalue | p.adjust | Count |
| GO:0006753110 | Esophagus | ESCC | nucleoside phosphate metabolic process | 288/8552 | 497/18723 | 1.80e-08 | 3.50e-07 | 288 |
| GO:0019693111 | Esophagus | ESCC | ribose phosphate metabolic process | 234/8552 | 396/18723 | 4.24e-08 | 7.76e-07 | 234 |
| GO:0009117111 | Esophagus | ESCC | nucleotide metabolic process | 282/8552 | 489/18723 | 4.70e-08 | 8.50e-07 | 282 |
| GO:0072521111 | Esophagus | ESCC | purine-containing compound metabolic process | 238/8552 | 416/18723 | 1.20e-06 | 1.49e-05 | 238 |
| GO:0046390110 | Esophagus | ESCC | ribose phosphate biosynthetic process | 119/8552 | 190/18723 | 1.73e-06 | 2.06e-05 | 119 |
| GO:0006163111 | Esophagus | ESCC | purine nucleotide metabolic process | 226/8552 | 396/18723 | 2.81e-06 | 3.21e-05 | 226 |
| GO:000916516 | Esophagus | ESCC | nucleotide biosynthetic process | 150/8552 | 254/18723 | 1.12e-05 | 1.06e-04 | 150 |
| GO:190129316 | Esophagus | ESCC | nucleoside phosphate biosynthetic process | 151/8552 | 256/18723 | 1.15e-05 | 1.08e-04 | 151 |
| GO:007252217 | Esophagus | ESCC | purine-containing compound biosynthetic process | 120/8552 | 200/18723 | 3.02e-05 | 2.51e-04 | 120 |
| GO:000616417 | Esophagus | ESCC | purine nucleotide biosynthetic process | 113/8552 | 191/18723 | 1.16e-04 | 8.04e-04 | 113 |
| GO:000675312 | Liver | Cirrhotic | nucleoside phosphate metabolic process | 190/4634 | 497/18723 | 1.10e-11 | 6.96e-10 | 190 |
| GO:000911712 | Liver | Cirrhotic | nucleotide metabolic process | 187/4634 | 489/18723 | 1.55e-11 | 9.63e-10 | 187 |
| GO:001969312 | Liver | Cirrhotic | ribose phosphate metabolic process | 156/4634 | 396/18723 | 5.83e-11 | 3.23e-09 | 156 |
| GO:007252112 | Liver | Cirrhotic | purine-containing compound metabolic process | 156/4634 | 416/18723 | 3.74e-09 | 1.52e-07 | 156 |
| GO:000616312 | Liver | Cirrhotic | purine nucleotide metabolic process | 146/4634 | 396/18723 | 4.12e-08 | 1.34e-06 | 146 |
| GO:00463905 | Liver | Cirrhotic | ribose phosphate biosynthetic process | 71/4634 | 190/18723 | 7.09e-05 | 7.98e-04 | 71 |
| GO:00091654 | Liver | Cirrhotic | nucleotide biosynthetic process | 89/4634 | 254/18723 | 1.45e-04 | 1.40e-03 | 89 |
| GO:19012934 | Liver | Cirrhotic | nucleoside phosphate biosynthetic process | 89/4634 | 256/18723 | 1.97e-04 | 1.82e-03 | 89 |
| GO:00725225 | Liver | Cirrhotic | purine-containing compound biosynthetic process | 69/4634 | 200/18723 | 1.22e-03 | 8.24e-03 | 69 |
| GO:00061645 | Liver | Cirrhotic | purine nucleotide biosynthetic process | 65/4634 | 191/18723 | 2.42e-03 | 1.46e-02 | 65 |
| Page: 1 2 3 4 |
| Pathway ID | Tissue | Disease Stage | Description | Gene Ratio | Bg Ratio | pvalue | p.adjust | qvalue | Count |
| Page: 1 |
Top |
Cell-cell communication analysis |
| Identification of potential cell-cell interactions between two cell types and their ligand-receptor pairs for different disease states |
| Ligand | Receptor | LRpair | Pathway | Tissue | Disease Stage |
| Page: 1 |
Top |
Single-cell gene regulatory network inference analysis |
| Find out the significant the regulons (TFs) and the target genes of each regulon across cell types for different disease states |
| TF | Cell Type | Tissue | Disease Stage | Target Gene | RSS | Regulon Activity |
| ∗The dot plots of a searched regulon are shown for all cell subpopulations in each disease state of each tissue based on the regulon specific score inferred using pySCENIC and by calculating the average expression. |
| Page: 1 |
Top |
Somatic mutation of malignant transformation related genes |
| Annotation of somatic variants for genes involved in malignant transformation |
| Hugo Symbol | Variant Class | Variant Classification | dbSNP RS | HGVSc | HGVSp | HGVSp Short | SWISSPROT | BIOTYPE | SIFT | PolyPhen | Tumor Sample Barcode | Tissue | Histology | Sex | Age | Stage | Therapy Types | Drugs | Outcome |
| PRPSAP1 | SNV | Missense_Mutation | rs375906385 | c.662N>A | p.Arg221His | p.R221H | Q14558 | protein_coding | tolerated(0.09) | benign(0.233) | TCGA-C5-A7CJ-01 | Cervix | cervical & endocervical cancer | Female | <65 | I/II | Chemotherapy | cisplatin | SD |
| PRPSAP1 | SNV | Missense_Mutation | rs756361339 | c.836N>A | p.Arg279His | p.R279H | Q14558 | protein_coding | tolerated(0.07) | benign(0.09) | TCGA-AA-3811-01 | Colorectum | colon adenocarcinoma | Female | >=65 | III/IV | Unknown | Unknown | PD |
| PRPSAP1 | SNV | Missense_Mutation | c.589N>C | p.Tyr197His | p.Y197H | Q14558 | protein_coding | tolerated(0.07) | probably_damaging(0.978) | TCGA-AA-A00N-01 | Colorectum | colon adenocarcinoma | Male | >=65 | I/II | Unknown | Unknown | PD | |
| PRPSAP1 | SNV | Missense_Mutation | c.253C>T | p.Arg85Cys | p.R85C | Q14558 | protein_coding | deleterious(0) | probably_damaging(0.979) | TCGA-AA-A01R-01 | Colorectum | colon adenocarcinoma | Male | <65 | III/IV | Chemotherapy | 5-fluorouracil | PD | |
| PRPSAP1 | SNV | Missense_Mutation | novel | c.362N>C | p.Ile121Thr | p.I121T | Q14558 | protein_coding | deleterious(0.01) | benign(0.382) | TCGA-CA-6717-01 | Colorectum | colon adenocarcinoma | Male | <65 | I/II | Chemotherapy | oxaliplatin | CR |
| PRPSAP1 | SNV | Missense_Mutation | c.829N>A | p.Gly277Arg | p.G277R | Q14558 | protein_coding | tolerated(0.21) | benign(0.249) | TCGA-AF-2693-01 | Colorectum | rectum adenocarcinoma | Male | >=65 | I/II | Unknown | Unknown | SD | |
| PRPSAP1 | SNV | Missense_Mutation | rs375906385 | c.662N>A | p.Arg221His | p.R221H | Q14558 | protein_coding | tolerated(0.09) | benign(0.233) | TCGA-AH-6544-01 | Colorectum | rectum adenocarcinoma | Male | <65 | III/IV | Chemotherapy | oxaliplatin | SD |
| PRPSAP1 | insertion | Frame_Shift_Ins | novel | c.735_736insGGGG | p.Pro246GlyfsTer42 | p.P246Gfs*42 | Q14558 | protein_coding | TCGA-T9-A92H-01 | Colorectum | colon adenocarcinoma | Male | >=65 | I/II | Unknown | Unknown | PD | ||
| PRPSAP1 | SNV | Missense_Mutation | novel | c.493C>A | p.His165Asn | p.H165N | Q14558 | protein_coding | deleterious(0) | possibly_damaging(0.837) | TCGA-AJ-A23O-01 | Endometrium | uterine corpus endometrioid carcinoma | Female | >=65 | I/II | Unknown | Unknown | SD |
| PRPSAP1 | SNV | Missense_Mutation | novel | c.916G>A | p.Ala306Thr | p.A306T | Q14558 | protein_coding | deleterious(0) | probably_damaging(0.991) | TCGA-AJ-A3OK-01 | Endometrium | uterine corpus endometrioid carcinoma | Female | >=65 | I/II | Chemotherapy | carboplatin | CR |
| Page: 1 2 3 |
Top |
Related drugs of malignant transformation related genes |
| Identification of chemicals and drugs interact with genes involved in malignant transfromation |
| (DGIdb 4.0) |
| Entrez ID | Symbol | Category | Interaction Types | Drug Claim Name | Drug Name | PMIDs |
| Page: 1 |

Copyright 2023-Present -The University of Texas Health Science Center at Houston |