
|
|||||
|
 | |
| |
| |
| |
| |
| |
|
Gene: PPP2R4 |
Gene summary for PPP2R4 |
| Gene information | Species | Human | Gene symbol | PPP2R4 | Gene ID | 5524 |
| Gene name | protein phosphatase 2 phosphatase activator | |
| Gene Alias | PP2A | |
| Cytomap | 9q34.11 | |
| Gene Type | protein-coding | GO ID | GO:0000226 | UniProtAcc | F6WIT2 |
Top |
Malignant transformation analysis |
| Identification of the aberrant gene expression in precancerous and cancerous lesions by comparing the gene expression of stem-like cells in diseased tissues with normal stem cells |
| Entrez ID | Symbol | Replicates | Species | Organ | Tissue | Adj P-value | Log2FC | Malignancy |
| 5524 | PPP2R4 | C30 | Human | Oral cavity | OSCC | 8.41e-67 | 3.01e+00 | 0.3055 |
| 5524 | PPP2R4 | C38 | Human | Oral cavity | OSCC | 4.68e-09 | 7.29e-01 | 0.172 |
| 5524 | PPP2R4 | C43 | Human | Oral cavity | OSCC | 6.51e-26 | 5.09e-01 | 0.1704 |
| 5524 | PPP2R4 | C46 | Human | Oral cavity | OSCC | 1.99e-25 | 5.40e-01 | 0.1673 |
| 5524 | PPP2R4 | C51 | Human | Oral cavity | OSCC | 2.73e-25 | 1.12e+00 | 0.2674 |
| 5524 | PPP2R4 | C57 | Human | Oral cavity | OSCC | 6.44e-11 | 3.74e-01 | 0.1679 |
| 5524 | PPP2R4 | C06 | Human | Oral cavity | OSCC | 1.80e-12 | 1.91e+00 | 0.2699 |
| 5524 | PPP2R4 | C07 | Human | Oral cavity | OSCC | 8.60e-04 | 6.39e-01 | 0.2491 |
| 5524 | PPP2R4 | C08 | Human | Oral cavity | OSCC | 1.26e-28 | 5.79e-01 | 0.1919 |
| 5524 | PPP2R4 | C09 | Human | Oral cavity | OSCC | 6.69e-12 | 4.30e-01 | 0.1431 |
| 5524 | PPP2R4 | LN22 | Human | Oral cavity | OSCC | 2.10e-04 | 7.51e-01 | 0.1733 |
| 5524 | PPP2R4 | LN46 | Human | Oral cavity | OSCC | 8.33e-15 | 5.68e-01 | 0.1666 |
| 5524 | PPP2R4 | LP15 | Human | Oral cavity | LP | 4.03e-08 | 1.22e+00 | 0.2174 |
| 5524 | PPP2R4 | LP16 | Human | Oral cavity | LP | 2.06e-02 | 6.98e-01 | 0.1055 |
| 5524 | PPP2R4 | LP17 | Human | Oral cavity | LP | 1.69e-05 | 5.28e-01 | 0.2349 |
| 5524 | PPP2R4 | SYSMH1 | Human | Oral cavity | OSCC | 2.87e-24 | 6.23e-01 | 0.1127 |
| 5524 | PPP2R4 | SYSMH2 | Human | Oral cavity | OSCC | 1.32e-24 | 6.54e-01 | 0.2326 |
| 5524 | PPP2R4 | SYSMH3 | Human | Oral cavity | OSCC | 3.96e-28 | 7.01e-01 | 0.2442 |
| 5524 | PPP2R4 | SYSMH5 | Human | Oral cavity | OSCC | 5.67e-05 | 2.36e-01 | 0.0647 |
| 5524 | PPP2R4 | SYSMH6 | Human | Oral cavity | OSCC | 1.16e-09 | 2.86e-01 | 0.1275 |
| Page: 1 2 3 4 5 |
| Tissue | Expression Dynamics | Abbreviation |
| Esophagus | 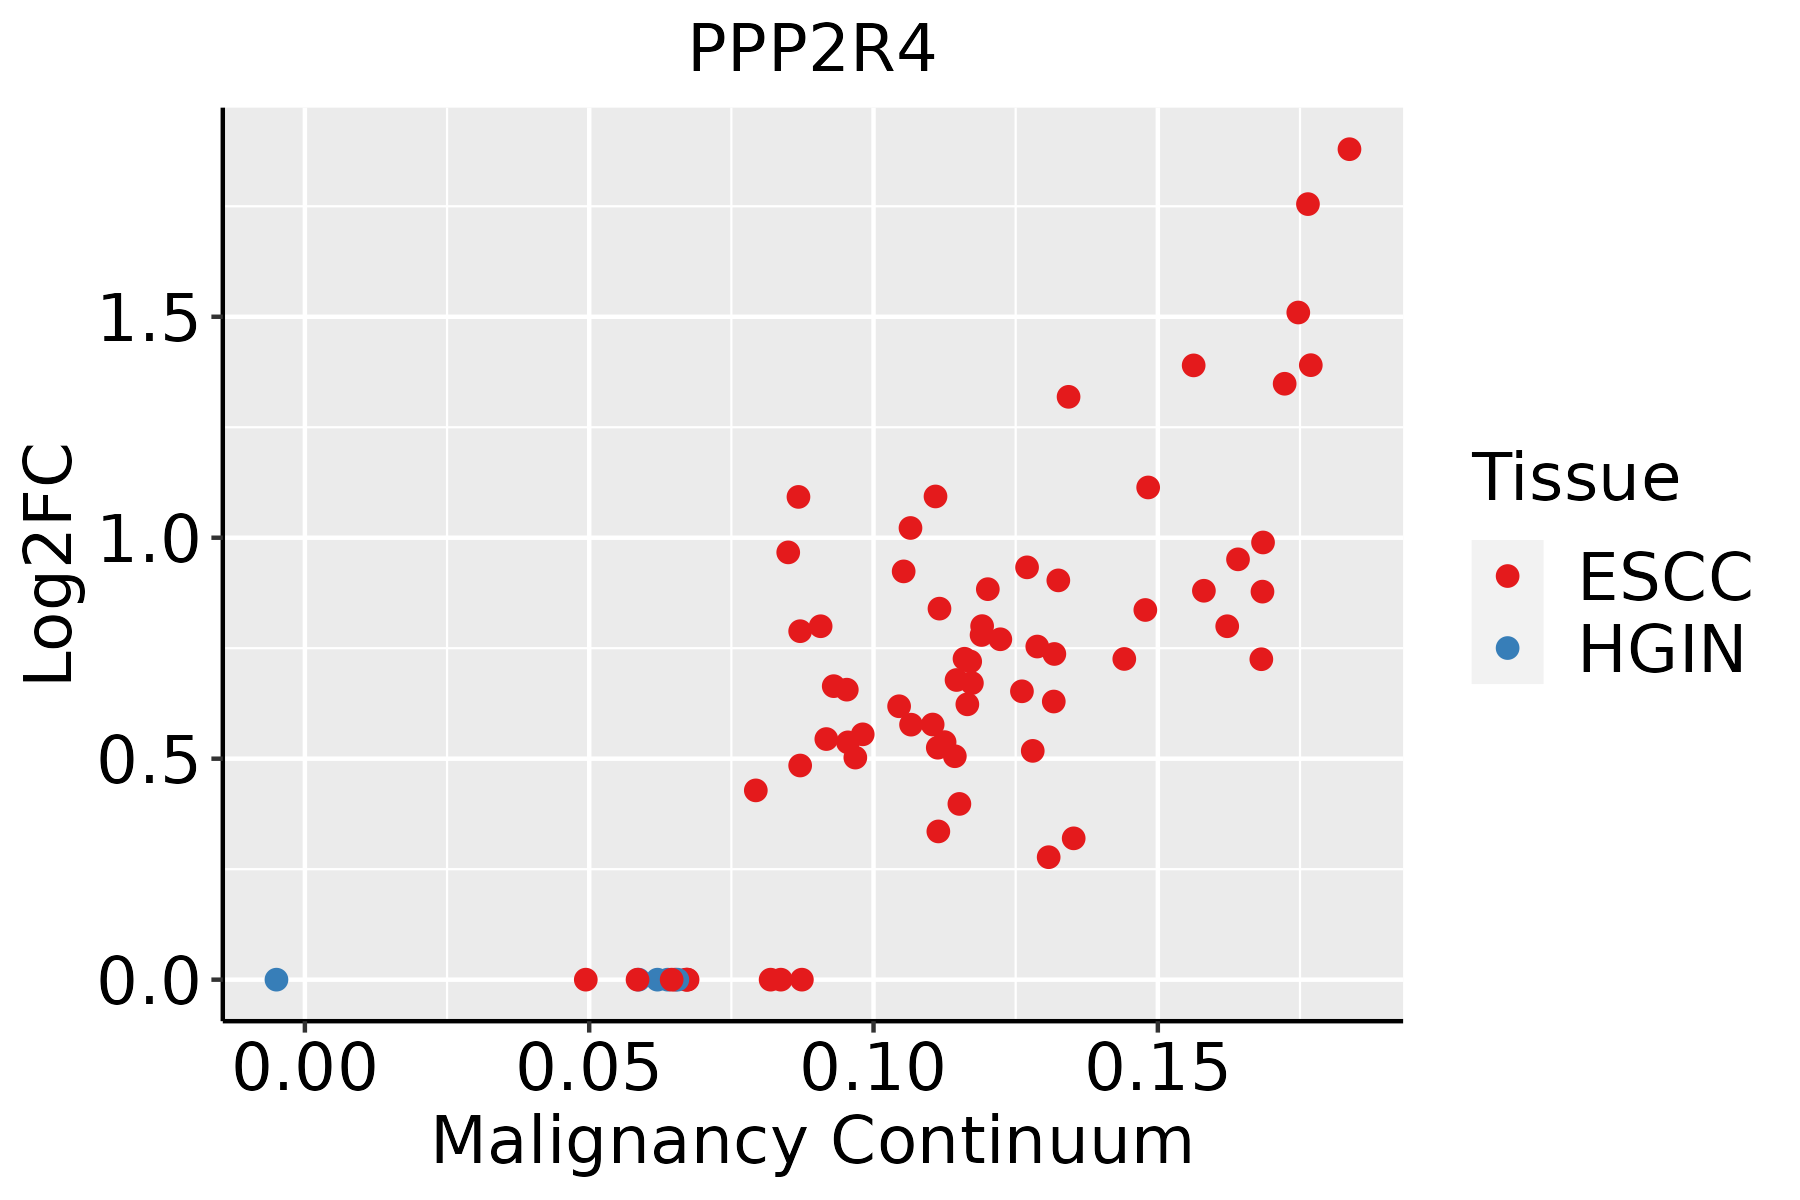 | ESCC: Esophageal squamous cell carcinoma |
| HGIN: High-grade intraepithelial neoplasias | ||
| LGIN: Low-grade intraepithelial neoplasias | ||
| Oral Cavity |  | EOLP: Erosive Oral lichen planus |
| LP: leukoplakia | ||
| NEOLP: Non-erosive oral lichen planus | ||
| OSCC: Oral squamous cell carcinoma | ||
| Prostate | 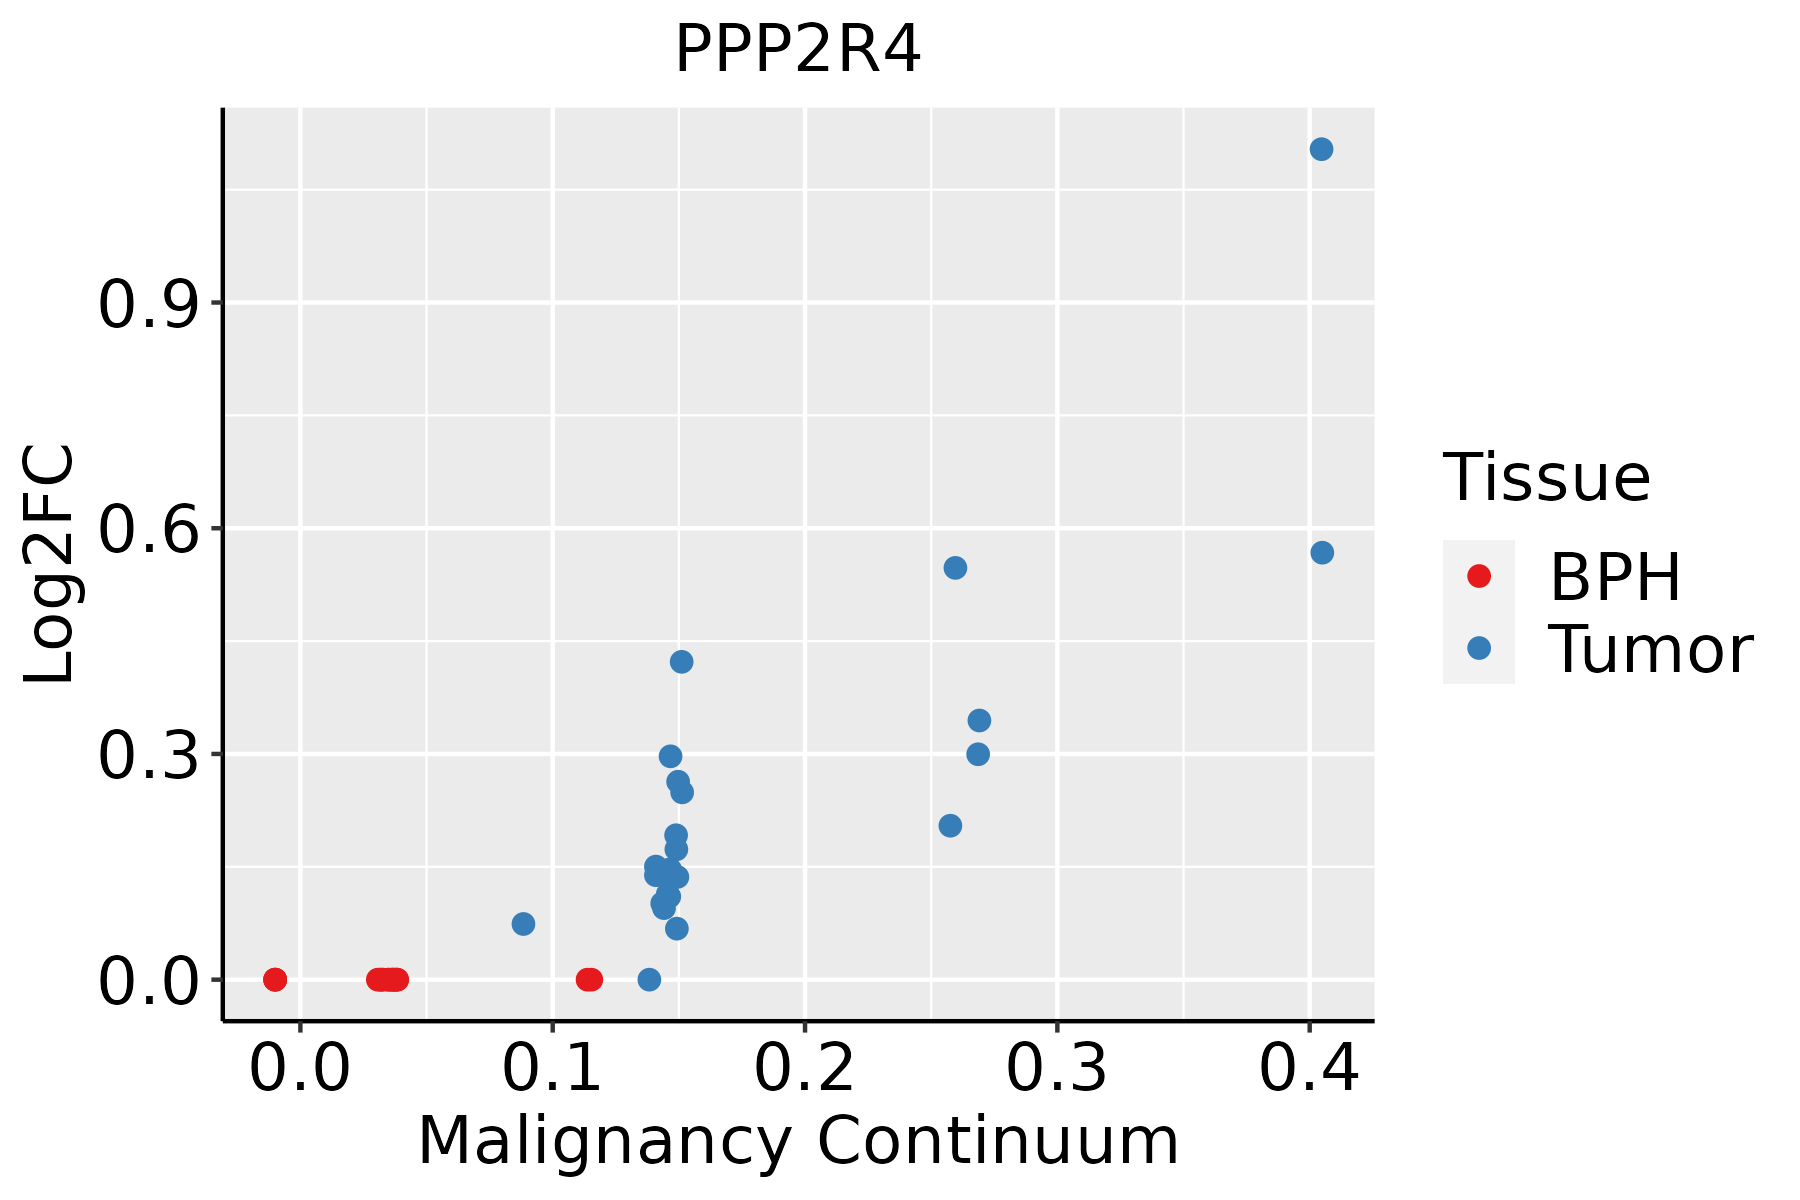 | BPH: Benign Prostatic Hyperplasia |
| Skin | 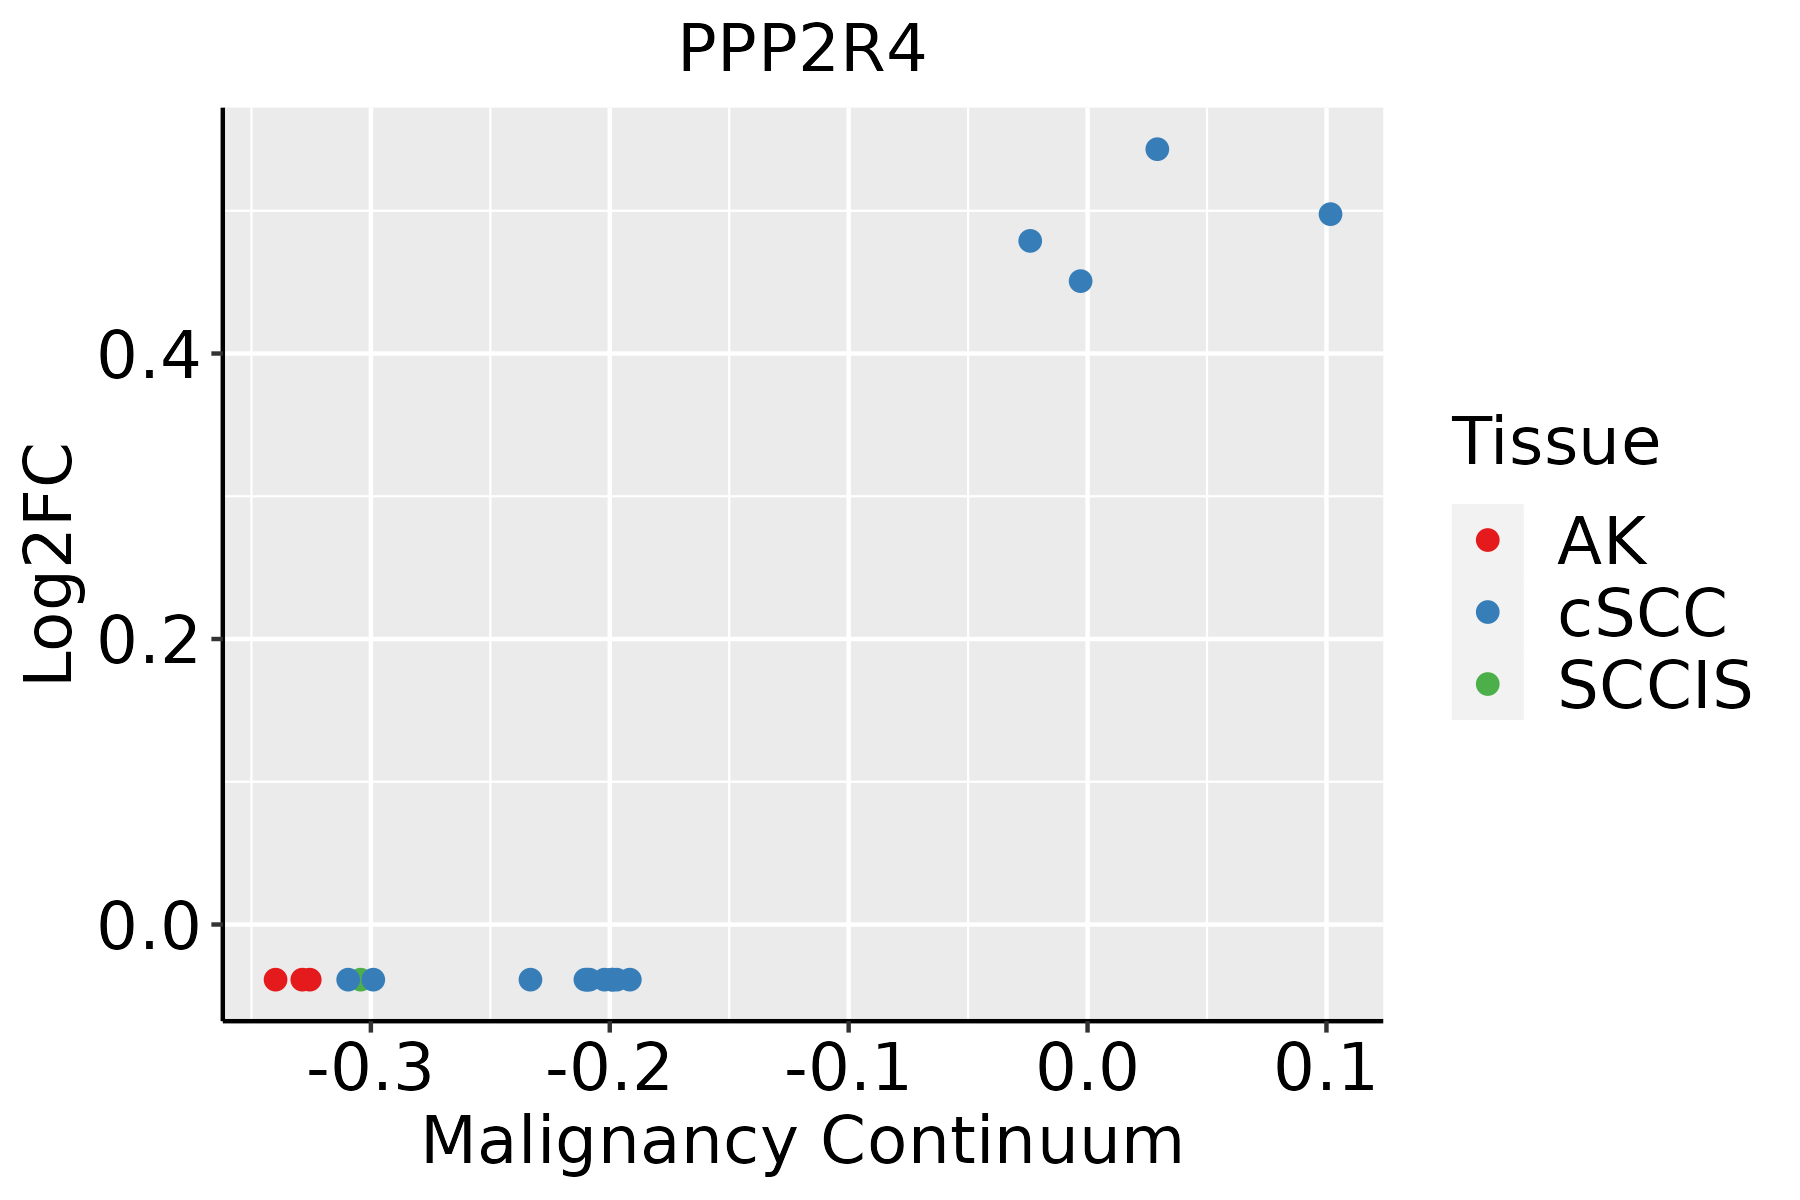 | AK: Actinic keratosis |
| cSCC: Cutaneous squamous cell carcinoma | ||
| SCCIS:squamous cell carcinoma in situ |
| ∗log2FC in expression of this searched gene in stem-like cells from each diseased tissue sample relative to stem-like cells in normal samples in each tissue plotted against the malignancy continuum. Samples are colored based on if they are from different disease stage. |
Top |
Malignant transformation related pathway analysis |
| Find out the enriched GO biological processes and KEGG pathways involved in transition from healthy to precancer to cancer |
| Tissue | Disease Stage | Enriched GO biological Processes |
| Colorectum | AD |  |
| Colorectum | SER |  |
| Colorectum | MSS |  |
| Colorectum | MSI-H |  |
| Colorectum | FAP |  |
| ∗Top 15 enriched GO BP terms are showed in the bar plot of each disease state in each tissue. Each row represents a significant GO biological process which is colored according to the -log10(p.adjust). |
| Page: 1 2 3 4 5 6 7 8 9 |
| GO ID | Tissue | Disease Stage | Description | Gene Ratio | Bg Ratio | pvalue | p.adjust | Count |
| Page: 1 |
| Pathway ID | Tissue | Disease Stage | Description | Gene Ratio | Bg Ratio | pvalue | p.adjust | qvalue | Count |
| hsa05415 | Colorectum | AD | Diabetic cardiomyopathy | 114/2092 | 203/8465 | 3.65e-22 | 3.06e-20 | 1.95e-20 | 114 |
| hsa054151 | Colorectum | AD | Diabetic cardiomyopathy | 114/2092 | 203/8465 | 3.65e-22 | 3.06e-20 | 1.95e-20 | 114 |
| hsa054152 | Colorectum | SER | Diabetic cardiomyopathy | 103/1580 | 203/8465 | 1.45e-25 | 1.61e-23 | 1.17e-23 | 103 |
| hsa054153 | Colorectum | SER | Diabetic cardiomyopathy | 103/1580 | 203/8465 | 1.45e-25 | 1.61e-23 | 1.17e-23 | 103 |
| hsa054154 | Colorectum | MSS | Diabetic cardiomyopathy | 106/1875 | 203/8465 | 2.47e-21 | 1.62e-19 | 9.92e-20 | 106 |
| hsa04931 | Colorectum | MSS | Insulin resistance | 36/1875 | 108/8465 | 4.74e-03 | 2.01e-02 | 1.23e-02 | 36 |
| hsa054155 | Colorectum | MSS | Diabetic cardiomyopathy | 106/1875 | 203/8465 | 2.47e-21 | 1.62e-19 | 9.92e-20 | 106 |
| hsa049311 | Colorectum | MSS | Insulin resistance | 36/1875 | 108/8465 | 4.74e-03 | 2.01e-02 | 1.23e-02 | 36 |
| hsa054156 | Colorectum | MSI-H | Diabetic cardiomyopathy | 57/797 | 203/8465 | 1.15e-14 | 3.11e-13 | 2.61e-13 | 57 |
| hsa054157 | Colorectum | MSI-H | Diabetic cardiomyopathy | 57/797 | 203/8465 | 1.15e-14 | 3.11e-13 | 2.61e-13 | 57 |
| hsa0541525 | Endometrium | AEH | Diabetic cardiomyopathy | 86/1197 | 203/8465 | 2.62e-23 | 1.22e-21 | 8.90e-22 | 86 |
| hsa05415111 | Endometrium | AEH | Diabetic cardiomyopathy | 86/1197 | 203/8465 | 2.62e-23 | 1.22e-21 | 8.90e-22 | 86 |
| hsa0541526 | Endometrium | EEC | Diabetic cardiomyopathy | 86/1237 | 203/8465 | 2.59e-22 | 9.46e-21 | 7.05e-21 | 86 |
| hsa0541535 | Endometrium | EEC | Diabetic cardiomyopathy | 86/1237 | 203/8465 | 2.59e-22 | 9.46e-21 | 7.05e-21 | 86 |
| hsa0541522 | Liver | HCC | Diabetic cardiomyopathy | 151/4020 | 203/8465 | 2.72e-15 | 1.01e-13 | 5.63e-14 | 151 |
| hsa0541532 | Liver | HCC | Diabetic cardiomyopathy | 151/4020 | 203/8465 | 2.72e-15 | 1.01e-13 | 5.63e-14 | 151 |
| Page: 1 |
Top |
Cell-cell communication analysis |
| Identification of potential cell-cell interactions between two cell types and their ligand-receptor pairs for different disease states |
| Ligand | Receptor | LRpair | Pathway | Tissue | Disease Stage |
| Page: 1 |
Top |
Single-cell gene regulatory network inference analysis |
| Find out the significant the regulons (TFs) and the target genes of each regulon across cell types for different disease states |
| TF | Cell Type | Tissue | Disease Stage | Target Gene | RSS | Regulon Activity |
| ∗The dot plots of a searched regulon are shown for all cell subpopulations in each disease state of each tissue based on the regulon specific score inferred using pySCENIC and by calculating the average expression. |
| Page: 1 |
Top |
Somatic mutation of malignant transformation related genes |
| Annotation of somatic variants for genes involved in malignant transformation |
| Hugo Symbol | Variant Class | Variant Classification | dbSNP RS | HGVSc | HGVSp | HGVSp Short | SWISSPROT | BIOTYPE | SIFT | PolyPhen | Tumor Sample Barcode | Tissue | Histology | Sex | Age | Stage | Therapy Types | Drugs | Outcome |
| Page: 1 |
Top |
Related drugs of malignant transformation related genes |
| Identification of chemicals and drugs interact with genes involved in malignant transfromation |
| (DGIdb 4.0) |
| Entrez ID | Symbol | Category | Interaction Types | Drug Claim Name | Drug Name | PMIDs |
| Page: 1 |

Copyright 2023-Present -The University of Texas Health Science Center at Houston |