
|
|||||
|
 | |
| |
| |
| |
| |
| |
|
Gene: PPP1R1B |
Gene summary for PPP1R1B |
| Gene information | Species | Human | Gene symbol | PPP1R1B | Gene ID | 84152 |
| Gene name | protein phosphatase 1 regulatory inhibitor subunit 1B | |
| Gene Alias | DARPP-32 | |
| Cytomap | 17q12 | |
| Gene Type | protein-coding | GO ID | GO:0000003 | UniProtAcc | A0A024R1R3 |
Top |
Malignant transformation analysis |
| Identification of the aberrant gene expression in precancerous and cancerous lesions by comparing the gene expression of stem-like cells in diseased tissues with normal stem cells |
| Entrez ID | Symbol | Replicates | Species | Organ | Tissue | Adj P-value | Log2FC | Malignancy |
| 84152 | PPP1R1B | HTA11_99999965104_69814 | Human | Colorectum | MSS | 3.38e-25 | 8.56e-01 | 0.281 |
| 84152 | PPP1R1B | HTA11_99999971662_82457 | Human | Colorectum | MSS | 1.62e-32 | 1.14e+00 | 0.3859 |
| 84152 | PPP1R1B | HTA11_99999973899_84307 | Human | Colorectum | MSS | 5.44e-15 | 1.00e+00 | 0.2585 |
| 84152 | PPP1R1B | HTA11_99999974143_84620 | Human | Colorectum | MSS | 7.74e-03 | 3.91e-01 | 0.3005 |
| 84152 | PPP1R1B | A015-C-203 | Human | Colorectum | FAP | 1.46e-04 | 3.11e-02 | -0.1294 |
| 84152 | PPP1R1B | A001-C-108 | Human | Colorectum | FAP | 2.68e-02 | -1.72e-01 | -0.0272 |
| 84152 | PPP1R1B | A002-C-205 | Human | Colorectum | FAP | 1.11e-02 | -2.29e-01 | -0.1236 |
| 84152 | PPP1R1B | A015-C-104 | Human | Colorectum | FAP | 2.52e-05 | -1.47e-01 | -0.1899 |
| 84152 | PPP1R1B | A001-C-014 | Human | Colorectum | FAP | 4.03e-03 | -1.72e-01 | 0.0135 |
| 84152 | PPP1R1B | A002-C-016 | Human | Colorectum | FAP | 1.09e-02 | -4.20e-02 | 0.0521 |
| 84152 | PPP1R1B | A001-C-203 | Human | Colorectum | FAP | 9.76e-05 | -1.65e-01 | -0.0481 |
| 84152 | PPP1R1B | A002-C-116 | Human | Colorectum | FAP | 2.30e-06 | -9.22e-02 | -0.0452 |
| 84152 | PPP1R1B | F034 | Human | Colorectum | FAP | 5.73e-06 | -1.14e-01 | -0.0665 |
| 84152 | PPP1R1B | P12T-E | Human | Esophagus | ESCC | 3.73e-02 | 5.99e-02 | 0.1122 |
| 84152 | PPP1R1B | P16T-E | Human | Esophagus | ESCC | 1.38e-25 | 8.56e-01 | 0.1153 |
| 84152 | PPP1R1B | P56T-E | Human | Esophagus | ESCC | 1.81e-02 | 2.81e-01 | 0.1613 |
| 84152 | PPP1R1B | P57T-E | Human | Esophagus | ESCC | 1.17e-14 | 6.44e-01 | 0.0926 |
| 84152 | PPP1R1B | P62T-E | Human | Esophagus | ESCC | 5.24e-03 | -1.34e-01 | 0.1302 |
| 84152 | PPP1R1B | P65T-E | Human | Esophagus | ESCC | 3.50e-02 | 3.29e-01 | 0.0978 |
| 84152 | PPP1R1B | P74T-E | Human | Esophagus | ESCC | 1.47e-08 | 7.45e-02 | 0.1479 |
| Page: 1 2 3 4 5 6 |
| Tissue | Expression Dynamics | Abbreviation |
| Breast |  | IDC: Invasive ductal carcinoma |
| DCIS: Ductal carcinoma in situ | ||
| Precancer(BRCA1-mut): Precancerous lesion from BRCA1 mutation carriers | ||
| Colorectum (GSE201348) |  | FAP: Familial adenomatous polyposis |
| CRC: Colorectal cancer | ||
| Colorectum (HTA11) |  | AD: Adenomas |
| SER: Sessile serrated lesions | ||
| MSI-H: Microsatellite-high colorectal cancer | ||
| MSS: Microsatellite stable colorectal cancer | ||
| Esophagus |  | ESCC: Esophageal squamous cell carcinoma |
| HGIN: High-grade intraepithelial neoplasias | ||
| LGIN: Low-grade intraepithelial neoplasias | ||
| GC | 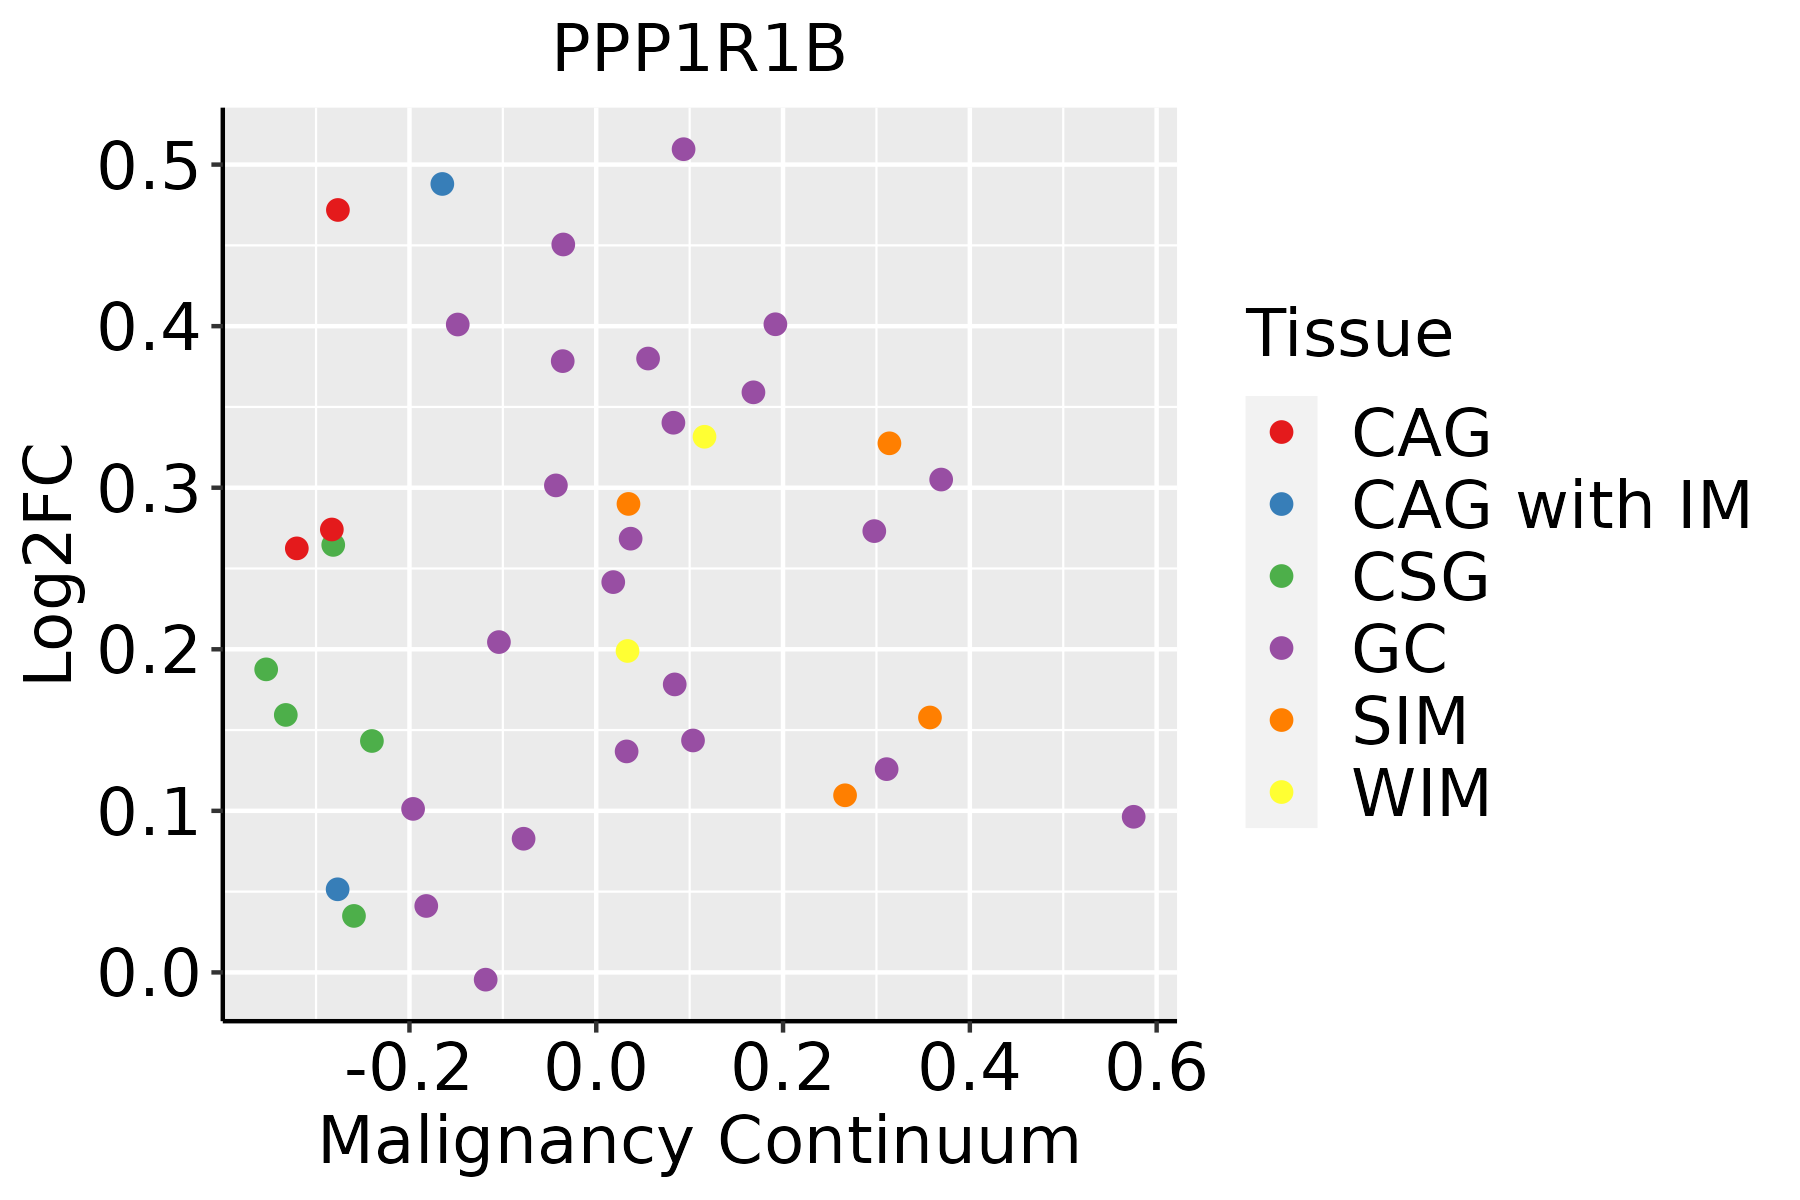 | CAG: Chronic atrophic gastritis |
| CAG with IM: Chronic atrophic gastritis with intestinal metaplasia | ||
| CSG: Chronic superficial gastritis | ||
| GC: Gastric cancer | ||
| SIM: Severe intestinal metaplasia | ||
| WIM: Wild intestinal metaplasia | ||
| Liver | 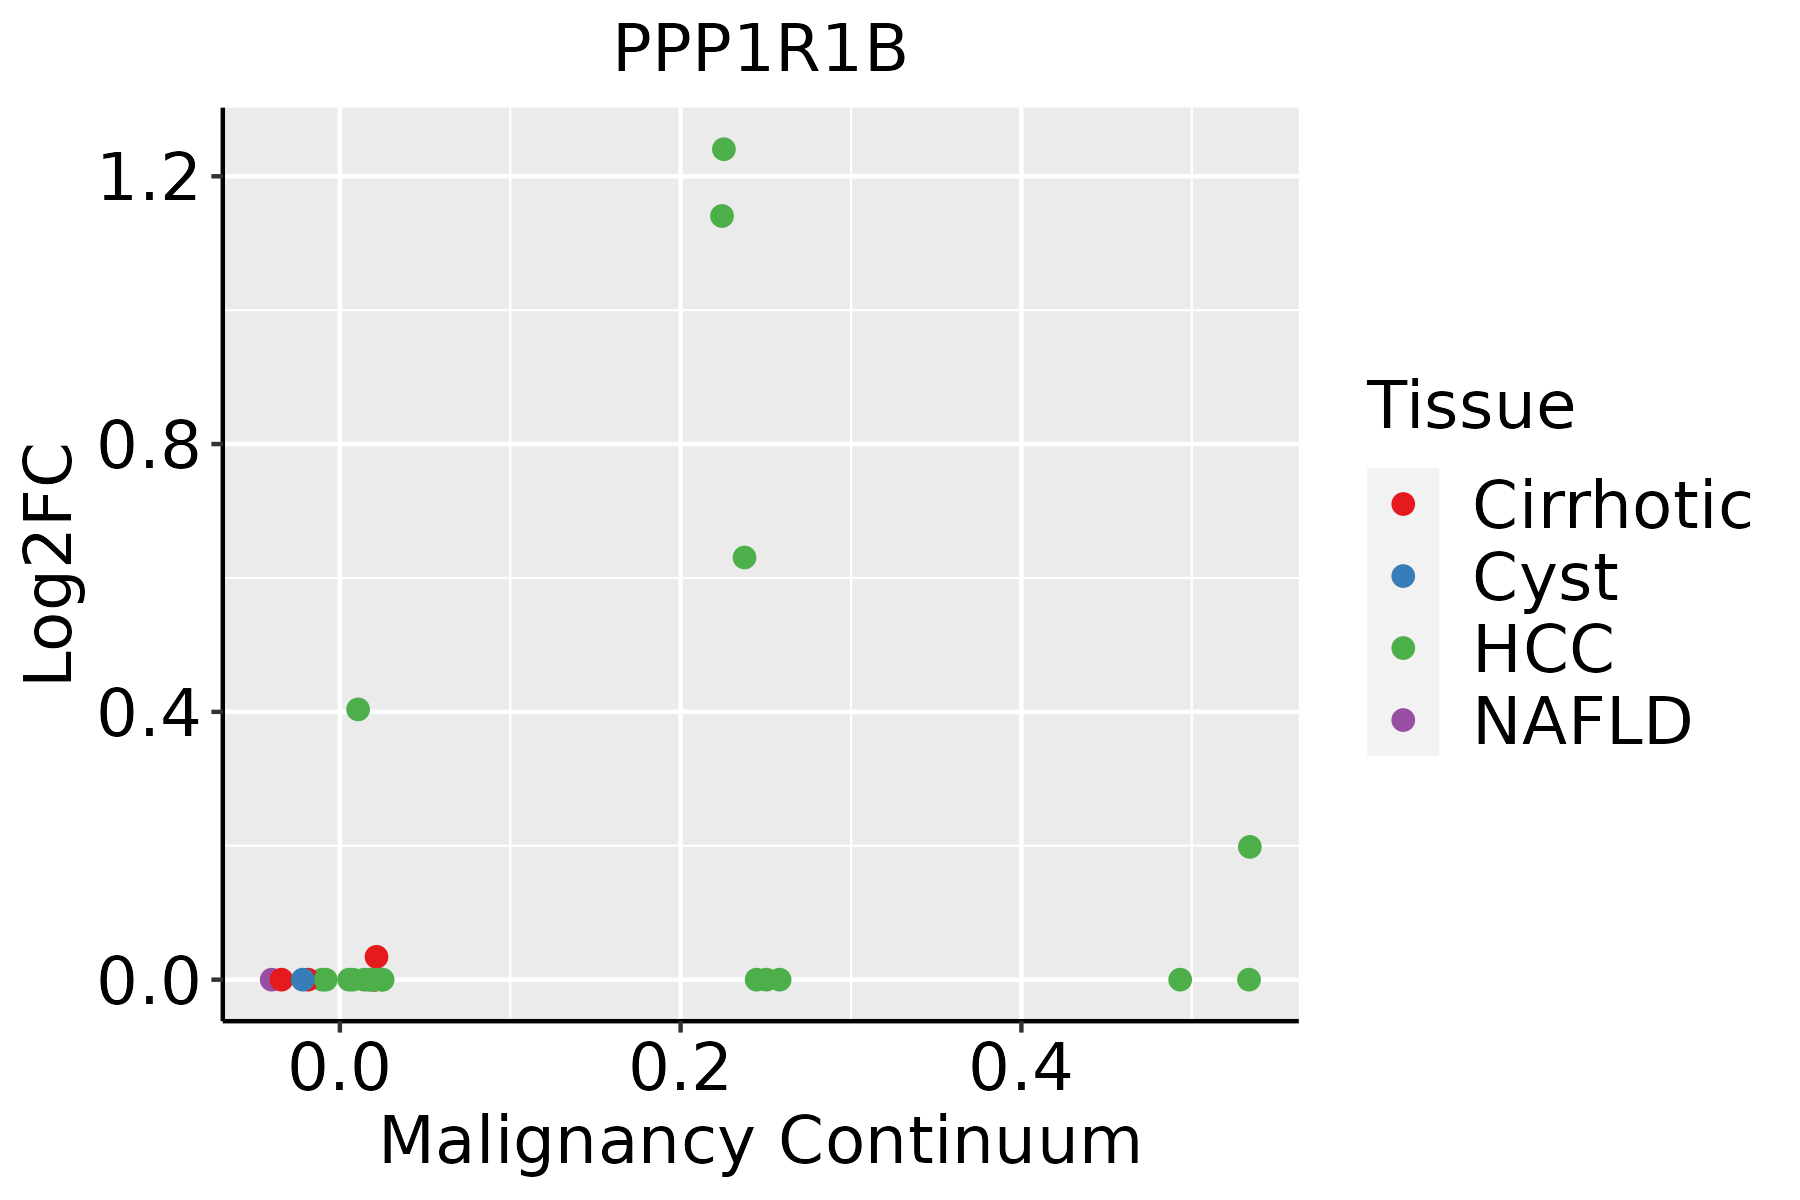 | HCC: Hepatocellular carcinoma |
| NAFLD: Non-alcoholic fatty liver disease | ||
| Prostate |  | BPH: Benign Prostatic Hyperplasia |
| ∗log2FC in expression of this searched gene in stem-like cells from each diseased tissue sample relative to stem-like cells in normal samples in each tissue plotted against the malignancy continuum. Samples are colored based on if they are from different disease stage. |
Top |
Malignant transformation related pathway analysis |
| Find out the enriched GO biological processes and KEGG pathways involved in transition from healthy to precancer to cancer |
| Tissue | Disease Stage | Enriched GO biological Processes |
| Colorectum | AD |  |
| Colorectum | SER |  |
| Colorectum | MSS |  |
| Colorectum | MSI-H |  |
| Colorectum | FAP |  |
| ∗Top 15 enriched GO BP terms are showed in the bar plot of each disease state in each tissue. Each row represents a significant GO biological process which is colored according to the -log10(p.adjust). |
| Page: 1 2 3 4 5 6 7 8 9 |
| GO ID | Tissue | Disease Stage | Description | Gene Ratio | Bg Ratio | pvalue | p.adjust | Count |
| GO:00513468 | Breast | Precancer | negative regulation of hydrolase activity | 50/1080 | 379/18723 | 3.85e-08 | 2.34e-06 | 50 |
| GO:00093148 | Breast | Precancer | response to radiation | 47/1080 | 456/18723 | 8.39e-05 | 1.62e-03 | 47 |
| GO:00353049 | Breast | Precancer | regulation of protein dephosphorylation | 14/1080 | 90/18723 | 6.16e-04 | 7.72e-03 | 14 |
| GO:00140753 | Breast | Precancer | response to amine | 9/1080 | 49/18723 | 1.74e-03 | 1.74e-02 | 9 |
| GO:0001975 | Breast | Precancer | response to amphetamine | 7/1080 | 33/18723 | 2.37e-03 | 2.19e-02 | 7 |
| GO:00353086 | Breast | Precancer | negative regulation of protein dephosphorylation | 7/1080 | 34/18723 | 2.84e-03 | 2.49e-02 | 7 |
| GO:00513489 | Breast | Precancer | negative regulation of transferase activity | 27/1080 | 268/18723 | 3.49e-03 | 2.90e-02 | 27 |
| GO:00436667 | Breast | Precancer | regulation of phosphoprotein phosphatase activity | 9/1080 | 58/18723 | 5.67e-03 | 4.08e-02 | 9 |
| GO:005134613 | Breast | IDC | negative regulation of hydrolase activity | 71/1434 | 379/18723 | 1.33e-12 | 2.90e-10 | 71 |
| GO:000931412 | Breast | IDC | response to radiation | 62/1434 | 456/18723 | 6.91e-06 | 2.10e-04 | 62 |
| GO:005134814 | Breast | IDC | negative regulation of transferase activity | 39/1434 | 268/18723 | 7.89e-05 | 1.56e-03 | 39 |
| GO:003530414 | Breast | IDC | regulation of protein dephosphorylation | 18/1434 | 90/18723 | 1.39e-04 | 2.48e-03 | 18 |
| GO:00459369 | Breast | IDC | negative regulation of phosphate metabolic process | 53/1434 | 441/18723 | 7.21e-04 | 8.79e-03 | 53 |
| GO:00105639 | Breast | IDC | negative regulation of phosphorus metabolic process | 53/1434 | 442/18723 | 7.60e-04 | 9.25e-03 | 53 |
| GO:003530813 | Breast | IDC | negative regulation of protein dephosphorylation | 9/1434 | 34/18723 | 8.01e-04 | 9.58e-03 | 9 |
| GO:00140751 | Breast | IDC | response to amine | 11/1434 | 49/18723 | 9.88e-04 | 1.11e-02 | 11 |
| GO:004366613 | Breast | IDC | regulation of phosphoprotein phosphatase activity | 12/1434 | 58/18723 | 1.27e-03 | 1.35e-02 | 12 |
| GO:00064699 | Breast | IDC | negative regulation of protein kinase activity | 27/1434 | 212/18723 | 6.30e-03 | 4.47e-02 | 27 |
| GO:00353052 | Breast | IDC | negative regulation of dephosphorylation | 9/1434 | 45/18723 | 6.33e-03 | 4.47e-02 | 9 |
| GO:005134623 | Breast | DCIS | negative regulation of hydrolase activity | 64/1390 | 379/18723 | 4.32e-10 | 4.80e-08 | 64 |
| Page: 1 2 3 4 5 6 7 8 9 10 11 12 13 14 |
| Pathway ID | Tissue | Disease Stage | Description | Gene Ratio | Bg Ratio | pvalue | p.adjust | qvalue | Count |
| hsa050312 | Breast | IDC | Amphetamine addiction | 18/867 | 69/8465 | 1.42e-04 | 1.36e-03 | 1.01e-03 | 18 |
| hsa050313 | Breast | IDC | Amphetamine addiction | 18/867 | 69/8465 | 1.42e-04 | 1.36e-03 | 1.01e-03 | 18 |
| hsa050314 | Breast | DCIS | Amphetamine addiction | 17/846 | 69/8465 | 3.37e-04 | 2.72e-03 | 2.00e-03 | 17 |
| hsa050315 | Breast | DCIS | Amphetamine addiction | 17/846 | 69/8465 | 3.37e-04 | 2.72e-03 | 2.00e-03 | 17 |
| hsa04728 | Colorectum | AD | Dopaminergic synapse | 46/2092 | 132/8465 | 5.55e-03 | 2.48e-02 | 1.58e-02 | 46 |
| hsa047281 | Colorectum | AD | Dopaminergic synapse | 46/2092 | 132/8465 | 5.55e-03 | 2.48e-02 | 1.58e-02 | 46 |
| hsa047282 | Colorectum | SER | Dopaminergic synapse | 37/1580 | 132/8465 | 5.27e-03 | 3.28e-02 | 2.38e-02 | 37 |
| hsa047283 | Colorectum | SER | Dopaminergic synapse | 37/1580 | 132/8465 | 5.27e-03 | 3.28e-02 | 2.38e-02 | 37 |
| hsa047284 | Colorectum | MSS | Dopaminergic synapse | 45/1875 | 132/8465 | 1.02e-03 | 5.94e-03 | 3.64e-03 | 45 |
| hsa047285 | Colorectum | MSS | Dopaminergic synapse | 45/1875 | 132/8465 | 1.02e-03 | 5.94e-03 | 3.64e-03 | 45 |
| hsa047286 | Colorectum | FAP | Dopaminergic synapse | 34/1404 | 132/8465 | 4.59e-03 | 1.89e-02 | 1.15e-02 | 34 |
| hsa04024 | Colorectum | FAP | cAMP signaling pathway | 51/1404 | 225/8465 | 1.02e-02 | 3.68e-02 | 2.24e-02 | 51 |
| hsa047287 | Colorectum | FAP | Dopaminergic synapse | 34/1404 | 132/8465 | 4.59e-03 | 1.89e-02 | 1.15e-02 | 34 |
| hsa040241 | Colorectum | FAP | cAMP signaling pathway | 51/1404 | 225/8465 | 1.02e-02 | 3.68e-02 | 2.24e-02 | 51 |
| hsa050316 | Prostate | BPH | Amphetamine addiction | 25/1718 | 69/8465 | 1.52e-03 | 6.27e-03 | 3.88e-03 | 25 |
| hsa0472810 | Prostate | BPH | Dopaminergic synapse | 38/1718 | 132/8465 | 1.19e-02 | 3.55e-02 | 2.20e-02 | 38 |
| hsa0503111 | Prostate | BPH | Amphetamine addiction | 25/1718 | 69/8465 | 1.52e-03 | 6.27e-03 | 3.88e-03 | 25 |
| hsa0472811 | Prostate | BPH | Dopaminergic synapse | 38/1718 | 132/8465 | 1.19e-02 | 3.55e-02 | 2.20e-02 | 38 |
| hsa0503121 | Prostate | Tumor | Amphetamine addiction | 25/1791 | 69/8465 | 2.78e-03 | 1.05e-02 | 6.48e-03 | 25 |
| hsa0503131 | Prostate | Tumor | Amphetamine addiction | 25/1791 | 69/8465 | 2.78e-03 | 1.05e-02 | 6.48e-03 | 25 |
| Page: 1 |
Top |
Cell-cell communication analysis |
| Identification of potential cell-cell interactions between two cell types and their ligand-receptor pairs for different disease states |
| Ligand | Receptor | LRpair | Pathway | Tissue | Disease Stage |
| Page: 1 |
Top |
Single-cell gene regulatory network inference analysis |
| Find out the significant the regulons (TFs) and the target genes of each regulon across cell types for different disease states |
| TF | Cell Type | Tissue | Disease Stage | Target Gene | RSS | Regulon Activity |
| ∗The dot plots of a searched regulon are shown for all cell subpopulations in each disease state of each tissue based on the regulon specific score inferred using pySCENIC and by calculating the average expression. |
| Page: 1 |
Top |
Somatic mutation of malignant transformation related genes |
| Annotation of somatic variants for genes involved in malignant transformation |
| Hugo Symbol | Variant Class | Variant Classification | dbSNP RS | HGVSc | HGVSp | HGVSp Short | SWISSPROT | BIOTYPE | SIFT | PolyPhen | Tumor Sample Barcode | Tissue | Histology | Sex | Age | Stage | Therapy Types | Drugs | Outcome |
| PPP1R1B | SNV | Missense_Mutation | novel | c.524N>G | p.Asp175Gly | p.D175G | Q9UD71 | protein_coding | tolerated_low_confidence(0.26) | probably_damaging(0.925) | TCGA-AC-A6IW-01 | Breast | breast invasive carcinoma | Female | >=65 | I/II | Unknown | Unknown | SD |
| PPP1R1B | SNV | Missense_Mutation | novel | c.146N>G | p.Glu49Gly | p.E49G | Q9UD71 | protein_coding | deleterious(0.03) | probably_damaging(0.995) | TCGA-CM-6171-01 | Colorectum | colon adenocarcinoma | Female | >=65 | I/II | Unknown | Unknown | SD |
| PPP1R1B | SNV | Missense_Mutation | c.33N>A | p.Phe11Leu | p.F11L | Q9UD71 | protein_coding | deleterious(0) | probably_damaging(0.973) | TCGA-EI-6917-01 | Colorectum | rectum adenocarcinoma | Male | <65 | III/IV | Chemotherapy | 5fluorouracil+oxaciplatina+l-folinian | SD | |
| PPP1R1B | deletion | Frame_Shift_Del | novel | c.287_290delNNNN | p.Asn97ArgfsTer45 | p.N97Rfs*45 | Q9UD71 | protein_coding | TCGA-5M-AAT4-01 | Colorectum | colon adenocarcinoma | Male | >=65 | III/IV | Unknown | Unknown | PD | ||
| PPP1R1B | SNV | Missense_Mutation | novel | c.169N>A | p.Ala57Thr | p.A57T | Q9UD71 | protein_coding | tolerated(0.31) | benign(0.01) | TCGA-A5-A0GG-01 | Endometrium | uterine corpus endometrioid carcinoma | Female | >=65 | I/II | Unknown | Unknown | SD |
| PPP1R1B | SNV | Missense_Mutation | rs200974893 | c.197N>T | p.Ser66Leu | p.S66L | Q9UD71 | protein_coding | tolerated(0.12) | benign(0.355) | TCGA-AP-A059-01 | Endometrium | uterine corpus endometrioid carcinoma | Female | >=65 | I/II | Unknown | Unknown | SD |
| PPP1R1B | SNV | Missense_Mutation | c.33C>A | p.Phe11Leu | p.F11L | Q9UD71 | protein_coding | deleterious(0) | probably_damaging(0.973) | TCGA-B5-A0JY-01 | Endometrium | uterine corpus endometrioid carcinoma | Female | <65 | III/IV | Chemotherapy | doxorubicin | SD | |
| PPP1R1B | SNV | Missense_Mutation | novel | c.430N>A | p.Val144Ile | p.V144I | Q9UD71 | protein_coding | tolerated_low_confidence(0.68) | benign(0.001) | TCGA-E6-A2P9-01 | Endometrium | uterine corpus endometrioid carcinoma | Female | >=65 | I/II | Unknown | Unknown | SD |
| PPP1R1B | SNV | Missense_Mutation | novel | c.429N>T | p.Lys143Asn | p.K143N | Q9UD71 | protein_coding | deleterious_low_confidence(0.01) | probably_damaging(0.997) | TCGA-EO-A22R-01 | Endometrium | uterine corpus endometrioid carcinoma | Female | <65 | I/II | Unknown | Unknown | SD |
| PPP1R1B | SNV | Missense_Mutation | rs367543179 | c.86N>T | p.Arg29Leu | p.R29L | Q9UD71 | protein_coding | deleterious(0) | probably_damaging(0.995) | TCGA-EO-A3AU-01 | Endometrium | uterine corpus endometrioid carcinoma | Female | >=65 | I/II | Unknown | Unknown | PD |
| Page: 1 2 3 |
Top |
Related drugs of malignant transformation related genes |
| Identification of chemicals and drugs interact with genes involved in malignant transfromation |
| (DGIdb 4.0) |
| Entrez ID | Symbol | Category | Interaction Types | Drug Claim Name | Drug Name | PMIDs |
| 84152 | PPP1R1B | KINASE | ITI-007 | LUMATEPERONE | ||
| 84152 | PPP1R1B | KINASE | FLUOXETINE | FLUOXETINE | 17125745 |
| Page: 1 |

Copyright 2023-Present -The University of Texas Health Science Center at Houston |