
|
|||||
|
 | |
| |
| |
| |
| |
| |
|
Gene: PPL |
Gene summary for PPL |
| Gene information | Species | Human | Gene symbol | PPL | Gene ID | 5493 |
| Gene name | periplakin | |
| Gene Alias | PPL | |
| Cytomap | 16p13.3 | |
| Gene Type | protein-coding | GO ID | GO:0006950 | UniProtAcc | O60437 |
Top |
Malignant transformation analysis |
| Identification of the aberrant gene expression in precancerous and cancerous lesions by comparing the gene expression of stem-like cells in diseased tissues with normal stem cells |
| Entrez ID | Symbol | Replicates | Species | Organ | Tissue | Adj P-value | Log2FC | Malignancy |
| 5493 | PPL | P128T-E | Human | Esophagus | ESCC | 1.65e-14 | 7.04e-01 | 0.1241 |
| 5493 | PPL | P130T-E | Human | Esophagus | ESCC | 3.10e-24 | 4.38e-01 | 0.1676 |
| 5493 | PPL | C04 | Human | Oral cavity | OSCC | 2.98e-03 | 3.13e-01 | 0.2633 |
| 5493 | PPL | C21 | Human | Oral cavity | OSCC | 2.49e-16 | 9.12e-01 | 0.2678 |
| 5493 | PPL | C30 | Human | Oral cavity | OSCC | 1.58e-21 | 9.15e-01 | 0.3055 |
| 5493 | PPL | C38 | Human | Oral cavity | OSCC | 6.82e-05 | 5.10e-01 | 0.172 |
| 5493 | PPL | C43 | Human | Oral cavity | OSCC | 3.96e-08 | 2.55e-01 | 0.1704 |
| 5493 | PPL | C46 | Human | Oral cavity | OSCC | 1.04e-09 | 3.23e-01 | 0.1673 |
| 5493 | PPL | C57 | Human | Oral cavity | OSCC | 1.14e-52 | 1.57e+00 | 0.1679 |
| 5493 | PPL | C06 | Human | Oral cavity | OSCC | 2.40e-02 | 6.64e-01 | 0.2699 |
| 5493 | PPL | C08 | Human | Oral cavity | OSCC | 1.33e-15 | 5.12e-01 | 0.1919 |
| 5493 | PPL | C09 | Human | Oral cavity | OSCC | 2.34e-06 | 2.85e-01 | 0.1431 |
| 5493 | PPL | LN22 | Human | Oral cavity | OSCC | 4.08e-04 | 9.05e-01 | 0.1733 |
| 5493 | PPL | LN38 | Human | Oral cavity | OSCC | 3.34e-03 | 8.27e-01 | 0.168 |
| 5493 | PPL | LN46 | Human | Oral cavity | OSCC | 7.36e-06 | 4.74e-01 | 0.1666 |
| 5493 | PPL | SYSMH1 | Human | Oral cavity | OSCC | 8.59e-07 | 2.84e-01 | 0.1127 |
| 5493 | PPL | SYSMH2 | Human | Oral cavity | OSCC | 2.89e-10 | 3.25e-01 | 0.2326 |
| 5493 | PPL | SYSMH3 | Human | Oral cavity | OSCC | 1.65e-04 | 2.25e-01 | 0.2442 |
| 5493 | PPL | SYSMH4 | Human | Oral cavity | OSCC | 3.71e-07 | 8.92e-02 | 0.1226 |
| 5493 | PPL | SYSMH5 | Human | Oral cavity | OSCC | 6.74e-06 | 2.59e-01 | 0.0647 |
| Page: 1 2 3 4 5 6 |
| Tissue | Expression Dynamics | Abbreviation |
| Cervix | 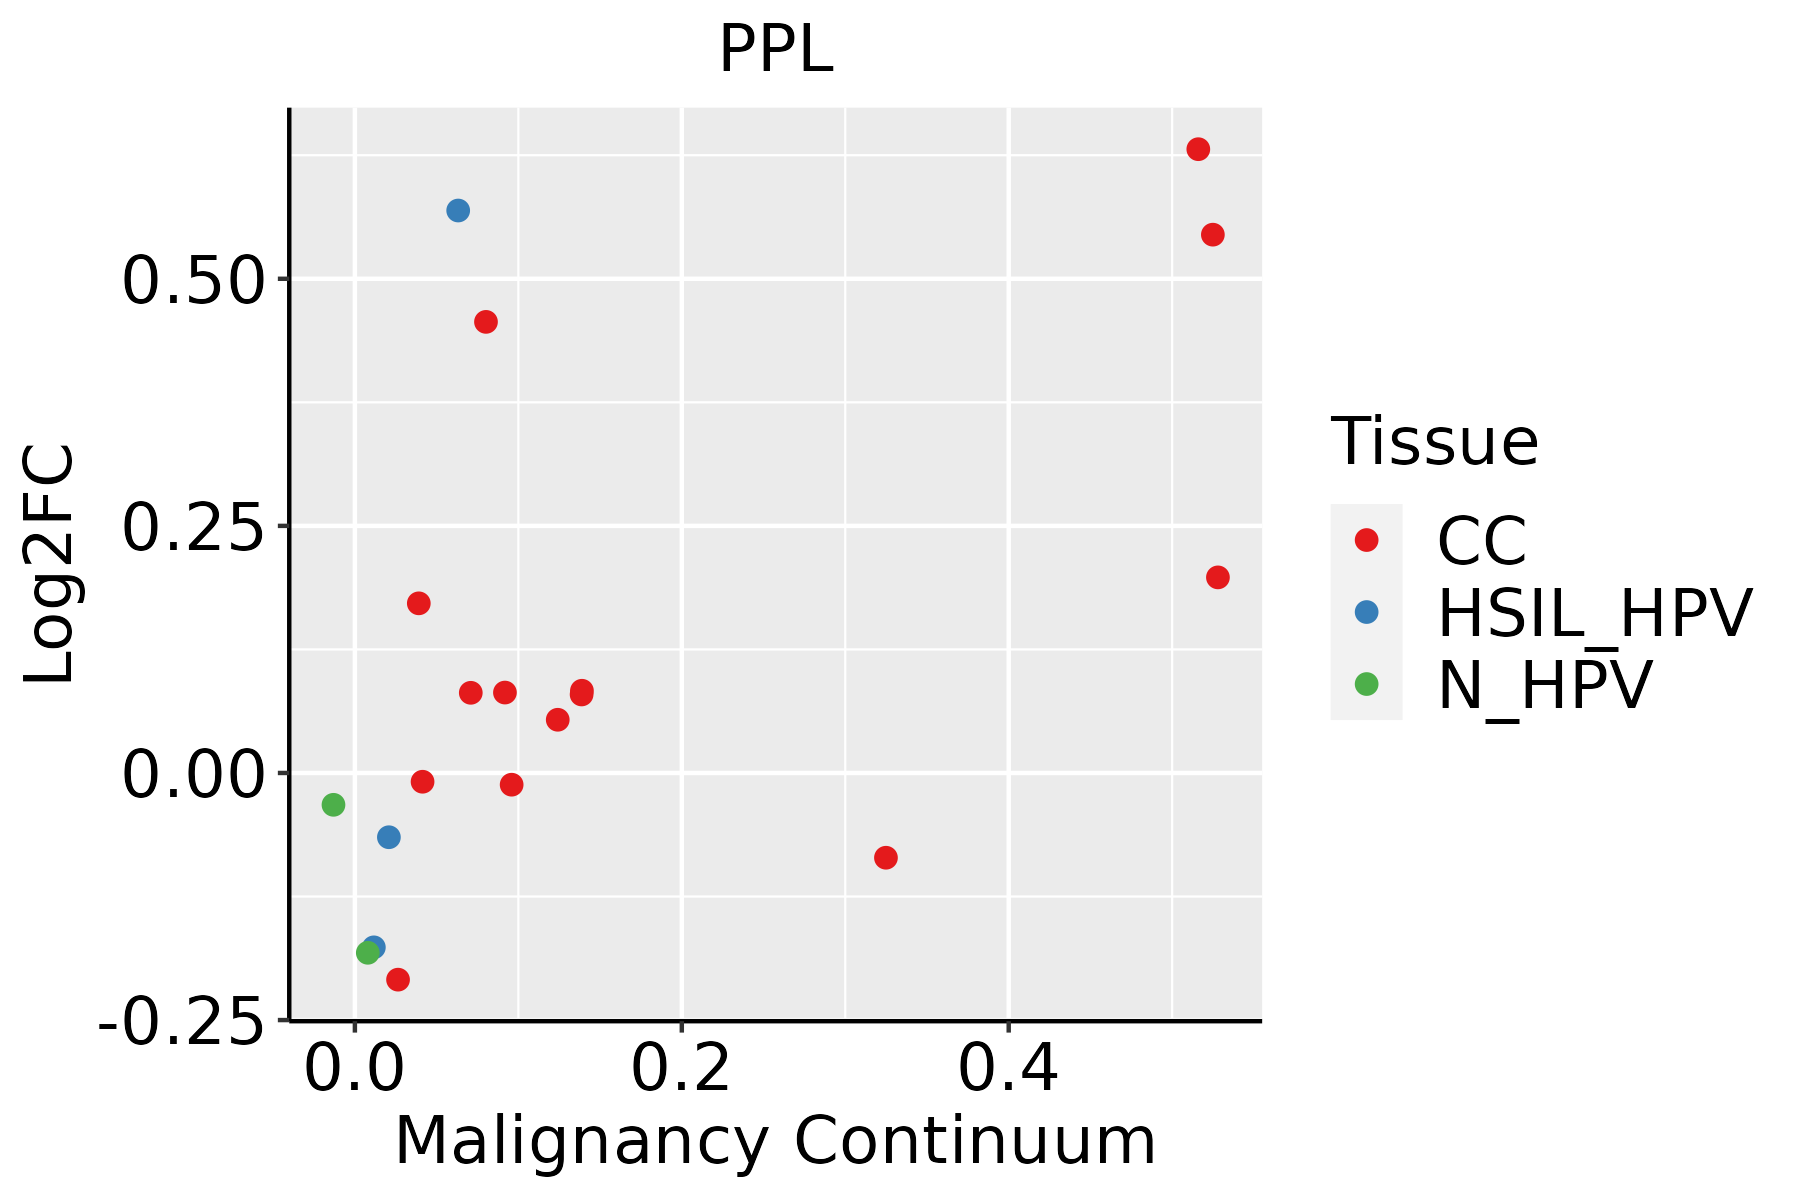 | CC: Cervix cancer |
| HSIL_HPV: HPV-infected high-grade squamous intraepithelial lesions | ||
| N_HPV: HPV-infected normal cervix | ||
| Esophagus | 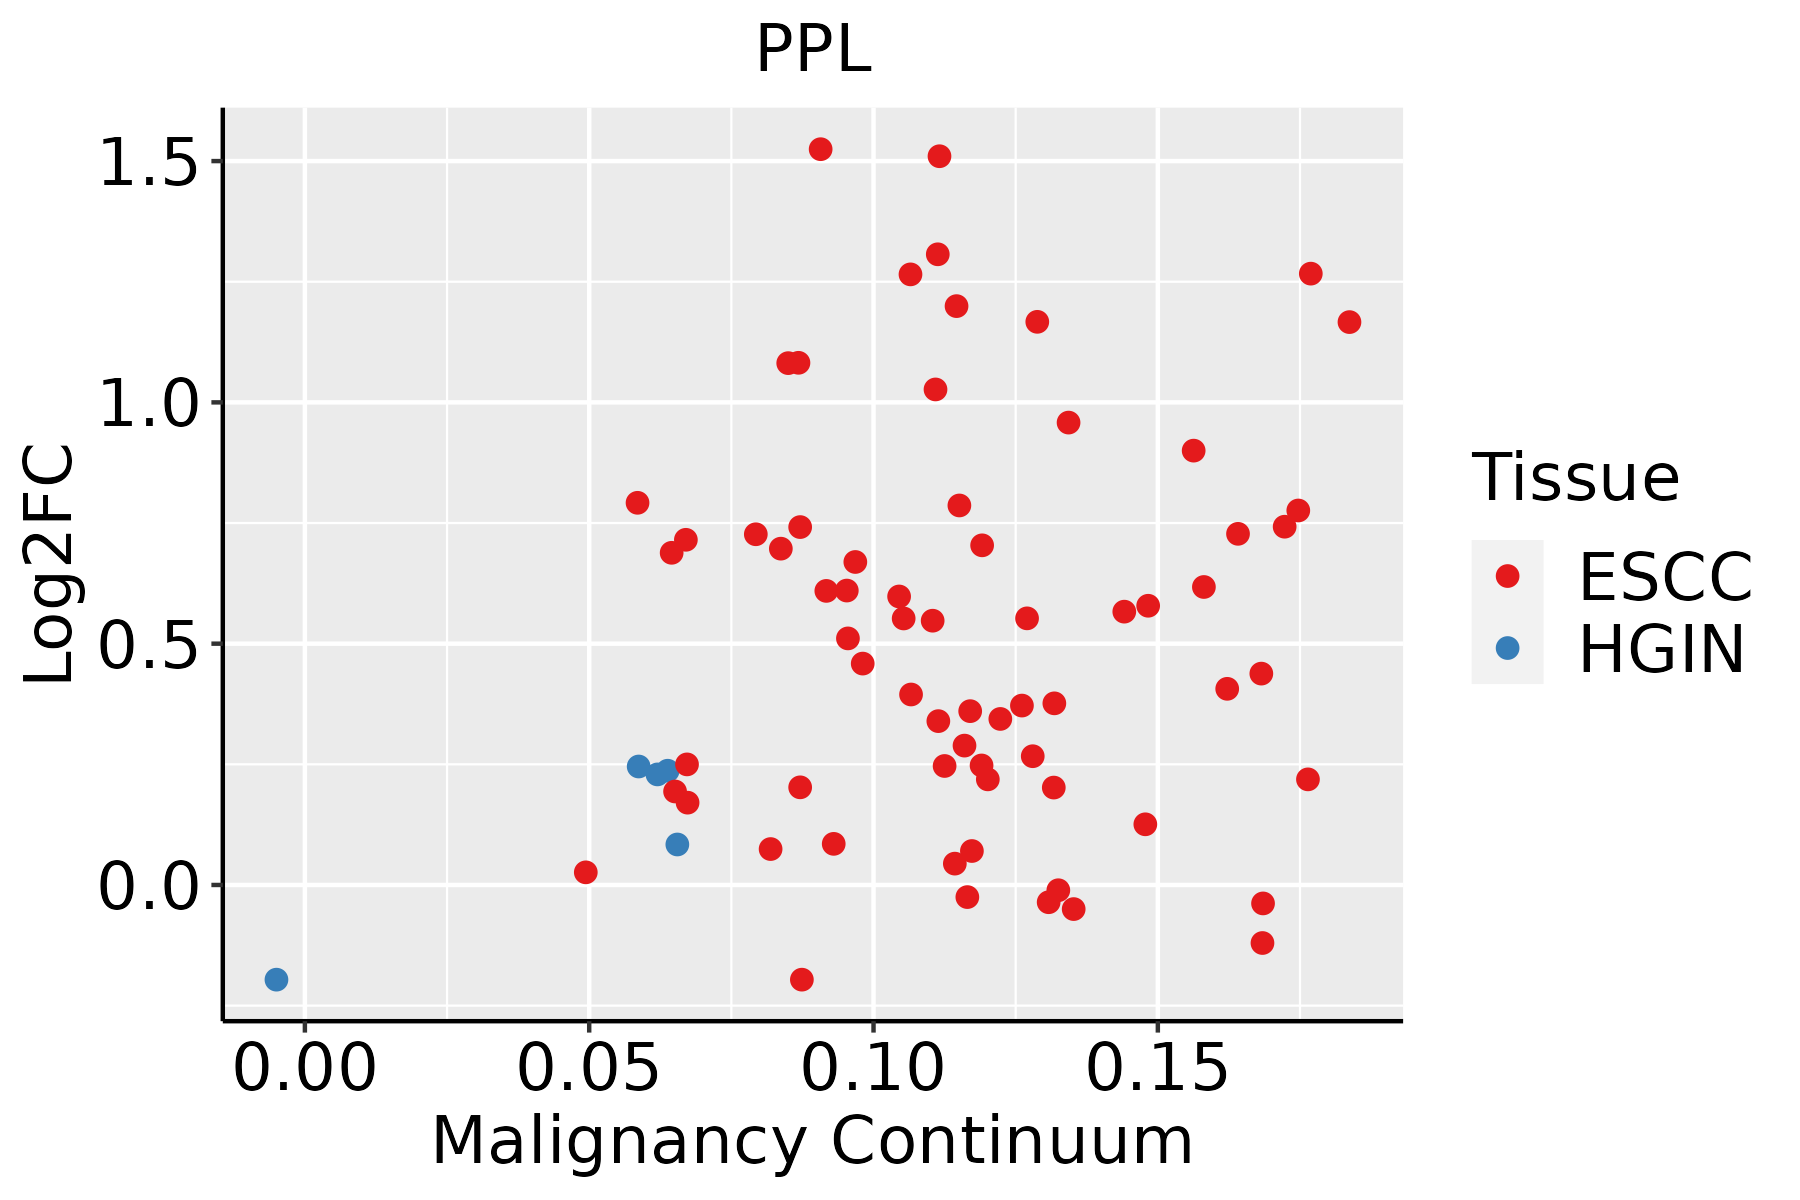 | ESCC: Esophageal squamous cell carcinoma |
| HGIN: High-grade intraepithelial neoplasias | ||
| LGIN: Low-grade intraepithelial neoplasias | ||
| Oral Cavity | 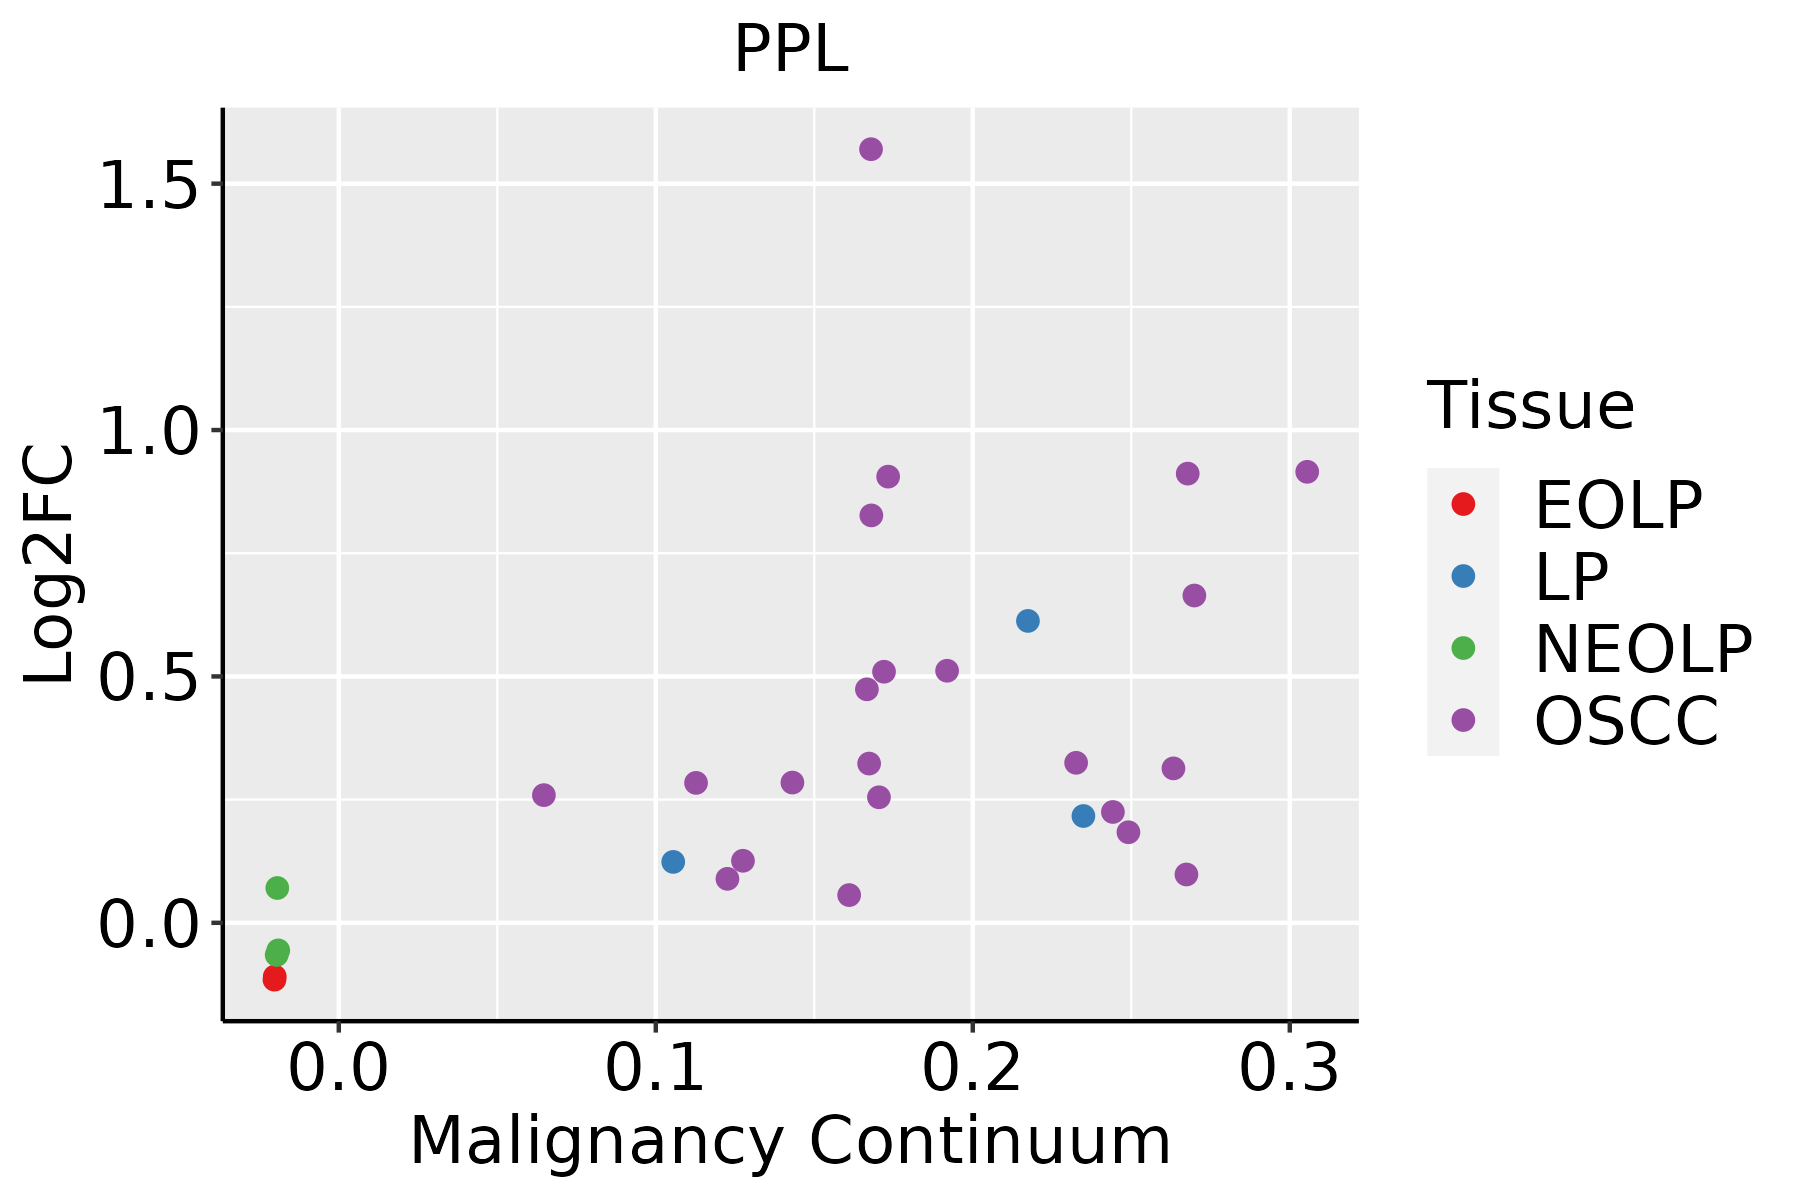 | EOLP: Erosive Oral lichen planus |
| LP: leukoplakia | ||
| NEOLP: Non-erosive oral lichen planus | ||
| OSCC: Oral squamous cell carcinoma | ||
| Prostate |  | BPH: Benign Prostatic Hyperplasia |
| Thyroid |  | ATC: Anaplastic thyroid cancer |
| HT: Hashimoto's thyroiditis | ||
| PTC: Papillary thyroid cancer |
| ∗log2FC in expression of this searched gene in stem-like cells from each diseased tissue sample relative to stem-like cells in normal samples in each tissue plotted against the malignancy continuum. Samples are colored based on if they are from different disease stage. |
Top |
Malignant transformation related pathway analysis |
| Find out the enriched GO biological processes and KEGG pathways involved in transition from healthy to precancer to cancer |
| Tissue | Disease Stage | Enriched GO biological Processes |
| Colorectum | AD |  |
| Colorectum | SER |  |
| Colorectum | MSS |  |
| Colorectum | MSI-H |  |
| Colorectum | FAP |  |
| ∗Top 15 enriched GO BP terms are showed in the bar plot of each disease state in each tissue. Each row represents a significant GO biological process which is colored according to the -log10(p.adjust). |
| Page: 1 2 3 4 5 6 7 8 9 |
| GO ID | Tissue | Disease Stage | Description | Gene Ratio | Bg Ratio | pvalue | p.adjust | Count |
| GO:004206010 | Cervix | CC | wound healing | 109/2311 | 422/18723 | 1.84e-14 | 1.57e-11 | 109 |
| GO:00016679 | Cervix | CC | ameboidal-type cell migration | 110/2311 | 475/18723 | 2.66e-11 | 6.36e-09 | 110 |
| GO:00085446 | Cervix | CC | epidermis development | 83/2311 | 324/18723 | 3.91e-11 | 8.54e-09 | 83 |
| GO:00435884 | Cervix | CC | skin development | 71/2311 | 263/18723 | 8.04e-11 | 1.46e-08 | 71 |
| GO:00725949 | Cervix | CC | establishment of protein localization to organelle | 99/2311 | 422/18723 | 1.23e-10 | 2.11e-08 | 99 |
| GO:00302164 | Cervix | CC | keratinocyte differentiation | 42/2311 | 139/18723 | 1.74e-08 | 1.28e-06 | 42 |
| GO:00069139 | Cervix | CC | nucleocytoplasmic transport | 71/2311 | 301/18723 | 4.04e-08 | 2.54e-06 | 71 |
| GO:00511699 | Cervix | CC | nuclear transport | 71/2311 | 301/18723 | 4.04e-08 | 2.54e-06 | 71 |
| GO:00099137 | Cervix | CC | epidermal cell differentiation | 53/2311 | 202/18723 | 5.48e-08 | 3.25e-06 | 53 |
| GO:00345048 | Cervix | CC | protein localization to nucleus | 68/2311 | 290/18723 | 9.91e-08 | 5.25e-06 | 68 |
| GO:005109810 | Cervix | CC | regulation of binding | 80/2311 | 363/18723 | 1.32e-07 | 6.42e-06 | 80 |
| GO:00027644 | Cervix | CC | immune response-regulating signaling pathway | 97/2311 | 468/18723 | 1.49e-07 | 7.07e-06 | 97 |
| GO:00447725 | Cervix | CC | mitotic cell cycle phase transition | 89/2311 | 424/18723 | 2.70e-07 | 1.12e-05 | 89 |
| GO:00380933 | Cervix | CC | Fc receptor signaling pathway | 19/2311 | 50/18723 | 3.42e-06 | 9.17e-05 | 19 |
| GO:003166710 | Cervix | CC | response to nutrient levels | 92/2311 | 474/18723 | 5.80e-06 | 1.42e-04 | 92 |
| GO:20000453 | Cervix | CC | regulation of G1/S transition of mitotic cell cycle | 37/2311 | 142/18723 | 6.33e-06 | 1.53e-04 | 37 |
| GO:00170388 | Cervix | CC | protein import | 48/2311 | 206/18723 | 8.62e-06 | 1.98e-04 | 48 |
| GO:005109910 | Cervix | CC | positive regulation of binding | 42/2311 | 173/18723 | 1.07e-05 | 2.33e-04 | 42 |
| GO:00000824 | Cervix | CC | G1/S transition of mitotic cell cycle | 49/2311 | 214/18723 | 1.16e-05 | 2.48e-04 | 49 |
| GO:19028062 | Cervix | CC | regulation of cell cycle G1/S phase transition | 41/2311 | 168/18723 | 1.18e-05 | 2.51e-04 | 41 |
| Page: 1 2 3 4 5 6 7 8 9 10 11 12 13 14 15 16 17 18 19 20 21 22 23 24 25 26 27 28 29 30 31 32 33 34 35 36 37 38 39 40 41 42 43 44 45 46 47 48 49 50 51 52 53 54 55 56 57 58 59 60 61 62 |
| Pathway ID | Tissue | Disease Stage | Description | Gene Ratio | Bg Ratio | pvalue | p.adjust | qvalue | Count |
| Page: 1 |
Top |
Cell-cell communication analysis |
| Identification of potential cell-cell interactions between two cell types and their ligand-receptor pairs for different disease states |
| Ligand | Receptor | LRpair | Pathway | Tissue | Disease Stage |
| Page: 1 |
Top |
Single-cell gene regulatory network inference analysis |
| Find out the significant the regulons (TFs) and the target genes of each regulon across cell types for different disease states |
| TF | Cell Type | Tissue | Disease Stage | Target Gene | RSS | Regulon Activity |
| ∗The dot plots of a searched regulon are shown for all cell subpopulations in each disease state of each tissue based on the regulon specific score inferred using pySCENIC and by calculating the average expression. |
| Page: 1 |
Top |
Somatic mutation of malignant transformation related genes |
| Annotation of somatic variants for genes involved in malignant transformation |
| Hugo Symbol | Variant Class | Variant Classification | dbSNP RS | HGVSc | HGVSp | HGVSp Short | SWISSPROT | BIOTYPE | SIFT | PolyPhen | Tumor Sample Barcode | Tissue | Histology | Sex | Age | Stage | Therapy Types | Drugs | Outcome |
| PPL | SNV | Missense_Mutation | novel | c.3422N>A | p.Ala1141Asp | p.A1141D | O60437 | protein_coding | tolerated(0.27) | benign(0.075) | TCGA-A2-A0EX-01 | Breast | breast invasive carcinoma | Female | <65 | I/II | Hormone Therapy | tamoxiphen | SD |
| PPL | SNV | Missense_Mutation | rs371832541 | c.2354N>G | p.Gln785Arg | p.Q785R | O60437 | protein_coding | tolerated(0.22) | benign(0.045) | TCGA-A8-A06T-01 | Breast | breast invasive carcinoma | Female | >=65 | III/IV | Hormone Therapy | anastrozole | SD |
| PPL | SNV | Missense_Mutation | novel | c.1802T>G | p.Leu601Arg | p.L601R | O60437 | protein_coding | tolerated(0.52) | benign(0.009) | TCGA-A8-A08H-01 | Breast | breast invasive carcinoma | Female | >=65 | I/II | Unknown | Unknown | SD |
| PPL | SNV | Missense_Mutation | novel | c.1801C>A | p.Leu601Met | p.L601M | O60437 | protein_coding | tolerated(0.1) | benign(0.039) | TCGA-A8-A08H-01 | Breast | breast invasive carcinoma | Female | >=65 | I/II | Unknown | Unknown | SD |
| PPL | SNV | Missense_Mutation | rs767752605 | c.470N>C | p.Asp157Ala | p.D157A | O60437 | protein_coding | deleterious(0.04) | benign(0.356) | TCGA-AR-A1AY-01 | Breast | breast invasive carcinoma | Female | >=65 | I/II | Unspecific | Doxorubicin | SD |
| PPL | SNV | Missense_Mutation | novel | c.3992N>T | p.Ser1331Phe | p.S1331F | O60437 | protein_coding | deleterious(0.04) | benign(0.223) | TCGA-BH-A0B6-01 | Breast | breast invasive carcinoma | Female | <65 | I/II | Unknown | Unknown | SD |
| PPL | SNV | Missense_Mutation | novel | c.2977N>A | p.Val993Met | p.V993M | O60437 | protein_coding | tolerated(0.09) | possibly_damaging(0.483) | TCGA-C8-A8HQ-01 | Breast | breast invasive carcinoma | Female | <65 | I/II | Unknown | Unknown | SD |
| PPL | SNV | Missense_Mutation | c.2404G>C | p.Glu802Gln | p.E802Q | O60437 | protein_coding | deleterious(0) | probably_damaging(0.994) | TCGA-D8-A1JA-01 | Breast | breast invasive carcinoma | Female | <65 | III/IV | Chemotherapy | adriamycin | PD | |
| PPL | SNV | Missense_Mutation | c.1774N>A | p.Asp592Asn | p.D592N | O60437 | protein_coding | tolerated(0.73) | benign(0.005) | TCGA-D8-A1Y0-01 | Breast | breast invasive carcinoma | Female | >=65 | III/IV | Chemotherapy | cyclophosphamide+methotrexatum+fluorouracillum | SD | |
| PPL | SNV | Missense_Mutation | rs370359256 | c.4894N>A | p.Glu1632Lys | p.E1632K | O60437 | protein_coding | deleterious(0.02) | probably_damaging(0.994) | TCGA-E9-A1RA-01 | Breast | breast invasive carcinoma | Female | <65 | I/II | Hormone Therapy | tamoxiphen | SD |
| Page: 1 2 3 4 5 6 7 8 9 10 11 12 13 14 15 16 17 18 |
Top |
Related drugs of malignant transformation related genes |
| Identification of chemicals and drugs interact with genes involved in malignant transfromation |
| (DGIdb 4.0) |
| Entrez ID | Symbol | Category | Interaction Types | Drug Claim Name | Drug Name | PMIDs |
| Page: 1 |

Copyright 2023-Present -The University of Texas Health Science Center at Houston |