
|
|||||
|
 | |
| |
| |
| |
| |
| |
|
Gene: POLR2M |
Gene summary for POLR2M |
| Gene information | Species | Human | Gene symbol | POLR2M | Gene ID | 81488 |
| Gene name | RNA polymerase II subunit M | |
| Gene Alias | GCOM1 | |
| Cytomap | 15q21.3 | |
| Gene Type | protein-coding | GO ID | GO:0006139 | UniProtAcc | P0CAP1 |
Top |
Malignant transformation analysis |
| Identification of the aberrant gene expression in precancerous and cancerous lesions by comparing the gene expression of stem-like cells in diseased tissues with normal stem cells |
| Entrez ID | Symbol | Replicates | Species | Organ | Tissue | Adj P-value | Log2FC | Malignancy |
| 81488 | POLR2M | HCC2_Meng | Human | Liver | HCC | 8.95e-21 | 1.38e-01 | 0.0107 |
| 81488 | POLR2M | Pt13.b | Human | Liver | HCC | 1.29e-03 | 1.59e-01 | 0.0251 |
| 81488 | POLR2M | S014 | Human | Liver | HCC | 4.56e-09 | 3.68e-01 | 0.2254 |
| 81488 | POLR2M | S015 | Human | Liver | HCC | 2.43e-09 | 5.16e-01 | 0.2375 |
| 81488 | POLR2M | S016 | Human | Liver | HCC | 4.58e-13 | 4.81e-01 | 0.2243 |
| 81488 | POLR2M | S027 | Human | Liver | HCC | 2.39e-09 | 8.69e-01 | 0.2446 |
| 81488 | POLR2M | S028 | Human | Liver | HCC | 4.46e-18 | 6.82e-01 | 0.2503 |
| 81488 | POLR2M | S029 | Human | Liver | HCC | 1.49e-15 | 6.77e-01 | 0.2581 |
| 81488 | POLR2M | C04 | Human | Oral cavity | OSCC | 1.70e-07 | 4.86e-01 | 0.2633 |
| 81488 | POLR2M | C21 | Human | Oral cavity | OSCC | 2.77e-21 | 6.58e-01 | 0.2678 |
| 81488 | POLR2M | C30 | Human | Oral cavity | OSCC | 5.48e-22 | 9.22e-01 | 0.3055 |
| 81488 | POLR2M | C43 | Human | Oral cavity | OSCC | 1.06e-20 | 3.77e-01 | 0.1704 |
| 81488 | POLR2M | C46 | Human | Oral cavity | OSCC | 3.52e-11 | 3.08e-01 | 0.1673 |
| 81488 | POLR2M | C51 | Human | Oral cavity | OSCC | 1.39e-08 | 4.06e-01 | 0.2674 |
| 81488 | POLR2M | C57 | Human | Oral cavity | OSCC | 1.04e-11 | 2.59e-01 | 0.1679 |
| 81488 | POLR2M | C07 | Human | Oral cavity | OSCC | 1.30e-04 | 4.46e-01 | 0.2491 |
| 81488 | POLR2M | C08 | Human | Oral cavity | OSCC | 1.28e-17 | 3.69e-01 | 0.1919 |
| 81488 | POLR2M | C09 | Human | Oral cavity | OSCC | 3.78e-04 | 1.92e-01 | 0.1431 |
| 81488 | POLR2M | LN46 | Human | Oral cavity | OSCC | 3.16e-04 | 2.62e-01 | 0.1666 |
| 81488 | POLR2M | LP15 | Human | Oral cavity | LP | 5.00e-04 | 4.94e-01 | 0.2174 |
| Page: 1 2 3 4 5 |
| Tissue | Expression Dynamics | Abbreviation |
| Esophagus | 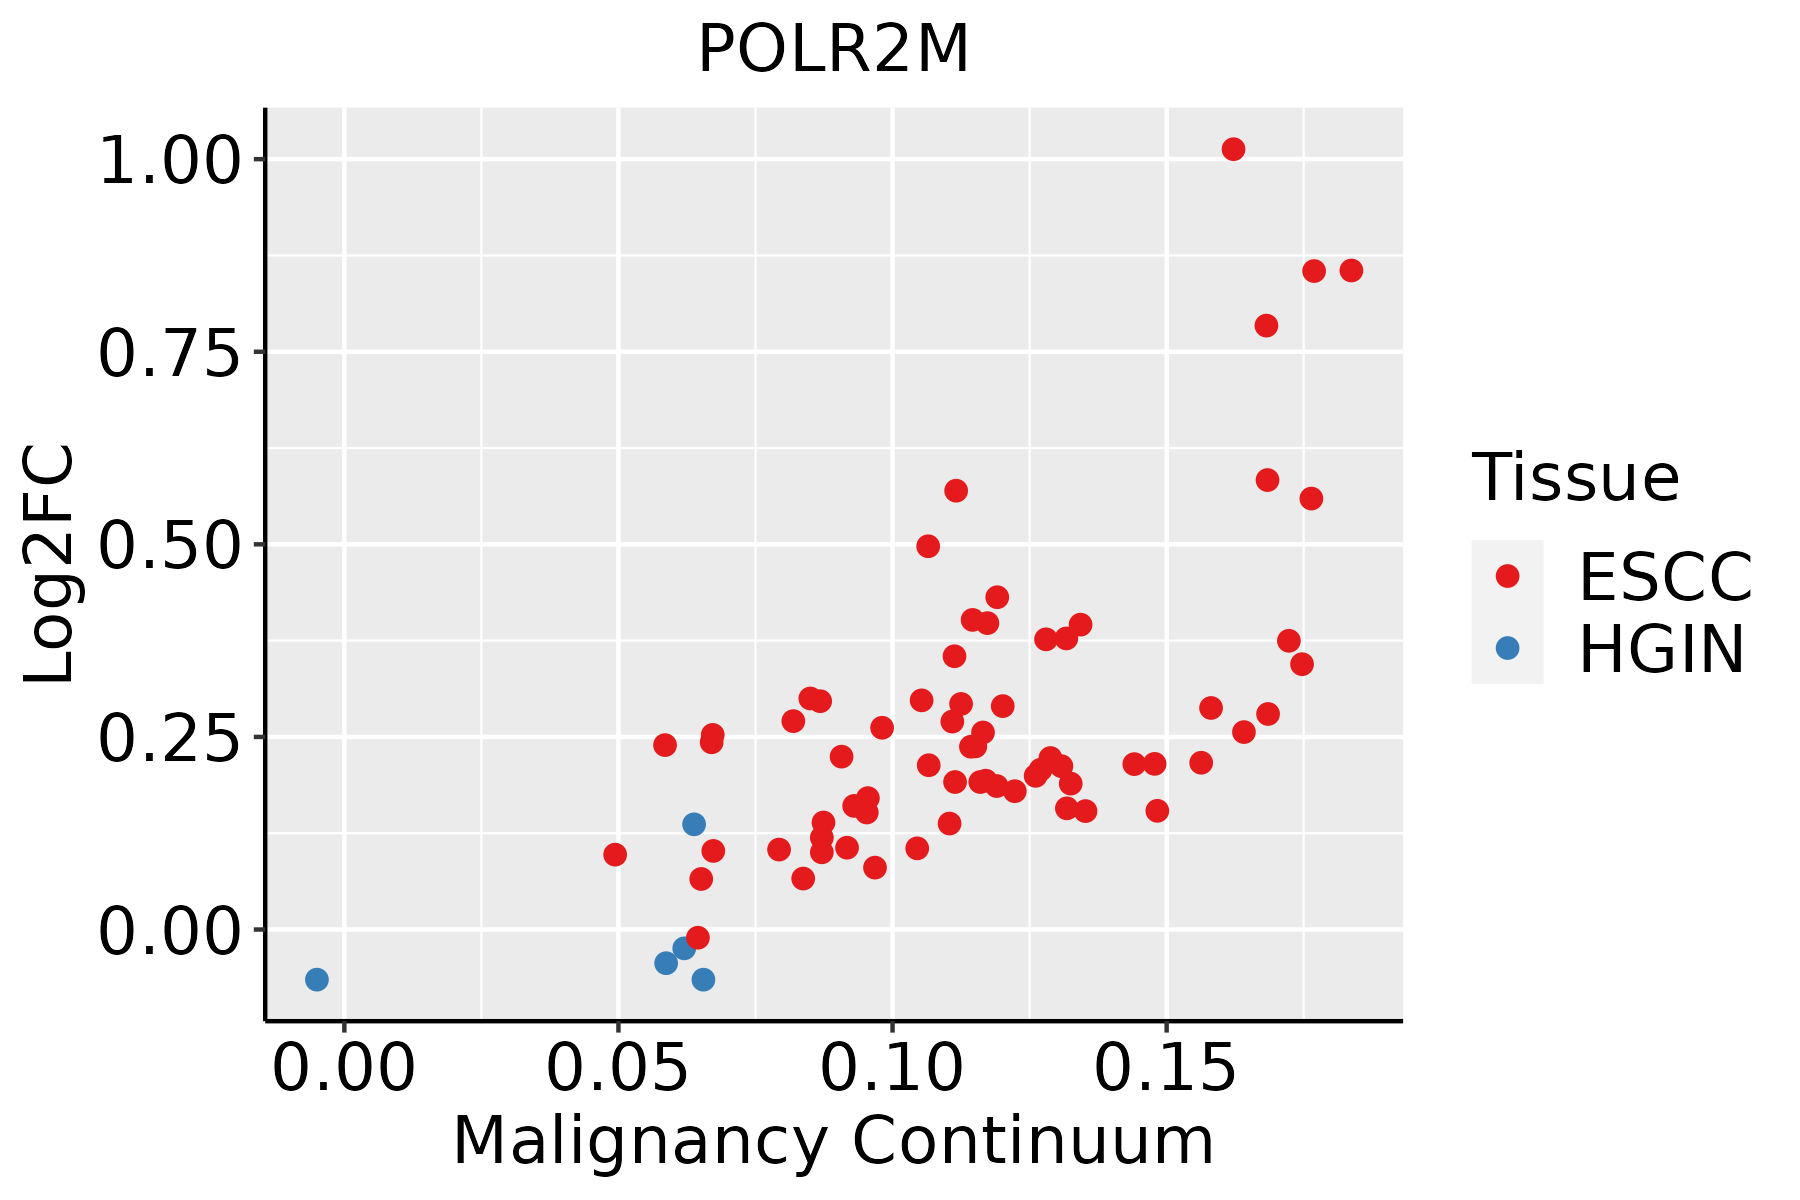 | ESCC: Esophageal squamous cell carcinoma |
| HGIN: High-grade intraepithelial neoplasias | ||
| LGIN: Low-grade intraepithelial neoplasias | ||
| Liver | 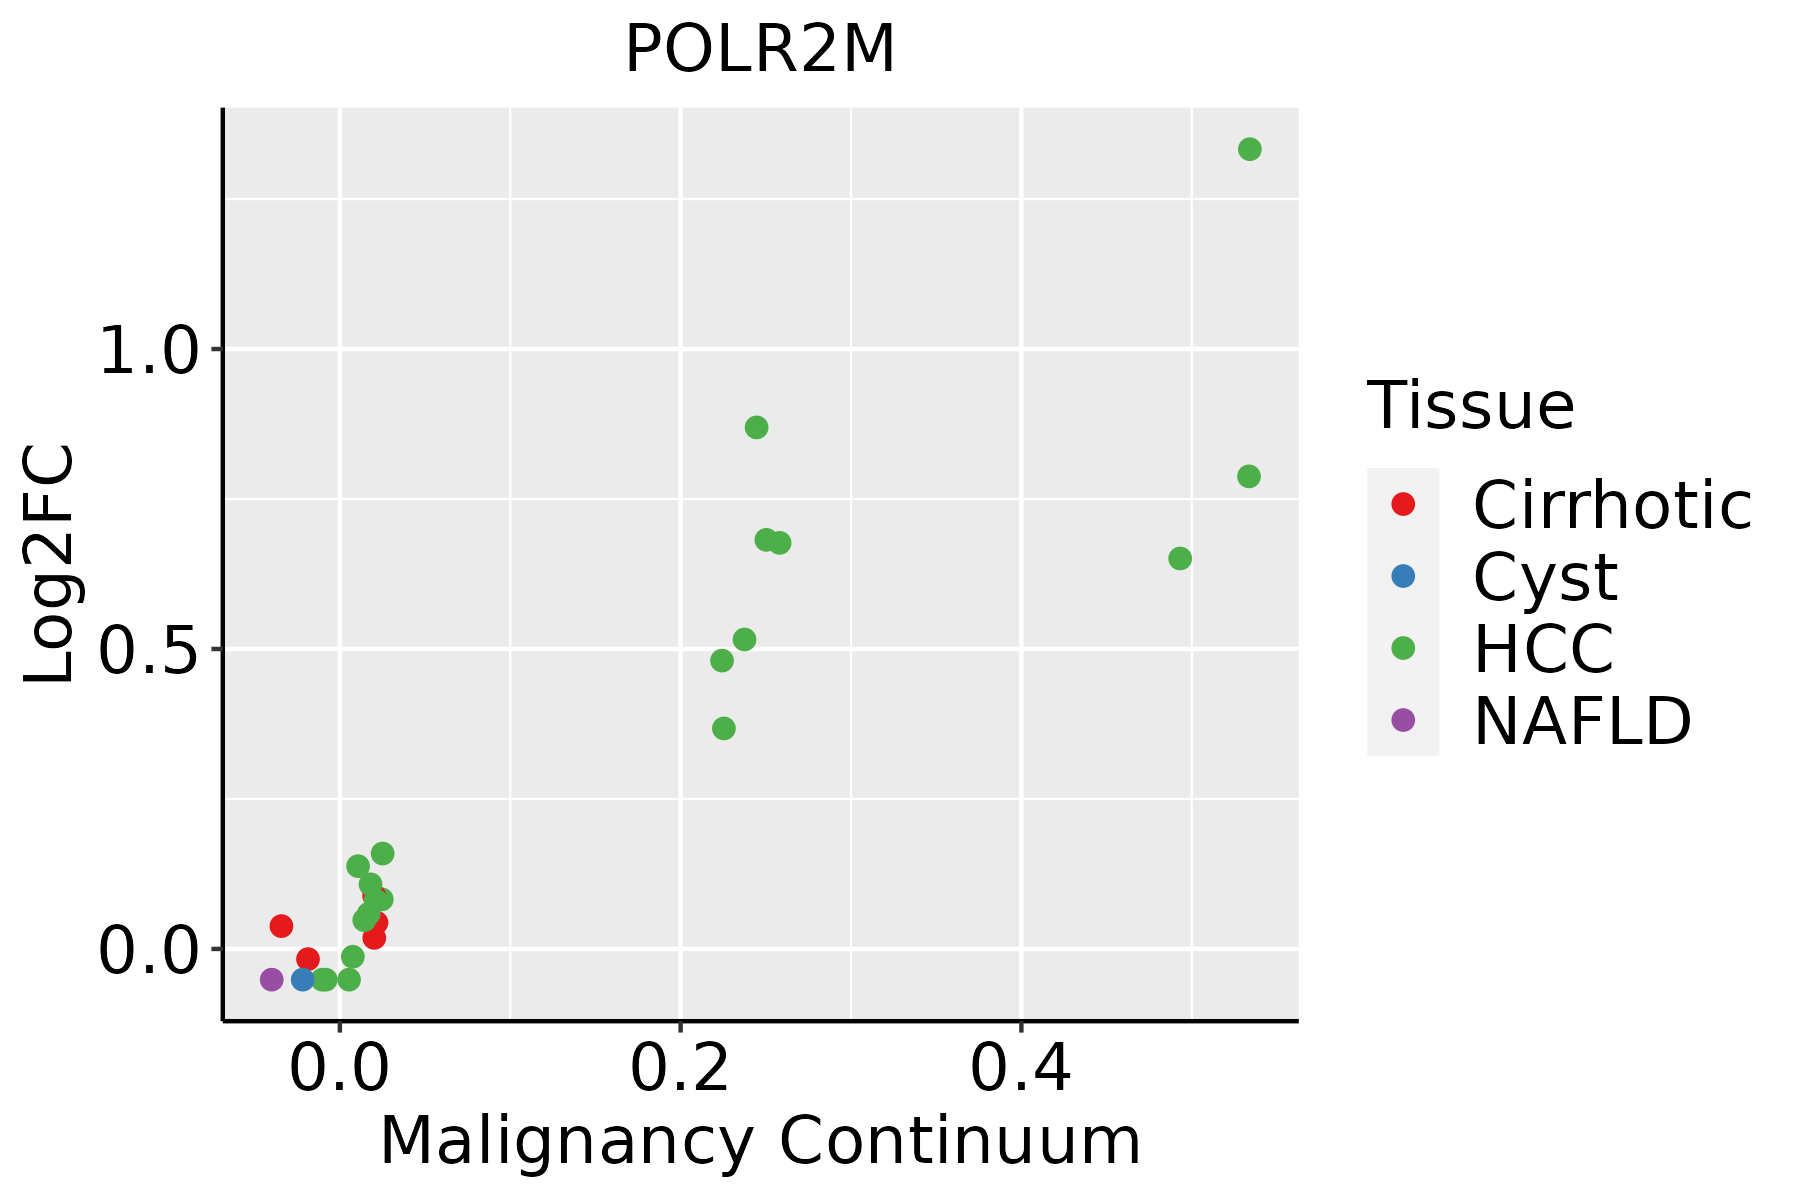 | HCC: Hepatocellular carcinoma |
| NAFLD: Non-alcoholic fatty liver disease | ||
| Oral Cavity |  | EOLP: Erosive Oral lichen planus |
| LP: leukoplakia | ||
| NEOLP: Non-erosive oral lichen planus | ||
| OSCC: Oral squamous cell carcinoma |
| ∗log2FC in expression of this searched gene in stem-like cells from each diseased tissue sample relative to stem-like cells in normal samples in each tissue plotted against the malignancy continuum. Samples are colored based on if they are from different disease stage. |
Top |
Malignant transformation related pathway analysis |
| Find out the enriched GO biological processes and KEGG pathways involved in transition from healthy to precancer to cancer |
| Tissue | Disease Stage | Enriched GO biological Processes |
| Colorectum | AD |  |
| Colorectum | SER |  |
| Colorectum | MSS |  |
| Colorectum | MSI-H |  |
| Colorectum | FAP |  |
| ∗Top 15 enriched GO BP terms are showed in the bar plot of each disease state in each tissue. Each row represents a significant GO biological process which is colored according to the -log10(p.adjust). |
| Page: 1 2 3 4 5 6 7 8 9 |
| GO ID | Tissue | Disease Stage | Description | Gene Ratio | Bg Ratio | pvalue | p.adjust | Count |
| GO:0051235110 | Esophagus | ESCC | maintenance of location | 200/8552 | 327/18723 | 1.01e-08 | 2.02e-07 | 200 |
| GO:000702914 | Esophagus | ESCC | endoplasmic reticulum organization | 65/8552 | 87/18723 | 3.28e-08 | 6.08e-07 | 65 |
| GO:0051651111 | Esophagus | ESCC | maintenance of location in cell | 126/8552 | 214/18723 | 6.57e-05 | 5.00e-04 | 126 |
| GO:000702911 | Liver | HCC | endoplasmic reticulum organization | 64/7958 | 87/18723 | 3.92e-09 | 1.04e-07 | 64 |
| GO:005123521 | Liver | HCC | maintenance of location | 185/7958 | 327/18723 | 1.70e-07 | 3.12e-06 | 185 |
| GO:005165112 | Liver | HCC | maintenance of location in cell | 119/7958 | 214/18723 | 7.11e-05 | 6.39e-04 | 119 |
| GO:0051657 | Liver | HCC | maintenance of organelle location | 9/7958 | 11/18723 | 9.51e-03 | 3.60e-02 | 9 |
| GO:005123518 | Oral cavity | OSCC | maintenance of location | 182/7305 | 327/18723 | 6.16e-10 | 1.58e-08 | 182 |
| GO:005165120 | Oral cavity | OSCC | maintenance of location in cell | 121/7305 | 214/18723 | 1.39e-07 | 2.32e-06 | 121 |
| GO:00070294 | Oral cavity | OSCC | endoplasmic reticulum organization | 58/7305 | 87/18723 | 1.59e-07 | 2.61e-06 | 58 |
| GO:000702913 | Oral cavity | LP | endoplasmic reticulum organization | 41/4623 | 87/18723 | 4.49e-06 | 9.16e-05 | 41 |
| GO:005123519 | Oral cavity | LP | maintenance of location | 111/4623 | 327/18723 | 9.62e-05 | 1.20e-03 | 111 |
| GO:0051651110 | Oral cavity | LP | maintenance of location in cell | 74/4623 | 214/18723 | 7.18e-04 | 6.41e-03 | 74 |
| Page: 1 |
| Pathway ID | Tissue | Disease Stage | Description | Gene Ratio | Bg Ratio | pvalue | p.adjust | qvalue | Count |
| hsa0342022 | Esophagus | ESCC | Nucleotide excision repair | 54/4205 | 63/8465 | 2.01e-09 | 2.17e-08 | 1.11e-08 | 54 |
| hsa0302021 | Esophagus | ESCC | RNA polymerase | 28/4205 | 34/8465 | 8.19e-05 | 3.35e-04 | 1.71e-04 | 28 |
| hsa0342032 | Esophagus | ESCC | Nucleotide excision repair | 54/4205 | 63/8465 | 2.01e-09 | 2.17e-08 | 1.11e-08 | 54 |
| hsa0302031 | Esophagus | ESCC | RNA polymerase | 28/4205 | 34/8465 | 8.19e-05 | 3.35e-04 | 1.71e-04 | 28 |
| hsa034202 | Liver | HCC | Nucleotide excision repair | 41/4020 | 63/8465 | 3.59e-03 | 1.12e-02 | 6.22e-03 | 41 |
| hsa03020 | Liver | HCC | RNA polymerase | 24/4020 | 34/8465 | 5.40e-03 | 1.57e-02 | 8.75e-03 | 24 |
| hsa034203 | Liver | HCC | Nucleotide excision repair | 41/4020 | 63/8465 | 3.59e-03 | 1.12e-02 | 6.22e-03 | 41 |
| hsa030201 | Liver | HCC | RNA polymerase | 24/4020 | 34/8465 | 5.40e-03 | 1.57e-02 | 8.75e-03 | 24 |
| hsa034204 | Oral cavity | OSCC | Nucleotide excision repair | 49/3704 | 63/8465 | 3.48e-08 | 2.91e-07 | 1.48e-07 | 49 |
| hsa030204 | Oral cavity | OSCC | RNA polymerase | 25/3704 | 34/8465 | 4.12e-04 | 1.27e-03 | 6.45e-04 | 25 |
| hsa0342011 | Oral cavity | OSCC | Nucleotide excision repair | 49/3704 | 63/8465 | 3.48e-08 | 2.91e-07 | 1.48e-07 | 49 |
| hsa0302011 | Oral cavity | OSCC | RNA polymerase | 25/3704 | 34/8465 | 4.12e-04 | 1.27e-03 | 6.45e-04 | 25 |
| hsa0342021 | Oral cavity | LP | Nucleotide excision repair | 37/2418 | 63/8465 | 5.14e-07 | 6.33e-06 | 4.08e-06 | 37 |
| hsa030202 | Oral cavity | LP | RNA polymerase | 18/2418 | 34/8465 | 2.35e-03 | 1.03e-02 | 6.63e-03 | 18 |
| hsa0342031 | Oral cavity | LP | Nucleotide excision repair | 37/2418 | 63/8465 | 5.14e-07 | 6.33e-06 | 4.08e-06 | 37 |
| hsa030203 | Oral cavity | LP | RNA polymerase | 18/2418 | 34/8465 | 2.35e-03 | 1.03e-02 | 6.63e-03 | 18 |
| Page: 1 |
Top |
Cell-cell communication analysis |
| Identification of potential cell-cell interactions between two cell types and their ligand-receptor pairs for different disease states |
| Ligand | Receptor | LRpair | Pathway | Tissue | Disease Stage |
| Page: 1 |
Top |
Single-cell gene regulatory network inference analysis |
| Find out the significant the regulons (TFs) and the target genes of each regulon across cell types for different disease states |
| TF | Cell Type | Tissue | Disease Stage | Target Gene | RSS | Regulon Activity |
| ∗The dot plots of a searched regulon are shown for all cell subpopulations in each disease state of each tissue based on the regulon specific score inferred using pySCENIC and by calculating the average expression. |
| Page: 1 |
Top |
Somatic mutation of malignant transformation related genes |
| Annotation of somatic variants for genes involved in malignant transformation |
| Hugo Symbol | Variant Class | Variant Classification | dbSNP RS | HGVSc | HGVSp | HGVSp Short | SWISSPROT | BIOTYPE | SIFT | PolyPhen | Tumor Sample Barcode | Tissue | Histology | Sex | Age | Stage | Therapy Types | Drugs | Outcome |
| POLR2M | SNV | Missense_Mutation | novel | c.782C>T | p.Ser261Leu | p.S261L | P0CAP2 | protein_coding | deleterious(0.02) | benign(0.356) | TCGA-A8-A094-01 | Breast | breast invasive carcinoma | Female | >=65 | I/II | Unknown | Unknown | SD |
| POLR2M | SNV | Missense_Mutation | rs760172634 | c.833N>A | p.Arg278Gln | p.R278Q | P0CAP2 | protein_coding | deleterious(0.04) | possibly_damaging(0.811) | TCGA-2W-A8YY-01 | Cervix | cervical & endocervical cancer | Female | <65 | I/II | Chemotherapy | cisplatin | CR |
| POLR2M | SNV | Missense_Mutation | c.1067C>T | p.Ser356Phe | p.S356F | P0CAP2 | nonsense_mediated_decay | unknown(0) | TCGA-EK-A3GK-01 | Cervix | cervical & endocervical cancer | Female | <65 | I/II | Unknown | Unknown | SD | ||
| POLR2M | SNV | Missense_Mutation | c.954G>T | p.Gln318His | p.Q318H | P0CAP2 | protein_coding | deleterious(0) | probably_damaging(0.997) | TCGA-AA-3510-01 | Colorectum | colon adenocarcinoma | Male | >=65 | I/II | Unknown | Unknown | SD | |
| POLR2M | SNV | Missense_Mutation | novel | c.325N>G | p.Ser109Ala | p.S109A | P0CAP2 | protein_coding | deleterious(0.04) | possibly_damaging(0.477) | TCGA-AA-A00N-01 | Colorectum | colon adenocarcinoma | Male | >=65 | I/II | Unknown | Unknown | PD |
| POLR2M | SNV | Missense_Mutation | rs372856991 | c.601N>G | p.Ile201Val | p.I201V | P0CAP2 | protein_coding | tolerated(0.17) | benign(0.027) | TCGA-CA-6717-01 | Colorectum | colon adenocarcinoma | Male | <65 | I/II | Chemotherapy | oxaliplatin | CR |
| POLR2M | SNV | Missense_Mutation | rs546736463 | c.637N>A | p.Ala213Thr | p.A213T | P0CAP2 | protein_coding | tolerated(1) | benign(0.001) | TCGA-CM-6171-01 | Colorectum | colon adenocarcinoma | Female | >=65 | I/II | Unknown | Unknown | SD |
| POLR2M | SNV | Missense_Mutation | c.775N>C | p.Asn259His | p.N259H | P0CAP2 | protein_coding | tolerated(0.22) | benign(0) | TCGA-AP-A056-01 | Endometrium | uterine corpus endometrioid carcinoma | Female | <65 | I/II | Unknown | Unknown | SD | |
| POLR2M | SNV | Missense_Mutation | c.700N>T | p.Val234Leu | p.V234L | P0CAP2 | protein_coding | deleterious(0) | probably_damaging(0.996) | TCGA-AP-A059-01 | Endometrium | uterine corpus endometrioid carcinoma | Female | >=65 | I/II | Unknown | Unknown | SD | |
| POLR2M | SNV | Missense_Mutation | rs375334112 | c.375N>C | p.Gln125His | p.Q125H | P0CAP2 | protein_coding | deleterious(0.04) | benign(0.003) | TCGA-AX-A063-01 | Endometrium | uterine corpus endometrioid carcinoma | Female | <65 | I/II | Unknown | Unknown | SD |
| Page: 1 2 3 |
Top |
Related drugs of malignant transformation related genes |
| Identification of chemicals and drugs interact with genes involved in malignant transfromation |
| (DGIdb 4.0) |
| Entrez ID | Symbol | Category | Interaction Types | Drug Claim Name | Drug Name | PMIDs |
| Page: 1 |

Copyright 2023-Present -The University of Texas Health Science Center at Houston |