
|
|||||
|
 | |
| |
| |
| |
| |
| |
|
Gene: PLXNB1 |
Gene summary for PLXNB1 |
| Gene information | Species | Human | Gene symbol | PLXNB1 | Gene ID | 5364 |
| Gene name | plexin B1 | |
| Gene Alias | PLEXIN-B1 | |
| Cytomap | 3p21.31 | |
| Gene Type | protein-coding | GO ID | GO:0000902 | UniProtAcc | O43157 |
Top |
Malignant transformation analysis |
| Identification of the aberrant gene expression in precancerous and cancerous lesions by comparing the gene expression of stem-like cells in diseased tissues with normal stem cells |
| Entrez ID | Symbol | Replicates | Species | Organ | Tissue | Adj P-value | Log2FC | Malignancy |
| 5364 | PLXNB1 | P62T-E | Human | Esophagus | ESCC | 6.96e-17 | 2.65e-01 | 0.1302 |
| 5364 | PLXNB1 | P65T-E | Human | Esophagus | ESCC | 4.13e-14 | 1.34e-01 | 0.0978 |
| 5364 | PLXNB1 | P74T-E | Human | Esophagus | ESCC | 3.91e-18 | 5.46e-01 | 0.1479 |
| 5364 | PLXNB1 | P75T-E | Human | Esophagus | ESCC | 1.33e-14 | 2.28e-01 | 0.1125 |
| 5364 | PLXNB1 | P76T-E | Human | Esophagus | ESCC | 5.22e-14 | 6.81e-02 | 0.1207 |
| 5364 | PLXNB1 | P79T-E | Human | Esophagus | ESCC | 2.54e-08 | 6.56e-02 | 0.1154 |
| 5364 | PLXNB1 | P80T-E | Human | Esophagus | ESCC | 1.40e-05 | 1.13e-01 | 0.155 |
| 5364 | PLXNB1 | P83T-E | Human | Esophagus | ESCC | 2.97e-17 | 3.34e-01 | 0.1738 |
| 5364 | PLXNB1 | P89T-E | Human | Esophagus | ESCC | 2.99e-02 | 1.00e-01 | 0.1752 |
| 5364 | PLXNB1 | P107T-E | Human | Esophagus | ESCC | 2.64e-13 | 8.60e-02 | 0.171 |
| 5364 | PLXNB1 | P127T-E | Human | Esophagus | ESCC | 6.17e-09 | 3.39e-02 | 0.0826 |
| 5364 | PLXNB1 | P128T-E | Human | Esophagus | ESCC | 3.65e-11 | 3.30e-01 | 0.1241 |
| 5364 | PLXNB1 | P130T-E | Human | Esophagus | ESCC | 2.90e-19 | 1.91e-01 | 0.1676 |
| 5364 | PLXNB1 | S43 | Human | Liver | Cirrhotic | 8.05e-12 | 3.06e-03 | -0.0187 |
| 5364 | PLXNB1 | HCC1_Meng | Human | Liver | HCC | 6.18e-54 | -7.15e-02 | 0.0246 |
| 5364 | PLXNB1 | HCC2_Meng | Human | Liver | HCC | 1.18e-15 | -7.19e-02 | 0.0107 |
| 5364 | PLXNB1 | HCC1 | Human | Liver | HCC | 8.94e-04 | 3.14e+00 | 0.5336 |
| 5364 | PLXNB1 | HCC2 | Human | Liver | HCC | 4.25e-04 | 2.70e+00 | 0.5341 |
| 5364 | PLXNB1 | Pt13.a | Human | Liver | HCC | 1.38e-05 | -2.06e-01 | 0.021 |
| 5364 | PLXNB1 | Pt13.c | Human | Liver | HCC | 2.88e-02 | -2.20e-01 | 0.0076 |
| Page: 1 2 3 4 5 6 7 |
| Tissue | Expression Dynamics | Abbreviation |
| Colorectum (GSE201348) |  | FAP: Familial adenomatous polyposis |
| CRC: Colorectal cancer | ||
| Colorectum (HTA11) |  | AD: Adenomas |
| SER: Sessile serrated lesions | ||
| MSI-H: Microsatellite-high colorectal cancer | ||
| MSS: Microsatellite stable colorectal cancer | ||
| Endometrium | 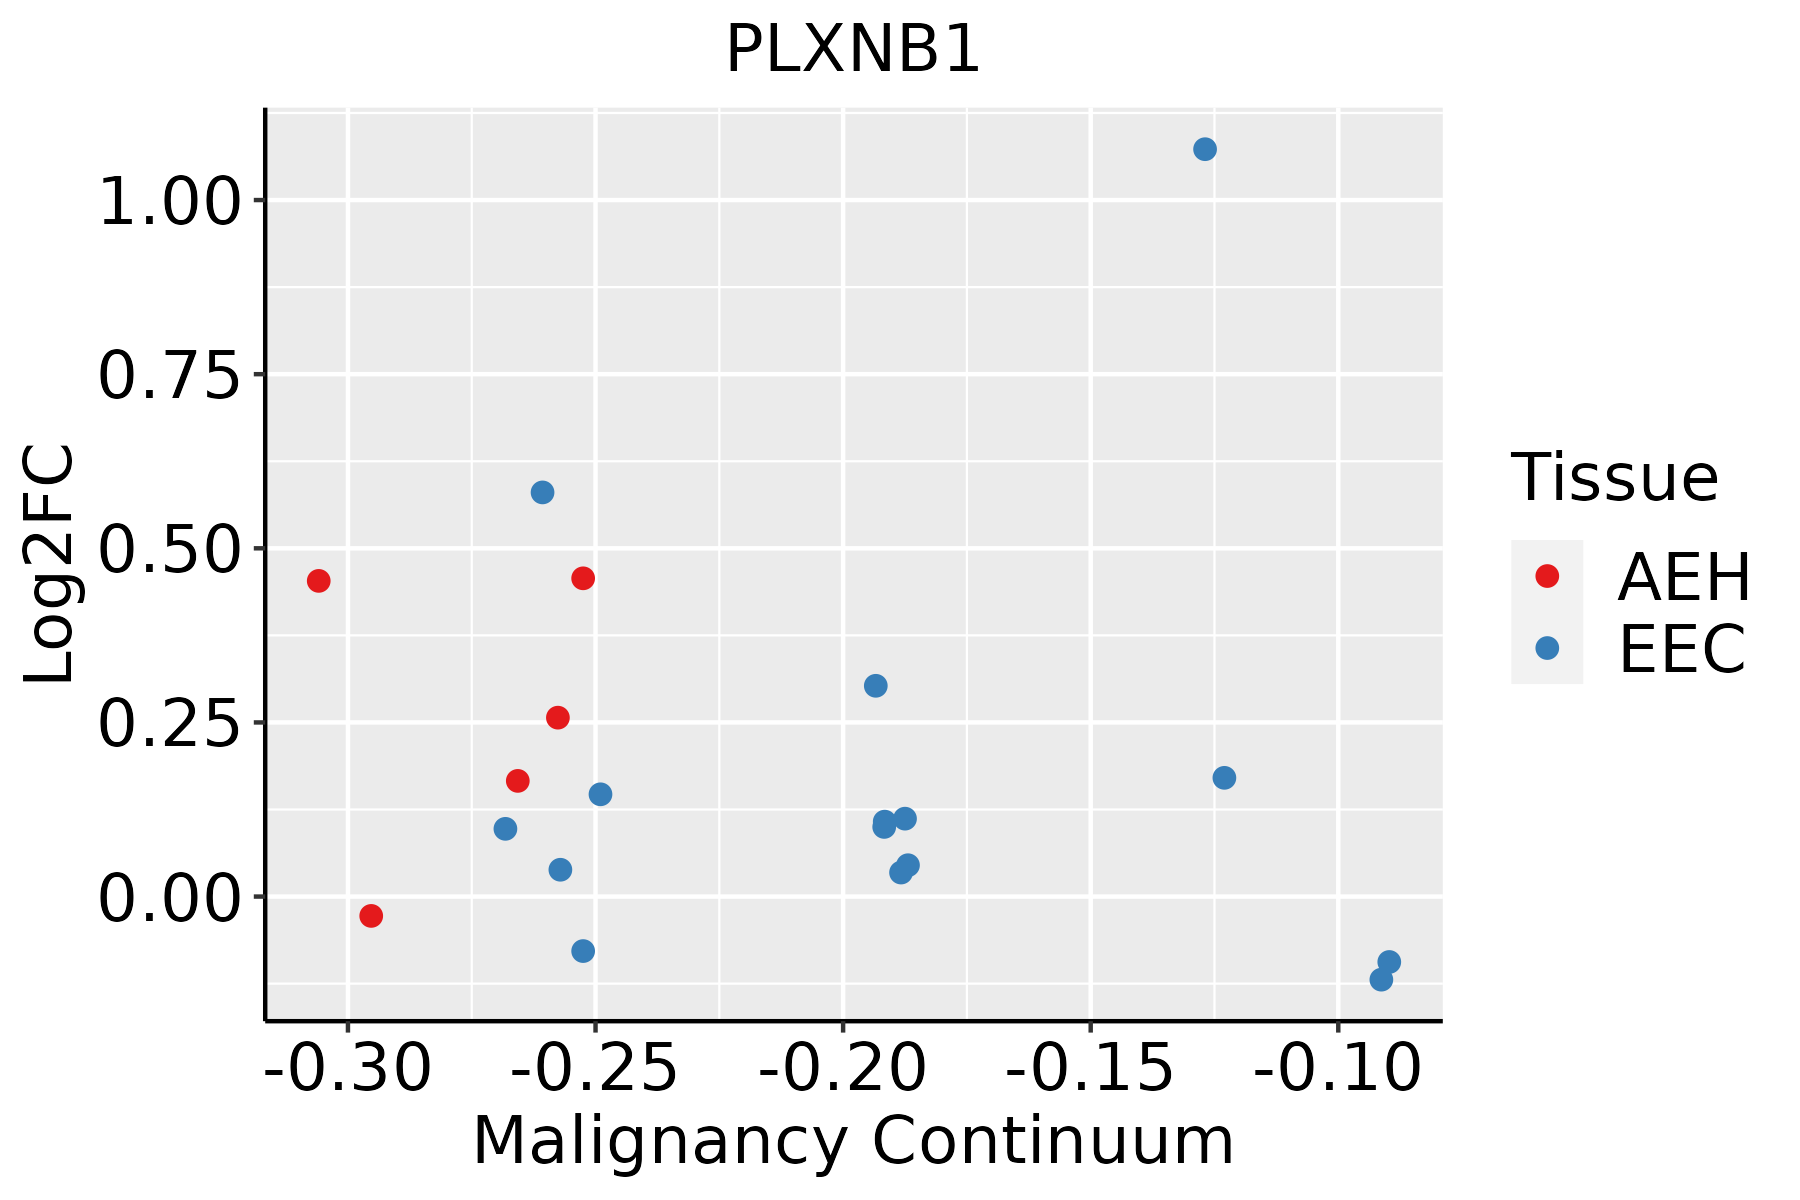 | AEH: Atypical endometrial hyperplasia |
| EEC: Endometrioid Cancer | ||
| Esophagus |  | ESCC: Esophageal squamous cell carcinoma |
| HGIN: High-grade intraepithelial neoplasias | ||
| LGIN: Low-grade intraepithelial neoplasias | ||
| Liver |  | HCC: Hepatocellular carcinoma |
| NAFLD: Non-alcoholic fatty liver disease | ||
| Oral Cavity |  | EOLP: Erosive Oral lichen planus |
| LP: leukoplakia | ||
| NEOLP: Non-erosive oral lichen planus | ||
| OSCC: Oral squamous cell carcinoma | ||
| Prostate |  | BPH: Benign Prostatic Hyperplasia |
| Skin |  | AK: Actinic keratosis |
| cSCC: Cutaneous squamous cell carcinoma | ||
| SCCIS:squamous cell carcinoma in situ | ||
| Thyroid | 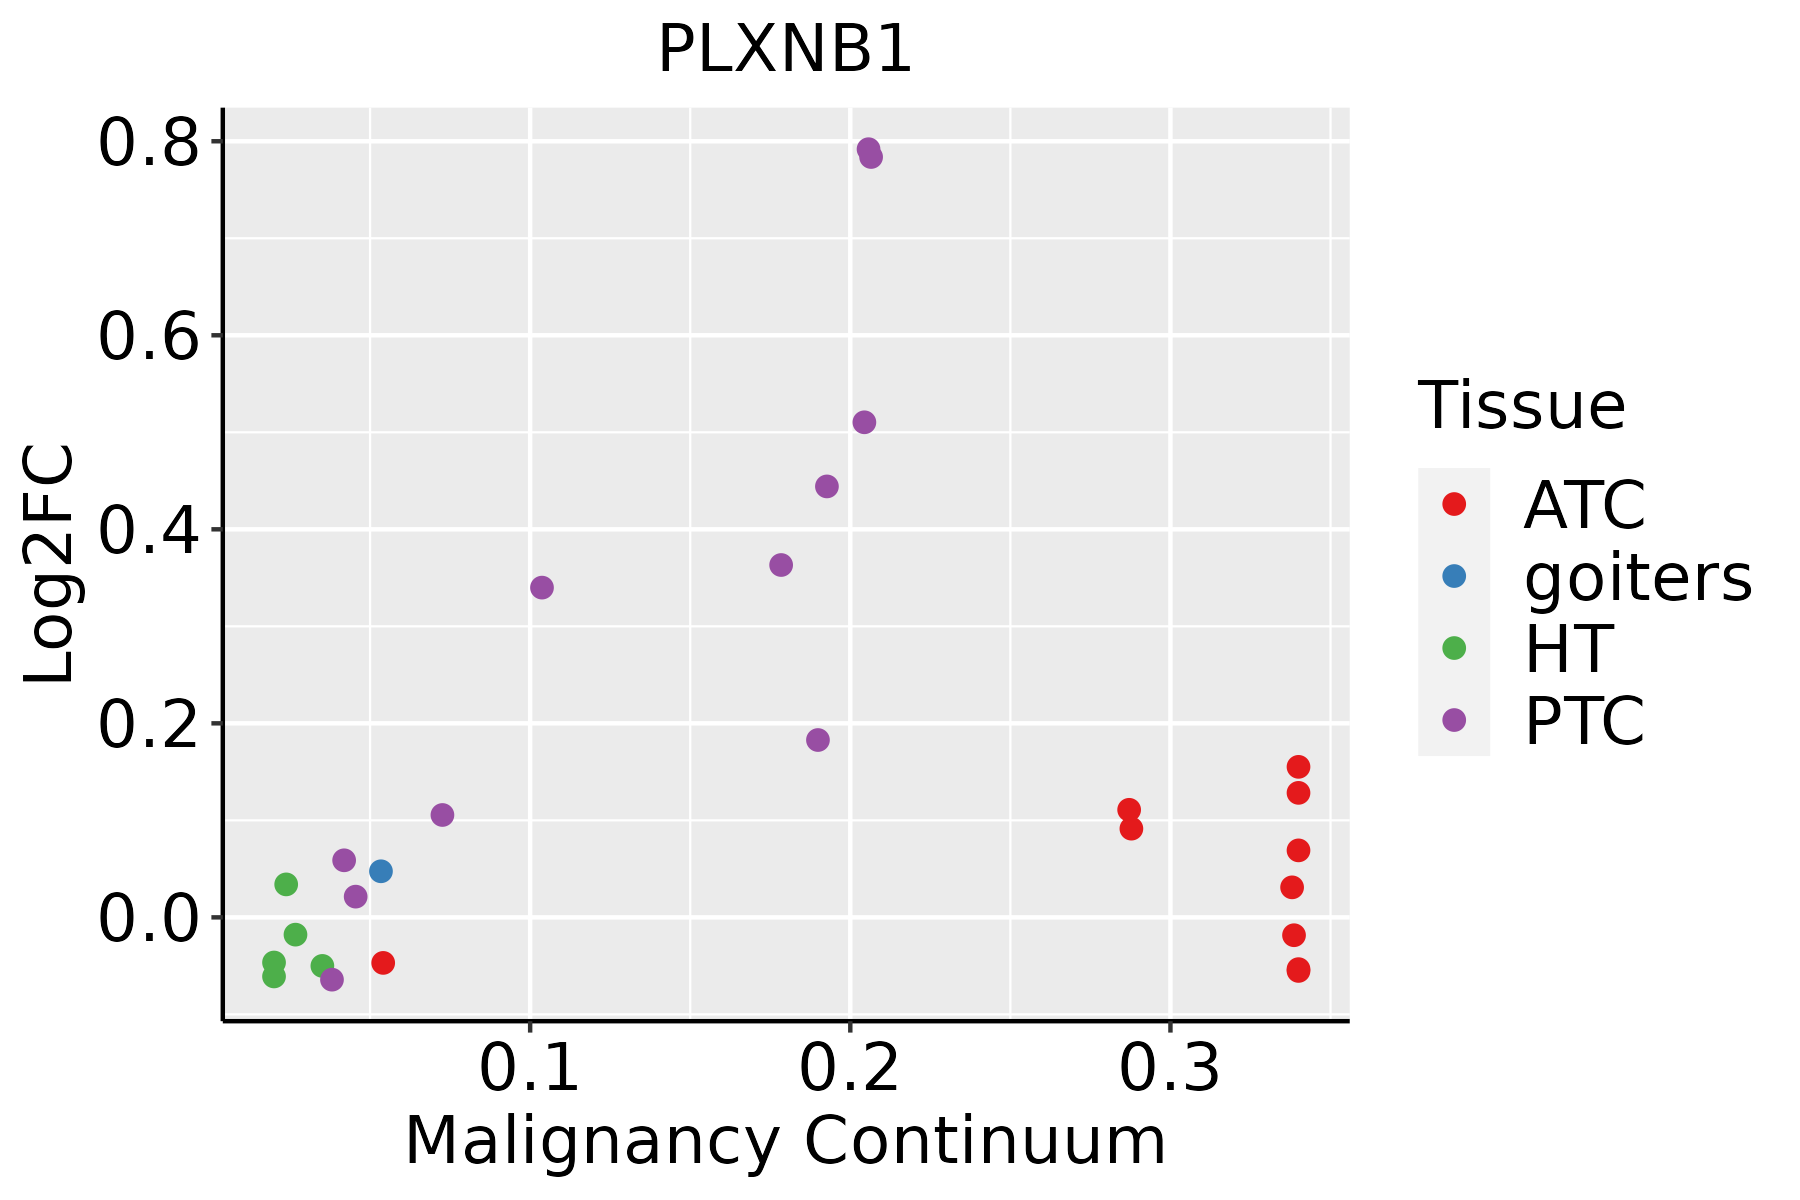 | ATC: Anaplastic thyroid cancer |
| HT: Hashimoto's thyroiditis | ||
| PTC: Papillary thyroid cancer |
| ∗log2FC in expression of this searched gene in stem-like cells from each diseased tissue sample relative to stem-like cells in normal samples in each tissue plotted against the malignancy continuum. Samples are colored based on if they are from different disease stage. |
Top |
Malignant transformation related pathway analysis |
| Find out the enriched GO biological processes and KEGG pathways involved in transition from healthy to precancer to cancer |
| Tissue | Disease Stage | Enriched GO biological Processes |
| Colorectum | AD |  |
| Colorectum | SER |  |
| Colorectum | MSS |  |
| Colorectum | MSI-H |  |
| Colorectum | FAP |  |
| ∗Top 15 enriched GO BP terms are showed in the bar plot of each disease state in each tissue. Each row represents a significant GO biological process which is colored according to the -log10(p.adjust). |
| Page: 1 2 3 4 5 6 7 8 9 |
| GO ID | Tissue | Disease Stage | Description | Gene Ratio | Bg Ratio | pvalue | p.adjust | Count |
| GO:0022604 | Colorectum | AD | regulation of cell morphogenesis | 109/3918 | 309/18723 | 3.08e-09 | 2.07e-07 | 109 |
| GO:0034329 | Colorectum | AD | cell junction assembly | 136/3918 | 420/18723 | 2.02e-08 | 1.15e-06 | 136 |
| GO:0043087 | Colorectum | AD | regulation of GTPase activity | 110/3918 | 348/18723 | 1.64e-06 | 5.03e-05 | 110 |
| GO:0008360 | Colorectum | AD | regulation of cell shape | 56/3918 | 154/18723 | 7.01e-06 | 1.73e-04 | 56 |
| GO:0010975 | Colorectum | AD | regulation of neuron projection development | 129/3918 | 445/18723 | 2.88e-05 | 5.37e-04 | 129 |
| GO:0007409 | Colorectum | AD | axonogenesis | 122/3918 | 418/18723 | 3.36e-05 | 6.15e-04 | 122 |
| GO:0031346 | Colorectum | AD | positive regulation of cell projection organization | 104/3918 | 353/18723 | 8.26e-05 | 1.30e-03 | 104 |
| GO:0061564 | Colorectum | AD | axon development | 132/3918 | 467/18723 | 8.40e-05 | 1.31e-03 | 132 |
| GO:0010720 | Colorectum | AD | positive regulation of cell development | 87/3918 | 298/18723 | 4.17e-04 | 4.71e-03 | 87 |
| GO:0043547 | Colorectum | AD | positive regulation of GTPase activity | 75/3918 | 255/18723 | 7.95e-04 | 7.91e-03 | 75 |
| GO:0050770 | Colorectum | AD | regulation of axonogenesis | 49/3918 | 154/18723 | 9.88e-04 | 9.28e-03 | 49 |
| GO:0050767 | Colorectum | AD | regulation of neurogenesis | 99/3918 | 364/18723 | 2.35e-03 | 1.82e-02 | 99 |
| GO:0050808 | Colorectum | AD | synapse organization | 112/3918 | 426/18723 | 4.25e-03 | 2.92e-02 | 112 |
| GO:0050772 | Colorectum | AD | positive regulation of axonogenesis | 27/3918 | 79/18723 | 4.30e-03 | 2.95e-02 | 27 |
| GO:0048017 | Colorectum | AD | inositol lipid-mediated signaling | 53/3918 | 182/18723 | 5.35e-03 | 3.52e-02 | 53 |
| GO:0048015 | Colorectum | AD | phosphatidylinositol-mediated signaling | 52/3918 | 178/18723 | 5.37e-03 | 3.54e-02 | 52 |
| GO:0007411 | Colorectum | AD | axon guidance | 64/3918 | 227/18723 | 5.41e-03 | 3.55e-02 | 64 |
| GO:0097485 | Colorectum | AD | neuron projection guidance | 64/3918 | 228/18723 | 6.02e-03 | 3.78e-02 | 64 |
| GO:0001503 | Colorectum | AD | ossification | 106/3918 | 408/18723 | 7.68e-03 | 4.64e-02 | 106 |
| GO:00226042 | Colorectum | MSS | regulation of cell morphogenesis | 103/3467 | 309/18723 | 2.70e-10 | 2.56e-08 | 103 |
| Page: 1 2 3 4 5 6 7 8 9 10 11 12 13 |
| Pathway ID | Tissue | Disease Stage | Description | Gene Ratio | Bg Ratio | pvalue | p.adjust | qvalue | Count |
| hsa04360 | Colorectum | AD | Axon guidance | 61/2092 | 182/8465 | 4.36e-03 | 2.17e-02 | 1.38e-02 | 61 |
| hsa043601 | Colorectum | AD | Axon guidance | 61/2092 | 182/8465 | 4.36e-03 | 2.17e-02 | 1.38e-02 | 61 |
| hsa043602 | Colorectum | MSS | Axon guidance | 54/1875 | 182/8465 | 1.03e-02 | 3.69e-02 | 2.26e-02 | 54 |
| hsa043603 | Colorectum | MSS | Axon guidance | 54/1875 | 182/8465 | 1.03e-02 | 3.69e-02 | 2.26e-02 | 54 |
| hsa043604 | Colorectum | FAP | Axon guidance | 47/1404 | 182/8465 | 9.09e-04 | 5.20e-03 | 3.16e-03 | 47 |
| hsa043605 | Colorectum | FAP | Axon guidance | 47/1404 | 182/8465 | 9.09e-04 | 5.20e-03 | 3.16e-03 | 47 |
| hsa043606 | Colorectum | CRC | Axon guidance | 43/1091 | 182/8465 | 4.38e-05 | 8.70e-04 | 5.90e-04 | 43 |
| hsa043607 | Colorectum | CRC | Axon guidance | 43/1091 | 182/8465 | 4.38e-05 | 8.70e-04 | 5.90e-04 | 43 |
| hsa0436010 | Endometrium | AEH | Axon guidance | 39/1197 | 182/8465 | 4.47e-03 | 2.46e-02 | 1.80e-02 | 39 |
| hsa0436013 | Endometrium | AEH | Axon guidance | 39/1197 | 182/8465 | 4.47e-03 | 2.46e-02 | 1.80e-02 | 39 |
| hsa0436022 | Endometrium | EEC | Axon guidance | 39/1237 | 182/8465 | 7.78e-03 | 3.66e-02 | 2.73e-02 | 39 |
| hsa0436032 | Endometrium | EEC | Axon guidance | 39/1237 | 182/8465 | 7.78e-03 | 3.66e-02 | 2.73e-02 | 39 |
| hsa0436016 | Esophagus | ESCC | Axon guidance | 108/4205 | 182/8465 | 5.13e-03 | 1.30e-02 | 6.67e-03 | 108 |
| hsa0436017 | Esophagus | ESCC | Axon guidance | 108/4205 | 182/8465 | 5.13e-03 | 1.30e-02 | 6.67e-03 | 108 |
| hsa0436014 | Oral cavity | OSCC | Axon guidance | 97/3704 | 182/8465 | 5.59e-03 | 1.33e-02 | 6.76e-03 | 97 |
| hsa0436015 | Oral cavity | OSCC | Axon guidance | 97/3704 | 182/8465 | 5.59e-03 | 1.33e-02 | 6.76e-03 | 97 |
| Page: 1 |
Top |
Cell-cell communication analysis |
| Identification of potential cell-cell interactions between two cell types and their ligand-receptor pairs for different disease states |
| Ligand | Receptor | LRpair | Pathway | Tissue | Disease Stage |
| SEMA4A | PLXNB1 | SEMA4A_PLXNB1 | SEMA4 | Cervix | ADJ |
| SEMA4D | PLXNB1 | SEMA4D_PLXNB1 | SEMA4 | Cervix | ADJ |
| SEMA4A | PLXNB1 | SEMA4A_PLXNB1 | SEMA4 | Cervix | CC |
| SEMA4D | PLXNB1 | SEMA4D_PLXNB1 | SEMA4 | Cervix | CC |
| SEMA4A | PLXNB1 | SEMA4A_PLXNB1 | SEMA4 | CRC | AD |
| SEMA4D | PLXNB1 | SEMA4D_PLXNB1 | SEMA4 | CRC | AD |
| SEMA4A | PLXNB1 | SEMA4A_PLXNB1 | SEMA4 | CRC | MSI-H |
| SEMA4D | PLXNB1 | SEMA4D_PLXNB1 | SEMA4 | CRC | MSI-H |
| SEMA4D | PLXNB1 | SEMA4D_PLXNB1 | SEMA4 | CRC | MSS |
| SEMA4A | PLXNB1 | SEMA4A_PLXNB1 | SEMA4 | CRC | SER |
| SEMA4D | PLXNB1 | SEMA4D_PLXNB1 | SEMA4 | CRC | SER |
| SEMA4A | PLXNB1 | SEMA4A_PLXNB1 | SEMA4 | Endometrium | AEH |
| SEMA4D | PLXNB1 | SEMA4D_PLXNB1 | SEMA4 | Endometrium | AEH |
| SEMA4D | PLXNB1 | SEMA4D_PLXNB1 | SEMA4 | Endometrium | EEC |
| SEMA4D | PLXNB1 | SEMA4D_PLXNB1 | SEMA4 | Endometrium | Healthy |
| SEMA4A | PLXNB1 | SEMA4A_PLXNB1 | SEMA4 | HNSCC | ADJ |
| SEMA4A | PLXNB1 | SEMA4A_PLXNB1 | SEMA4 | HNSCC | Precancer |
| SEMA4D | PLXNB1 | SEMA4D_PLXNB1 | SEMA4 | HNSCC | Precancer |
| SEMA4D | PLXNB1 | SEMA4D_PLXNB1 | SEMA4 | Liver | Healthy |
| SEMA4D | PLXNB1 | SEMA4D_PLXNB1 | SEMA4 | Liver | Precancer |
| Page: 1 |
Top |
Single-cell gene regulatory network inference analysis |
| Find out the significant the regulons (TFs) and the target genes of each regulon across cell types for different disease states |
| TF | Cell Type | Tissue | Disease Stage | Target Gene | RSS | Regulon Activity |
| ∗The dot plots of a searched regulon are shown for all cell subpopulations in each disease state of each tissue based on the regulon specific score inferred using pySCENIC and by calculating the average expression. |
| Page: 1 |
Top |
Somatic mutation of malignant transformation related genes |
| Annotation of somatic variants for genes involved in malignant transformation |
| Hugo Symbol | Variant Class | Variant Classification | dbSNP RS | HGVSc | HGVSp | HGVSp Short | SWISSPROT | BIOTYPE | SIFT | PolyPhen | Tumor Sample Barcode | Tissue | Histology | Sex | Age | Stage | Therapy Types | Drugs | Outcome |
| PLXNB1 | SNV | Missense_Mutation | c.6394G>T | p.Val2132Phe | p.V2132F | O43157 | protein_coding | deleterious(0) | probably_damaging(0.998) | TCGA-A2-A04Y-01 | Breast | breast invasive carcinoma | Female | <65 | I/II | Chemotherapy | cytoxan | SD | |
| PLXNB1 | SNV | Missense_Mutation | novel | c.4634N>T | p.Thr1545Ile | p.T1545I | O43157 | protein_coding | deleterious(0) | probably_damaging(0.986) | TCGA-AC-A3W5-01 | Breast | breast invasive carcinoma | Female | >=65 | I/II | Chemotherapy | docetaxel | CR |
| PLXNB1 | SNV | Missense_Mutation | rs759375530 | c.1529N>A | p.Arg510His | p.R510H | O43157 | protein_coding | tolerated(0.09) | benign(0.015) | TCGA-AN-A046-01 | Breast | breast invasive carcinoma | Female | >=65 | I/II | Unknown | Unknown | SD |
| PLXNB1 | SNV | Missense_Mutation | c.3088N>G | p.Ser1030Gly | p.S1030G | O43157 | protein_coding | deleterious(0) | probably_damaging(0.91) | TCGA-AN-A0AK-01 | Breast | breast invasive carcinoma | Female | >=65 | I/II | Unknown | Unknown | SD | |
| PLXNB1 | SNV | Missense_Mutation | c.3085T>A | p.Cys1029Ser | p.C1029S | O43157 | protein_coding | deleterious(0) | possibly_damaging(0.82) | TCGA-AR-A24Z-01 | Breast | breast invasive carcinoma | Female | <65 | I/II | Chemotherapy | doxorubicin | SD | |
| PLXNB1 | SNV | Missense_Mutation | rs866132965 | c.2776N>T | p.Pro926Ser | p.P926S | O43157 | protein_coding | deleterious(0) | probably_damaging(0.998) | TCGA-D8-A1J8-01 | Breast | breast invasive carcinoma | Female | >=65 | I/II | Hormone Therapy | nolvadex | SD |
| PLXNB1 | SNV | Missense_Mutation | c.5135N>A | p.Arg1712Gln | p.R1712Q | O43157 | protein_coding | deleterious(0) | probably_damaging(0.999) | TCGA-D8-A1JA-01 | Breast | breast invasive carcinoma | Female | <65 | III/IV | Chemotherapy | adriamycin | PD | |
| PLXNB1 | insertion | In_Frame_Ins | novel | c.1721_1722insTGGCCCGGGGTC | p.Glu574delinsAspGlyProGlySer | p.E574delinsDGPGS | O43157 | protein_coding | TCGA-B6-A0IK-01 | Breast | breast invasive carcinoma | Female | <65 | III/IV | Unknown | Unknown | PD | ||
| PLXNB1 | insertion | Frame_Shift_Ins | novel | c.1720_1721insGTCCCAGTGTGAGAGTTTTTCTC | p.Glu574GlyfsTer16 | p.E574Gfs*16 | O43157 | protein_coding | TCGA-B6-A0IK-01 | Breast | breast invasive carcinoma | Female | <65 | III/IV | Unknown | Unknown | PD | ||
| PLXNB1 | deletion | Frame_Shift_Del | novel | c.4078delN | p.Leu1360TrpfsTer8 | p.L1360Wfs*8 | O43157 | protein_coding | TCGA-EW-A2FV-01 | Breast | breast invasive carcinoma | Female | <65 | III/IV | Chemotherapy | docetaxel | SD |
| Page: 1 2 3 4 5 6 7 8 9 10 11 12 13 14 15 16 |
Top |
Related drugs of malignant transformation related genes |
| Identification of chemicals and drugs interact with genes involved in malignant transfromation |
| (DGIdb 4.0) |
| Entrez ID | Symbol | Category | Interaction Types | Drug Claim Name | Drug Name | PMIDs |
| Page: 1 |

Copyright 2023-Present -The University of Texas Health Science Center at Houston |