
|
|||||
|
 | |
| |
| |
| |
| |
| |
|
Gene: PGP |
Gene summary for PGP |
| Gene information | Species | Human | Gene symbol | PGP | Gene ID | 283871 |
| Gene name | phosphoglycolate phosphatase | |
| Gene Alias | AUM | |
| Cytomap | 16p13.3 | |
| Gene Type | protein-coding | GO ID | GO:0005975 | UniProtAcc | A6NDG6 |
Top |
Malignant transformation analysis |
| Identification of the aberrant gene expression in precancerous and cancerous lesions by comparing the gene expression of stem-like cells in diseased tissues with normal stem cells |
| Entrez ID | Symbol | Replicates | Species | Organ | Tissue | Adj P-value | Log2FC | Malignancy |
| 283871 | PGP | P130T-E | Human | Esophagus | ESCC | 6.31e-57 | 1.02e+00 | 0.1676 |
| 283871 | PGP | HCC1_Meng | Human | Liver | HCC | 2.34e-67 | 3.80e-01 | 0.0246 |
| 283871 | PGP | HCC2_Meng | Human | Liver | HCC | 2.11e-11 | 1.35e-01 | 0.0107 |
| 283871 | PGP | HCC1 | Human | Liver | HCC | 1.68e-02 | 3.91e+00 | 0.5336 |
| 283871 | PGP | HCC2 | Human | Liver | HCC | 4.84e-10 | 2.62e+00 | 0.5341 |
| 283871 | PGP | Pt13.b | Human | Liver | HCC | 5.01e-14 | 2.74e-01 | 0.0251 |
| 283871 | PGP | S014 | Human | Liver | HCC | 2.93e-30 | 1.09e+00 | 0.2254 |
| 283871 | PGP | S015 | Human | Liver | HCC | 1.01e-26 | 1.02e+00 | 0.2375 |
| 283871 | PGP | S016 | Human | Liver | HCC | 2.79e-27 | 9.28e-01 | 0.2243 |
| 283871 | PGP | S027 | Human | Liver | HCC | 2.87e-15 | 1.19e+00 | 0.2446 |
| 283871 | PGP | S028 | Human | Liver | HCC | 1.07e-33 | 1.36e+00 | 0.2503 |
| 283871 | PGP | S029 | Human | Liver | HCC | 1.86e-25 | 1.32e+00 | 0.2581 |
| 283871 | PGP | C04 | Human | Oral cavity | OSCC | 9.25e-19 | 1.35e+00 | 0.2633 |
| 283871 | PGP | C21 | Human | Oral cavity | OSCC | 6.81e-55 | 1.72e+00 | 0.2678 |
| 283871 | PGP | C30 | Human | Oral cavity | OSCC | 3.00e-46 | 2.06e+00 | 0.3055 |
| 283871 | PGP | C38 | Human | Oral cavity | OSCC | 1.13e-07 | 1.48e+00 | 0.172 |
| 283871 | PGP | C43 | Human | Oral cavity | OSCC | 7.96e-17 | 3.75e-01 | 0.1704 |
| 283871 | PGP | C46 | Human | Oral cavity | OSCC | 6.95e-07 | 3.71e-01 | 0.1673 |
| 283871 | PGP | C51 | Human | Oral cavity | OSCC | 4.67e-14 | 9.77e-01 | 0.2674 |
| 283871 | PGP | C57 | Human | Oral cavity | OSCC | 4.21e-11 | 5.34e-01 | 0.1679 |
| Page: 1 2 3 4 5 6 |
| Tissue | Expression Dynamics | Abbreviation |
| Esophagus | 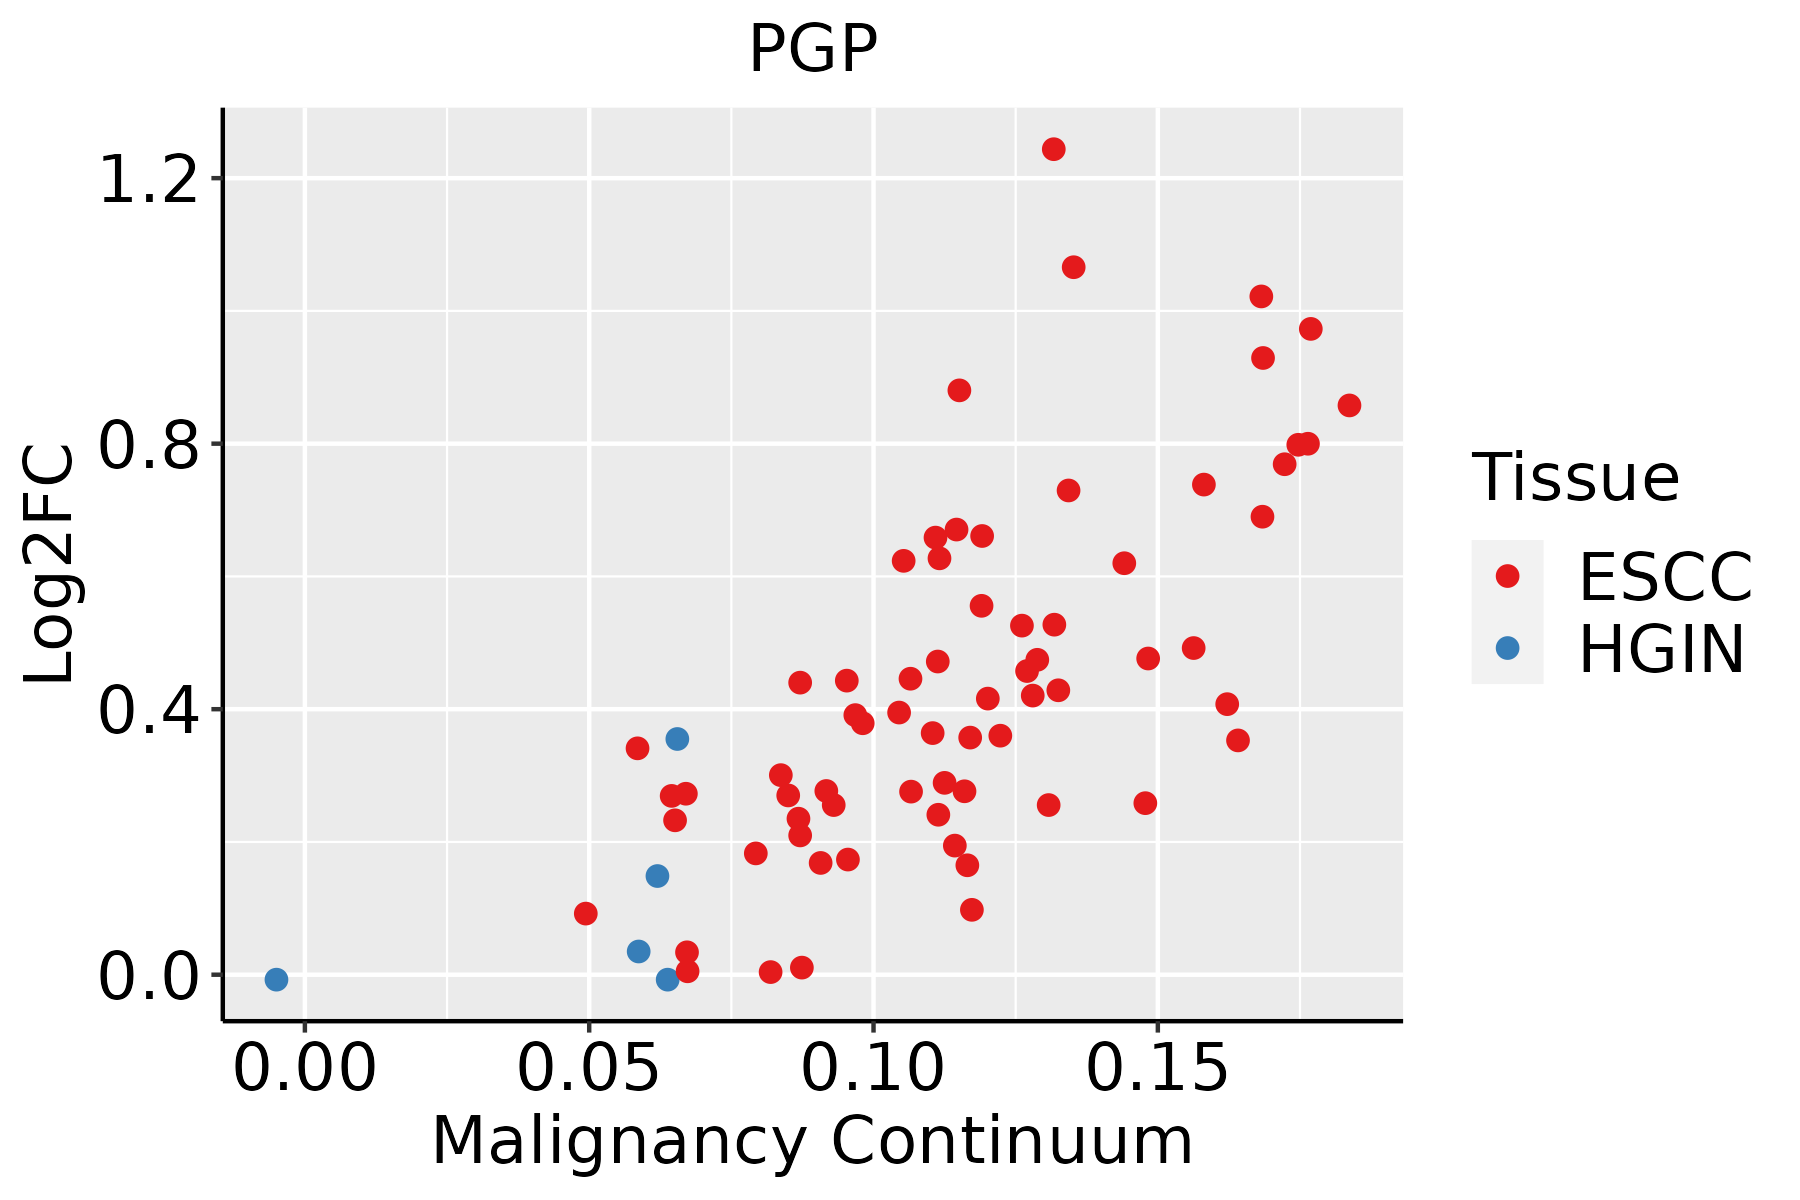 | ESCC: Esophageal squamous cell carcinoma |
| HGIN: High-grade intraepithelial neoplasias | ||
| LGIN: Low-grade intraepithelial neoplasias | ||
| Liver | 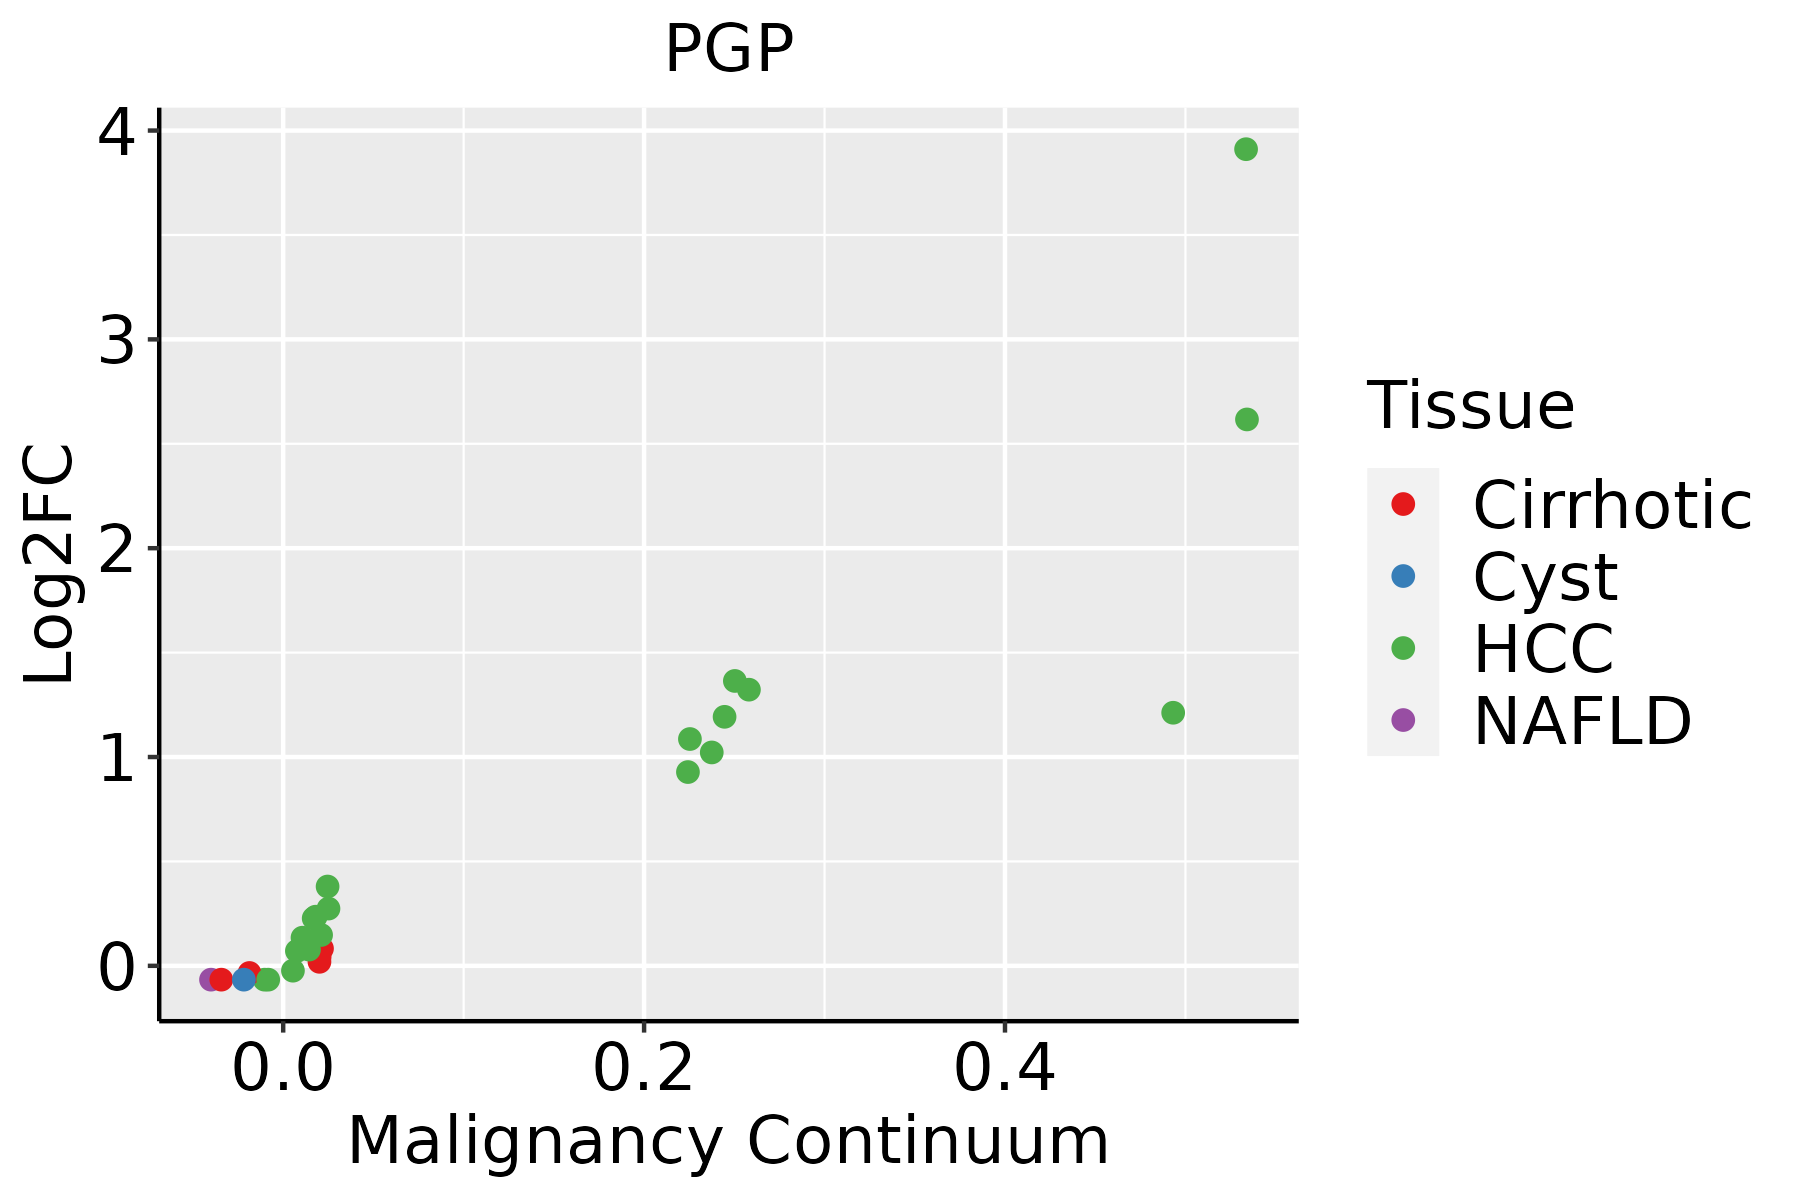 | HCC: Hepatocellular carcinoma |
| NAFLD: Non-alcoholic fatty liver disease | ||
| Oral Cavity | 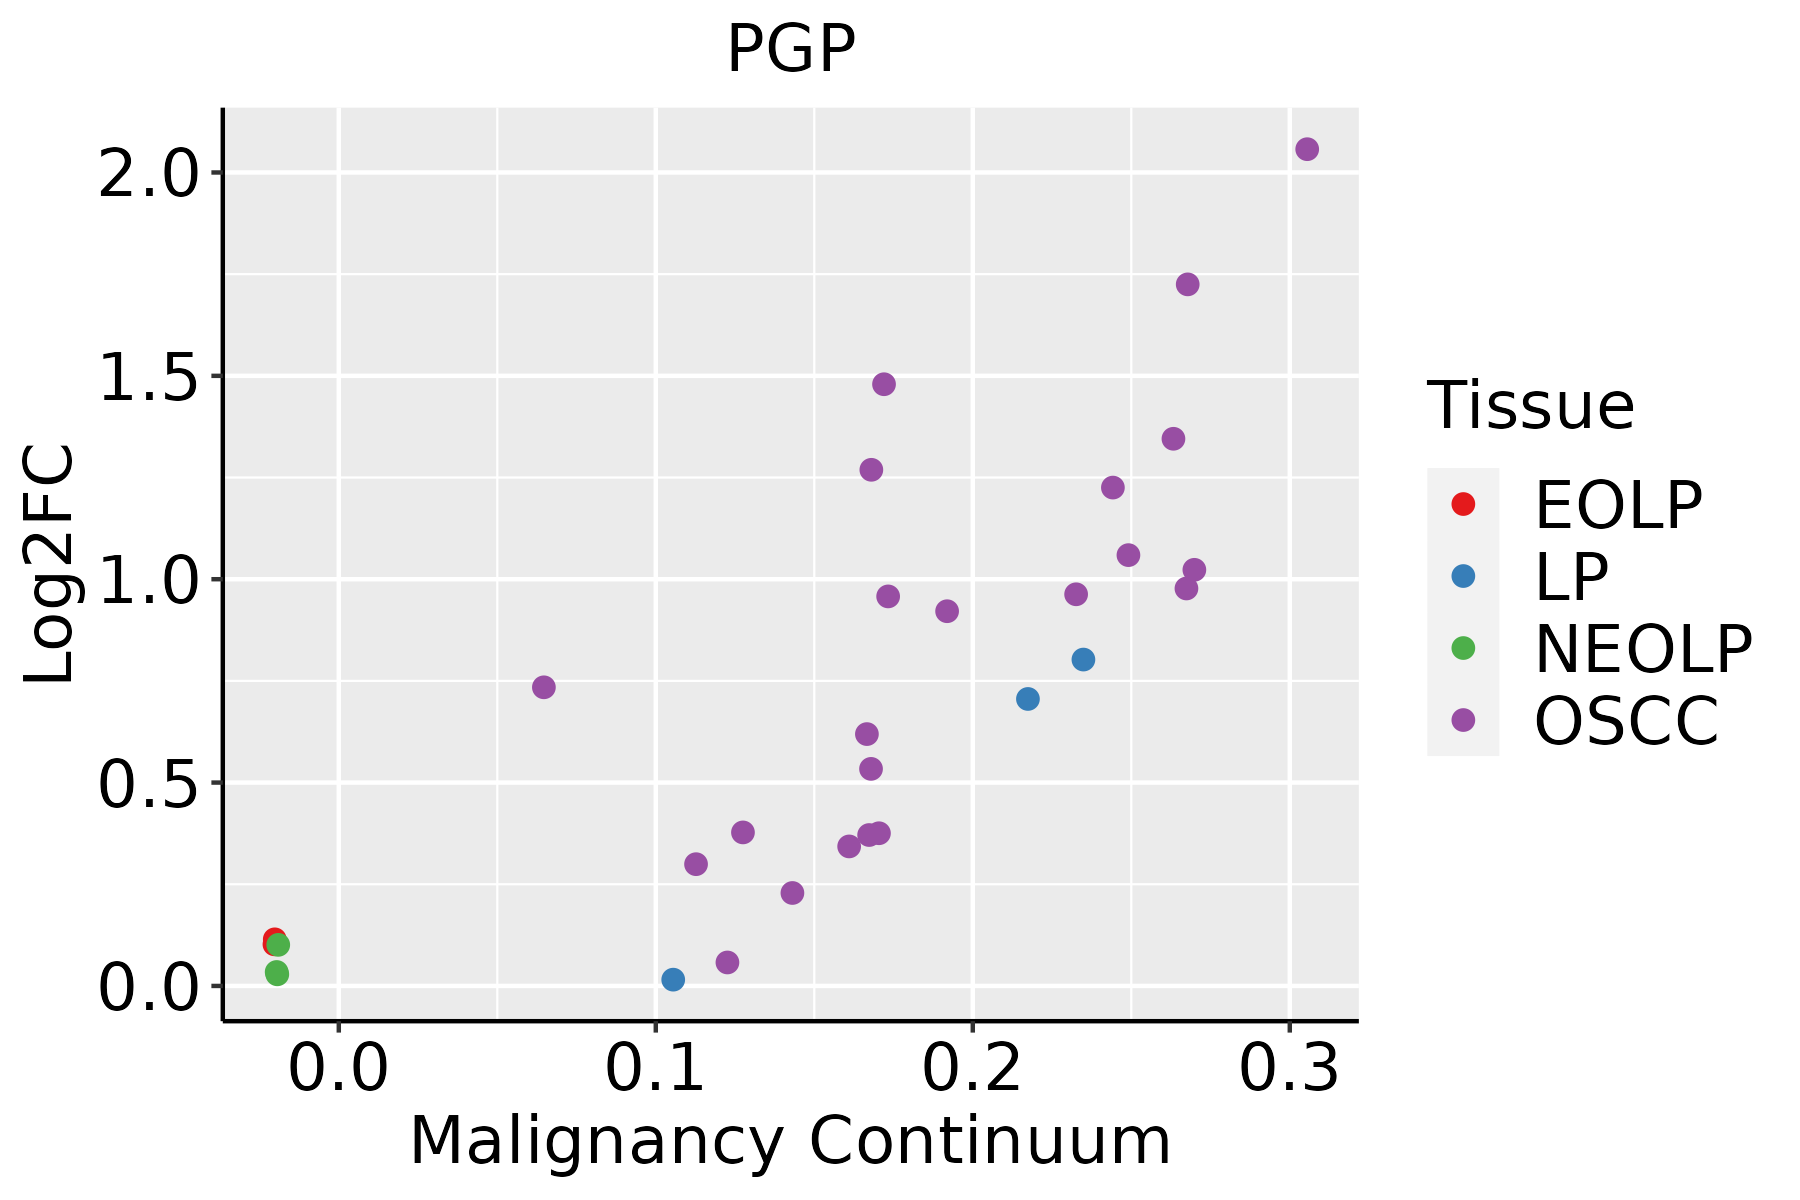 | EOLP: Erosive Oral lichen planus |
| LP: leukoplakia | ||
| NEOLP: Non-erosive oral lichen planus | ||
| OSCC: Oral squamous cell carcinoma | ||
| Skin | 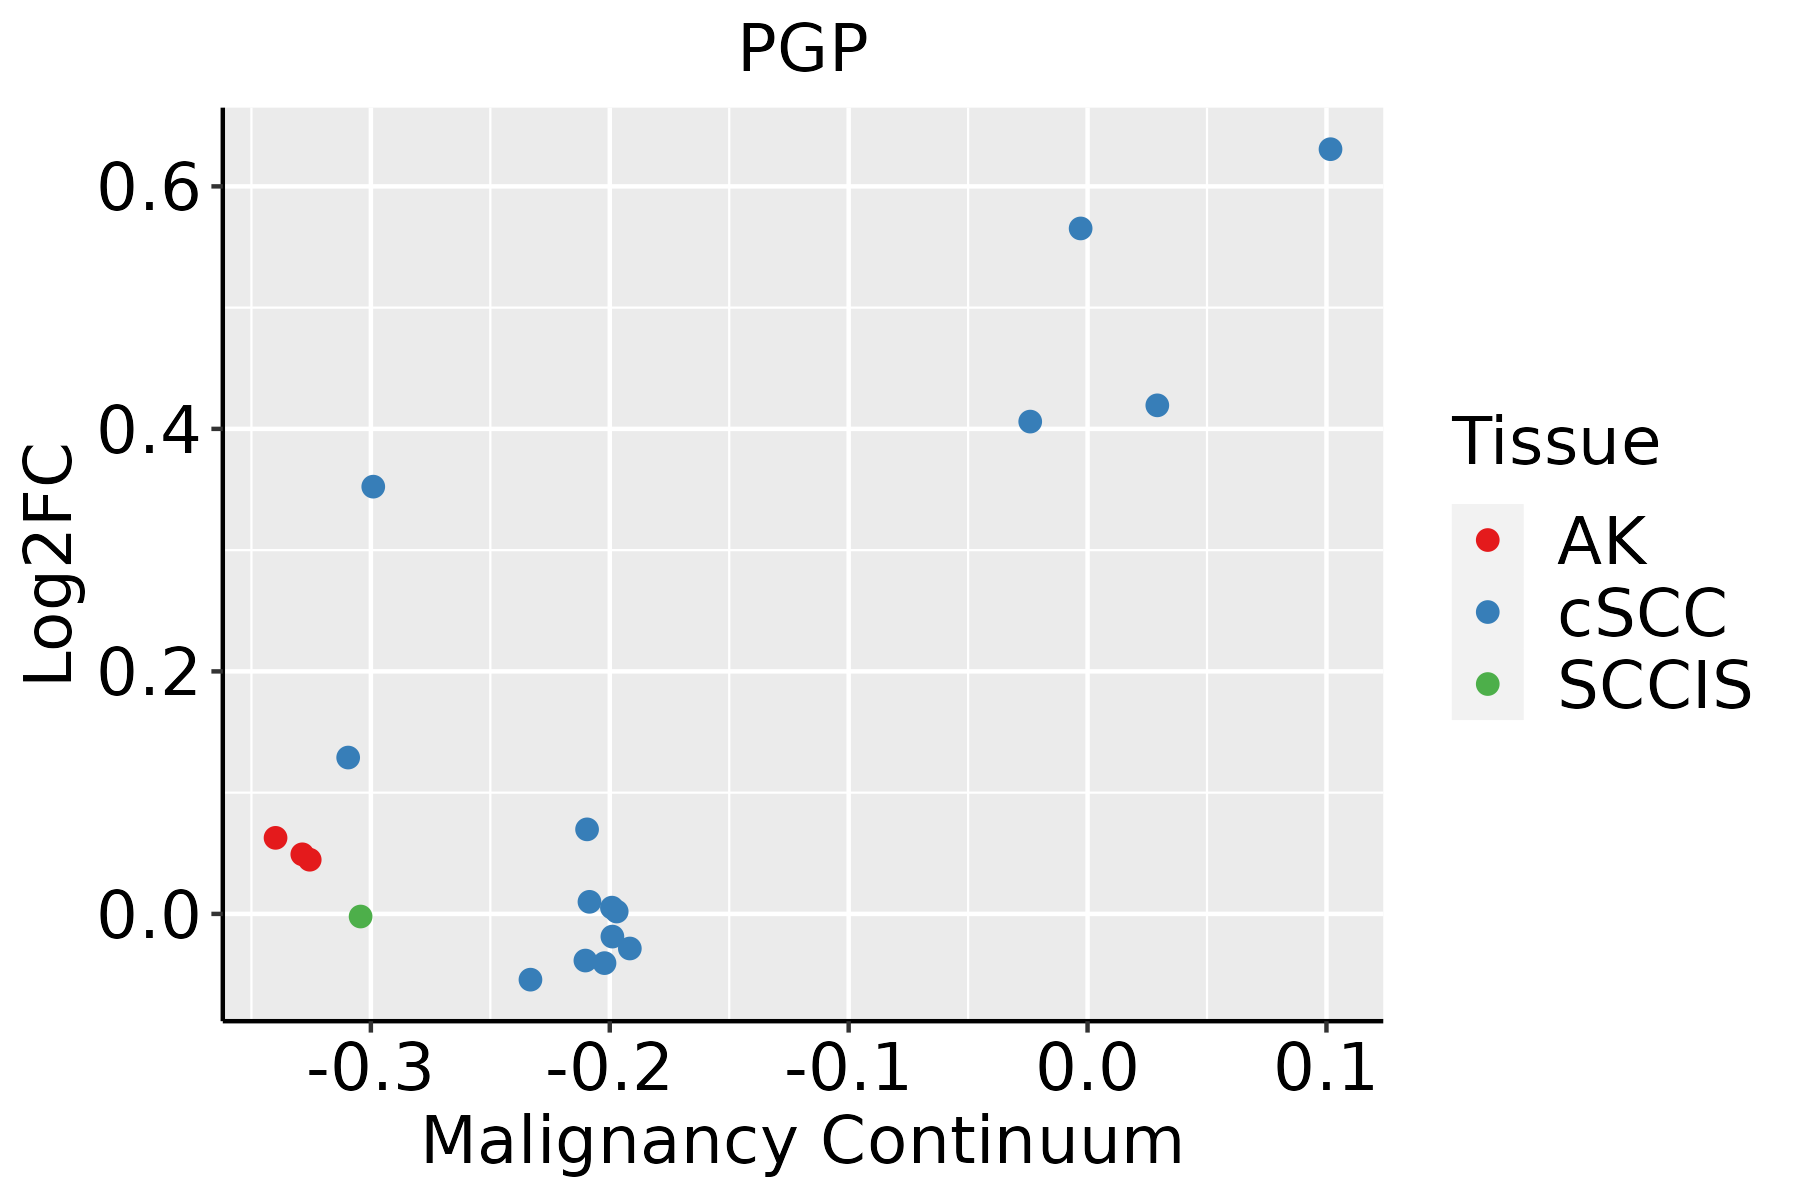 | AK: Actinic keratosis |
| cSCC: Cutaneous squamous cell carcinoma | ||
| SCCIS:squamous cell carcinoma in situ | ||
| Thyroid | 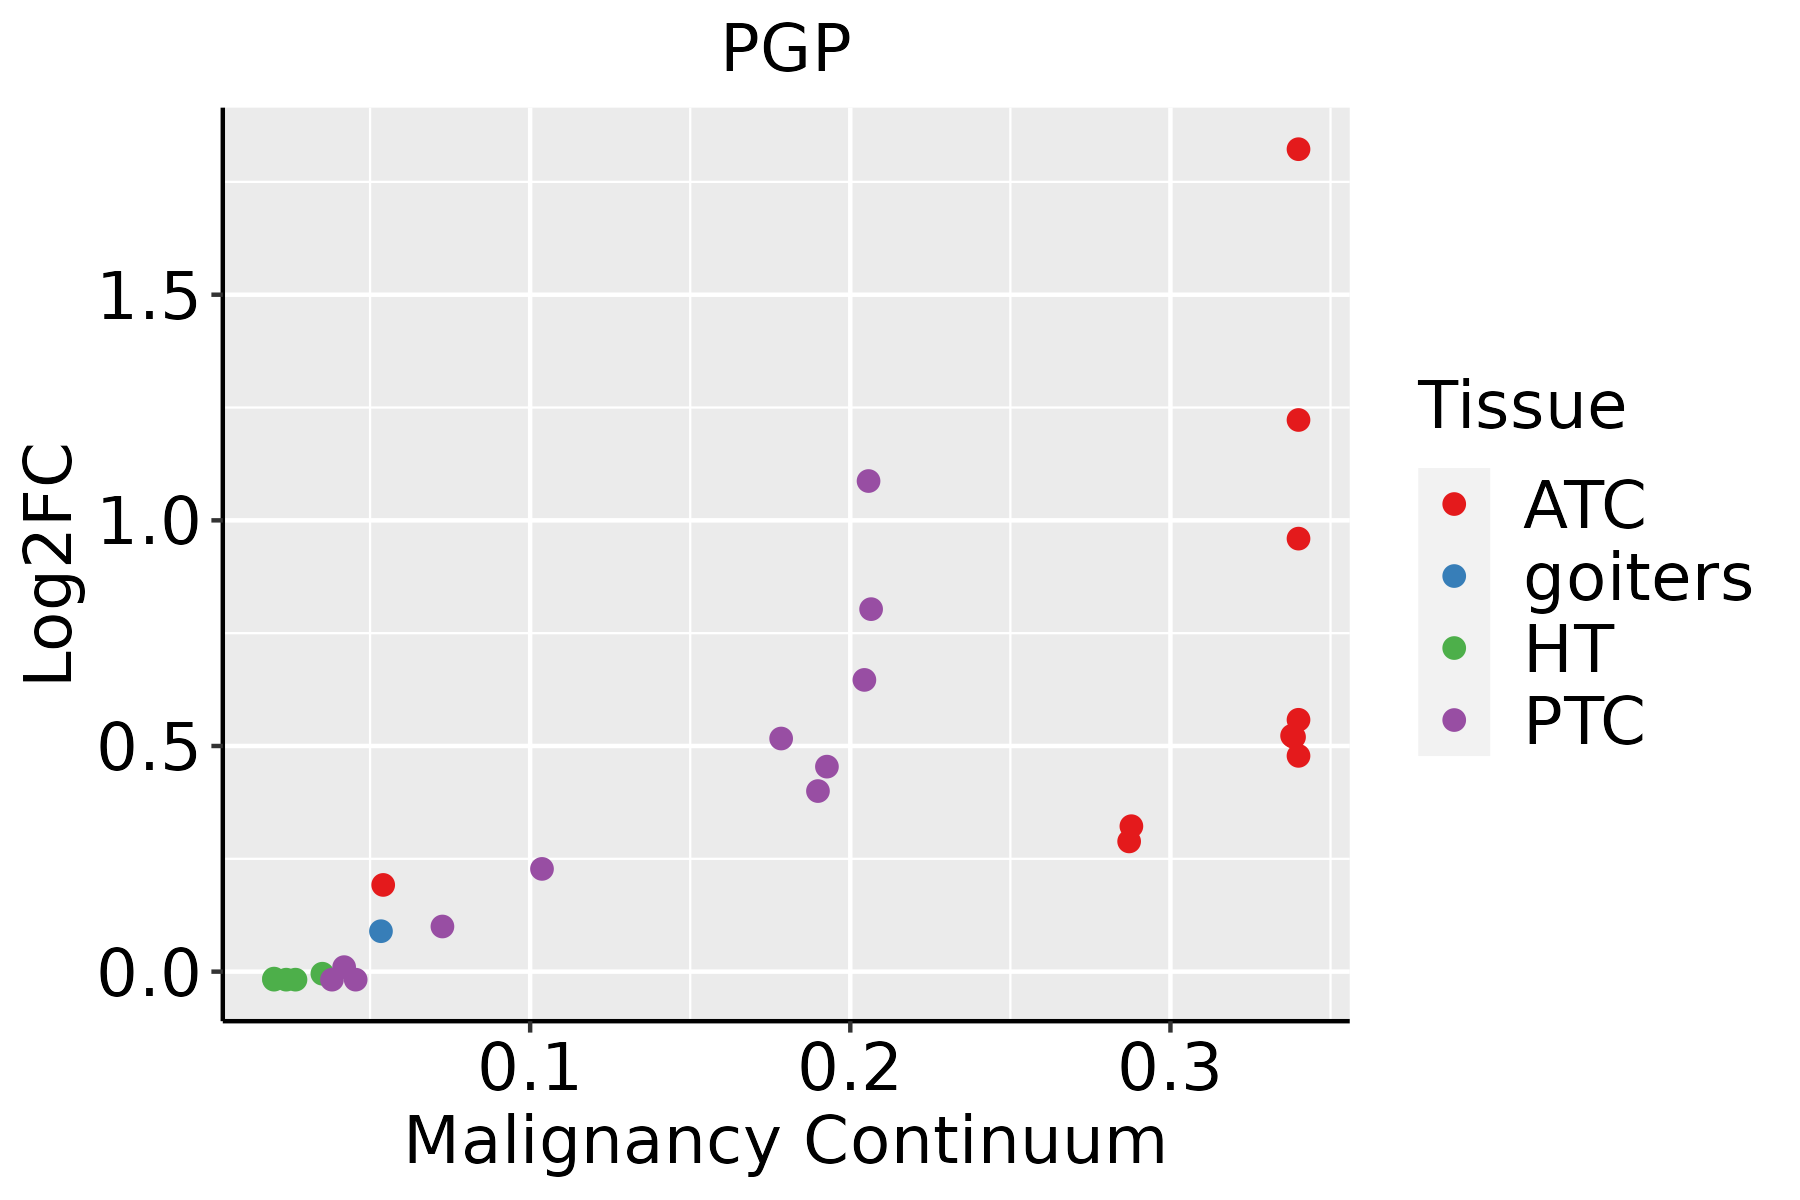 | ATC: Anaplastic thyroid cancer |
| HT: Hashimoto's thyroiditis | ||
| PTC: Papillary thyroid cancer |
| ∗log2FC in expression of this searched gene in stem-like cells from each diseased tissue sample relative to stem-like cells in normal samples in each tissue plotted against the malignancy continuum. Samples are colored based on if they are from different disease stage. |
Top |
Malignant transformation related pathway analysis |
| Find out the enriched GO biological processes and KEGG pathways involved in transition from healthy to precancer to cancer |
| Tissue | Disease Stage | Enriched GO biological Processes |
| Colorectum | AD |  |
| Colorectum | SER |  |
| Colorectum | MSS |  |
| Colorectum | MSI-H |  |
| Colorectum | FAP |  |
| ∗Top 15 enriched GO BP terms are showed in the bar plot of each disease state in each tissue. Each row represents a significant GO biological process which is colored according to the -log10(p.adjust). |
| Page: 1 2 3 4 5 6 7 8 9 |
| GO ID | Tissue | Disease Stage | Description | Gene Ratio | Bg Ratio | pvalue | p.adjust | Count |
| GO:001631110 | Esophagus | ESCC | dephosphorylation | 251/8552 | 417/18723 | 1.26e-09 | 2.99e-08 | 251 |
| GO:000647018 | Esophagus | ESCC | protein dephosphorylation | 177/8552 | 281/18723 | 3.13e-09 | 6.72e-08 | 177 |
| GO:00059969 | Esophagus | ESCC | monosaccharide metabolic process | 159/8552 | 257/18723 | 1.11e-07 | 1.81e-06 | 159 |
| GO:00193189 | Esophagus | ESCC | hexose metabolic process | 147/8552 | 237/18723 | 2.63e-07 | 3.94e-06 | 147 |
| GO:00066446 | Esophagus | ESCC | phospholipid metabolic process | 218/8552 | 383/18723 | 5.37e-06 | 5.59e-05 | 218 |
| GO:00060668 | Esophagus | ESCC | alcohol metabolic process | 202/8552 | 353/18723 | 7.32e-06 | 7.26e-05 | 202 |
| GO:00060069 | Esophagus | ESCC | glucose metabolic process | 119/8552 | 196/18723 | 1.51e-05 | 1.36e-04 | 119 |
| GO:00066505 | Esophagus | ESCC | glycerophospholipid metabolic process | 174/8552 | 306/18723 | 4.92e-05 | 3.85e-04 | 174 |
| GO:00442626 | Esophagus | ESCC | cellular carbohydrate metabolic process | 160/8552 | 283/18723 | 1.43e-04 | 9.66e-04 | 160 |
| GO:00160514 | Esophagus | ESCC | carbohydrate biosynthetic process | 117/8552 | 202/18723 | 2.96e-04 | 1.79e-03 | 117 |
| GO:00620129 | Esophagus | ESCC | regulation of small molecule metabolic process | 184/8552 | 334/18723 | 3.11e-04 | 1.85e-03 | 184 |
| GO:00464864 | Esophagus | ESCC | glycerolipid metabolic process | 211/8552 | 392/18723 | 6.51e-04 | 3.46e-03 | 211 |
| GO:00461653 | Esophagus | ESCC | alcohol biosynthetic process | 83/8552 | 140/18723 | 8.04e-04 | 4.16e-03 | 83 |
| GO:00463643 | Esophagus | ESCC | monosaccharide biosynthetic process | 52/8552 | 82/18723 | 9.03e-04 | 4.61e-03 | 52 |
| GO:00109065 | Esophagus | ESCC | regulation of glucose metabolic process | 71/8552 | 119/18723 | 1.46e-03 | 6.92e-03 | 71 |
| GO:00193193 | Esophagus | ESCC | hexose biosynthetic process | 49/8552 | 78/18723 | 1.69e-03 | 7.81e-03 | 49 |
| GO:00061096 | Esophagus | ESCC | regulation of carbohydrate metabolic process | 101/8552 | 178/18723 | 1.89e-03 | 8.52e-03 | 101 |
| GO:00106755 | Esophagus | ESCC | regulation of cellular carbohydrate metabolic process | 83/8552 | 146/18723 | 4.24e-03 | 1.69e-02 | 83 |
| GO:00060943 | Esophagus | ESCC | gluconeogenesis | 46/8552 | 75/18723 | 4.54e-03 | 1.78e-02 | 46 |
| GO:19016174 | Esophagus | ESCC | organic hydroxy compound biosynthetic process | 128/8552 | 237/18723 | 5.86e-03 | 2.16e-02 | 128 |
| Page: 1 2 3 4 5 |
| Pathway ID | Tissue | Disease Stage | Description | Gene Ratio | Bg Ratio | pvalue | p.adjust | qvalue | Count |
| hsa0120023 | Esophagus | ESCC | Carbon metabolism | 79/4205 | 115/8465 | 2.50e-05 | 1.21e-04 | 6.22e-05 | 79 |
| hsa0120033 | Esophagus | ESCC | Carbon metabolism | 79/4205 | 115/8465 | 2.50e-05 | 1.21e-04 | 6.22e-05 | 79 |
| hsa0120041 | Liver | HCC | Carbon metabolism | 89/4020 | 115/8465 | 3.92e-11 | 6.56e-10 | 3.65e-10 | 89 |
| hsa0063021 | Liver | HCC | Glyoxylate and dicarboxylate metabolism | 24/4020 | 30/8465 | 2.66e-04 | 1.24e-03 | 6.88e-04 | 24 |
| hsa0120051 | Liver | HCC | Carbon metabolism | 89/4020 | 115/8465 | 3.92e-11 | 6.56e-10 | 3.65e-10 | 89 |
| hsa0063031 | Liver | HCC | Glyoxylate and dicarboxylate metabolism | 24/4020 | 30/8465 | 2.66e-04 | 1.24e-03 | 6.88e-04 | 24 |
| hsa0120014 | Oral cavity | OSCC | Carbon metabolism | 74/3704 | 115/8465 | 6.10e-06 | 3.05e-05 | 1.55e-05 | 74 |
| hsa0120015 | Oral cavity | OSCC | Carbon metabolism | 74/3704 | 115/8465 | 6.10e-06 | 3.05e-05 | 1.55e-05 | 74 |
| hsa0120022 | Oral cavity | LP | Carbon metabolism | 62/2418 | 115/8465 | 8.38e-09 | 1.39e-07 | 8.99e-08 | 62 |
| hsa0120032 | Oral cavity | LP | Carbon metabolism | 62/2418 | 115/8465 | 8.38e-09 | 1.39e-07 | 8.99e-08 | 62 |
| Page: 1 |
Top |
Cell-cell communication analysis |
| Identification of potential cell-cell interactions between two cell types and their ligand-receptor pairs for different disease states |
| Ligand | Receptor | LRpair | Pathway | Tissue | Disease Stage |
| Page: 1 |
Top |
Single-cell gene regulatory network inference analysis |
| Find out the significant the regulons (TFs) and the target genes of each regulon across cell types for different disease states |
| TF | Cell Type | Tissue | Disease Stage | Target Gene | RSS | Regulon Activity |
| ∗The dot plots of a searched regulon are shown for all cell subpopulations in each disease state of each tissue based on the regulon specific score inferred using pySCENIC and by calculating the average expression. |
| Page: 1 |
Top |
Somatic mutation of malignant transformation related genes |
| Annotation of somatic variants for genes involved in malignant transformation |
| Hugo Symbol | Variant Class | Variant Classification | dbSNP RS | HGVSc | HGVSp | HGVSp Short | SWISSPROT | BIOTYPE | SIFT | PolyPhen | Tumor Sample Barcode | Tissue | Histology | Sex | Age | Stage | Therapy Types | Drugs | Outcome |
| PGP | SNV | Missense_Mutation | novel | c.818N>T | p.Gly273Val | p.G273V | A6NDG6 | protein_coding | deleterious(0) | probably_damaging(0.987) | TCGA-C8-A274-01 | Breast | breast invasive carcinoma | Female | <65 | I/II | Hormone Therapy | tamoxiphen | SD |
| PGP | insertion | In_Frame_Ins | novel | c.707_708insGGACTGGATTTCCCC | p.Pro236_Ser237insAspTrpIleSerPro | p.P236_S237insDWISP | A6NDG6 | protein_coding | TCGA-AN-A04C-01 | Breast | breast invasive carcinoma | Female | <65 | I/II | Unknown | Unknown | SD | ||
| PGP | deletion | Frame_Shift_Del | c.799_814delNNNNNNNNNNNNNNNN | p.Leu267ValfsTer3 | p.L267Vfs*3 | A6NDG6 | protein_coding | TCGA-E9-A22A-01 | Breast | breast invasive carcinoma | Female | >=65 | I/II | Hormone Therapy | tamoxiphen | SD | |||
| PGP | deletion | Frame_Shift_Del | novel | c.679delC | p.Gln227SerfsTer42 | p.Q227Sfs*42 | A6NDG6 | protein_coding | TCGA-EW-A2FV-01 | Breast | breast invasive carcinoma | Female | <65 | III/IV | Chemotherapy | docetaxel | SD | ||
| PGP | SNV | Missense_Mutation | novel | c.823N>G | p.Lys275Glu | p.K275E | A6NDG6 | protein_coding | tolerated(0.25) | benign(0.079) | TCGA-AP-A05O-01 | Endometrium | uterine corpus endometrioid carcinoma | Female | >=65 | I/II | Chemotherapy | carboplatin | PD |
| PGP | SNV | Missense_Mutation | novel | c.890N>A | p.Cys297Tyr | p.C297Y | A6NDG6 | protein_coding | tolerated(0.08) | probably_damaging(0.937) | TCGA-DF-A2KU-01 | Endometrium | uterine corpus endometrioid carcinoma | Female | Unknown | I/II | Unknown | Unknown | SD |
| PGP | SNV | Missense_Mutation | c.878N>T | p.Gln293Leu | p.Q293L | A6NDG6 | protein_coding | tolerated(0.17) | benign(0.012) | TCGA-ED-A459-01 | Liver | liver hepatocellular carcinoma | Male | <65 | I/II | Ancillary | alvesin | CR | |
| PGP | SNV | Missense_Mutation | c.680N>G | p.Gln227Arg | p.Q227R | A6NDG6 | protein_coding | tolerated(0.21) | benign(0.051) | TCGA-ED-A7XP-01 | Liver | liver hepatocellular carcinoma | Female | <65 | I/II | Unknown | Unknown | PD | |
| PGP | SNV | Missense_Mutation | novel | c.528N>G | p.Phe176Leu | p.F176L | A6NDG6 | protein_coding | tolerated(0.15) | benign(0.261) | TCGA-CN-4731-01 | Oral cavity | head & neck squamous cell carcinoma | Female | <65 | I/II | Chemotherapy | erbitux | PD |
| PGP | SNV | Missense_Mutation | c.892N>A | p.Val298Met | p.V298M | A6NDG6 | protein_coding | tolerated(0.29) | benign(0.003) | TCGA-BR-4362-01 | Stomach | stomach adenocarcinoma | Female | >=65 | I/II | Unknown | Unknown | SD |
| Page: 1 2 |
Top |
Related drugs of malignant transformation related genes |
| Identification of chemicals and drugs interact with genes involved in malignant transfromation |
| (DGIdb 4.0) |
| Entrez ID | Symbol | Category | Interaction Types | Drug Claim Name | Drug Name | PMIDs |
| 283871 | PGP | NA | ETOPOSIDE | ETOPOSIDE | ||
| 283871 | PGP | NA | DOCETAXEL | DOCETAXEL | ||
| 283871 | PGP | NA | PACLITAXEL | PACLITAXEL |
| Page: 1 |

Copyright 2023-Present -The University of Texas Health Science Center at Houston |