
|
|||||
|
 | |
| |
| |
| |
| |
| |
|
Gene: PCMTD2 |
Gene summary for PCMTD2 |
| Gene information | Species | Human | Gene symbol | PCMTD2 | Gene ID | 55251 |
| Gene name | protein-L-isoaspartate (D-aspartate) O-methyltransferase domain containing 2 | |
| Gene Alias | C20orf36 | |
| Cytomap | 20q13.33 | |
| Gene Type | protein-coding | GO ID | GO:0006464 | UniProtAcc | Q9NV79 |
Top |
Malignant transformation analysis |
| Identification of the aberrant gene expression in precancerous and cancerous lesions by comparing the gene expression of stem-like cells in diseased tissues with normal stem cells |
| Entrez ID | Symbol | Replicates | Species | Organ | Tissue | Adj P-value | Log2FC | Malignancy |
| 55251 | PCMTD2 | P128T-E | Human | Esophagus | ESCC | 5.37e-21 | 6.59e-01 | 0.1241 |
| 55251 | PCMTD2 | P130T-E | Human | Esophagus | ESCC | 2.55e-16 | 3.45e-01 | 0.1676 |
| 55251 | PCMTD2 | HCC1_Meng | Human | Liver | HCC | 1.12e-35 | 1.52e-02 | 0.0246 |
| 55251 | PCMTD2 | HCC2_Meng | Human | Liver | HCC | 9.37e-30 | 1.29e-01 | 0.0107 |
| 55251 | PCMTD2 | HCC1 | Human | Liver | HCC | 2.00e-13 | 4.65e+00 | 0.5336 |
| 55251 | PCMTD2 | HCC2 | Human | Liver | HCC | 1.74e-09 | 2.73e+00 | 0.5341 |
| 55251 | PCMTD2 | Pt14.a | Human | Liver | HCC | 9.92e-04 | 3.40e-01 | 0.0169 |
| 55251 | PCMTD2 | S014 | Human | Liver | HCC | 2.26e-10 | 5.53e-01 | 0.2254 |
| 55251 | PCMTD2 | S015 | Human | Liver | HCC | 1.62e-10 | 7.31e-01 | 0.2375 |
| 55251 | PCMTD2 | S016 | Human | Liver | HCC | 1.79e-08 | 5.61e-01 | 0.2243 |
| 55251 | PCMTD2 | S028 | Human | Liver | HCC | 3.15e-06 | 5.70e-01 | 0.2503 |
| 55251 | PCMTD2 | S029 | Human | Liver | HCC | 2.42e-05 | 4.56e-01 | 0.2581 |
| 55251 | PCMTD2 | Dong_P1 | Human | Prostate | Tumor | 7.91e-09 | 5.87e-02 | 0.035 |
| 55251 | PCMTD2 | Dong_P3 | Human | Prostate | Tumor | 2.12e-09 | 1.43e-01 | 0.0278 |
| 55251 | PCMTD2 | Dong_P4 | Human | Prostate | Tumor | 2.20e-02 | 1.15e-01 | 0.0292 |
| 55251 | PCMTD2 | Dong_P5 | Human | Prostate | Tumor | 8.13e-19 | 8.35e-02 | 0.053 |
| 55251 | PCMTD2 | GSM5353221_PA_PB2A_Pool_1_3_S25_L001 | Human | Prostate | Tumor | 3.45e-12 | 6.36e-01 | 0.1633 |
| 55251 | PCMTD2 | GSM5353222_PA_PB2B_Pool_1_3_S52_L002 | Human | Prostate | Tumor | 4.36e-13 | 6.19e-01 | 0.1608 |
| 55251 | PCMTD2 | GSM5353223_PA_PB2B_Pool_2_S26_L001 | Human | Prostate | Tumor | 3.31e-07 | 5.72e-01 | 0.1604 |
| 55251 | PCMTD2 | GSM5353224_PA_PR5186_Pool_1_2_3_S27_L001 | Human | Prostate | Tumor | 4.55e-04 | 3.98e-01 | 0.1621 |
| Page: 1 2 3 4 5 |
| Tissue | Expression Dynamics | Abbreviation |
| Colorectum (GSE201348) |  | FAP: Familial adenomatous polyposis |
| CRC: Colorectal cancer | ||
| Colorectum (HTA11) |  | AD: Adenomas |
| SER: Sessile serrated lesions | ||
| MSI-H: Microsatellite-high colorectal cancer | ||
| MSS: Microsatellite stable colorectal cancer | ||
| Esophagus | 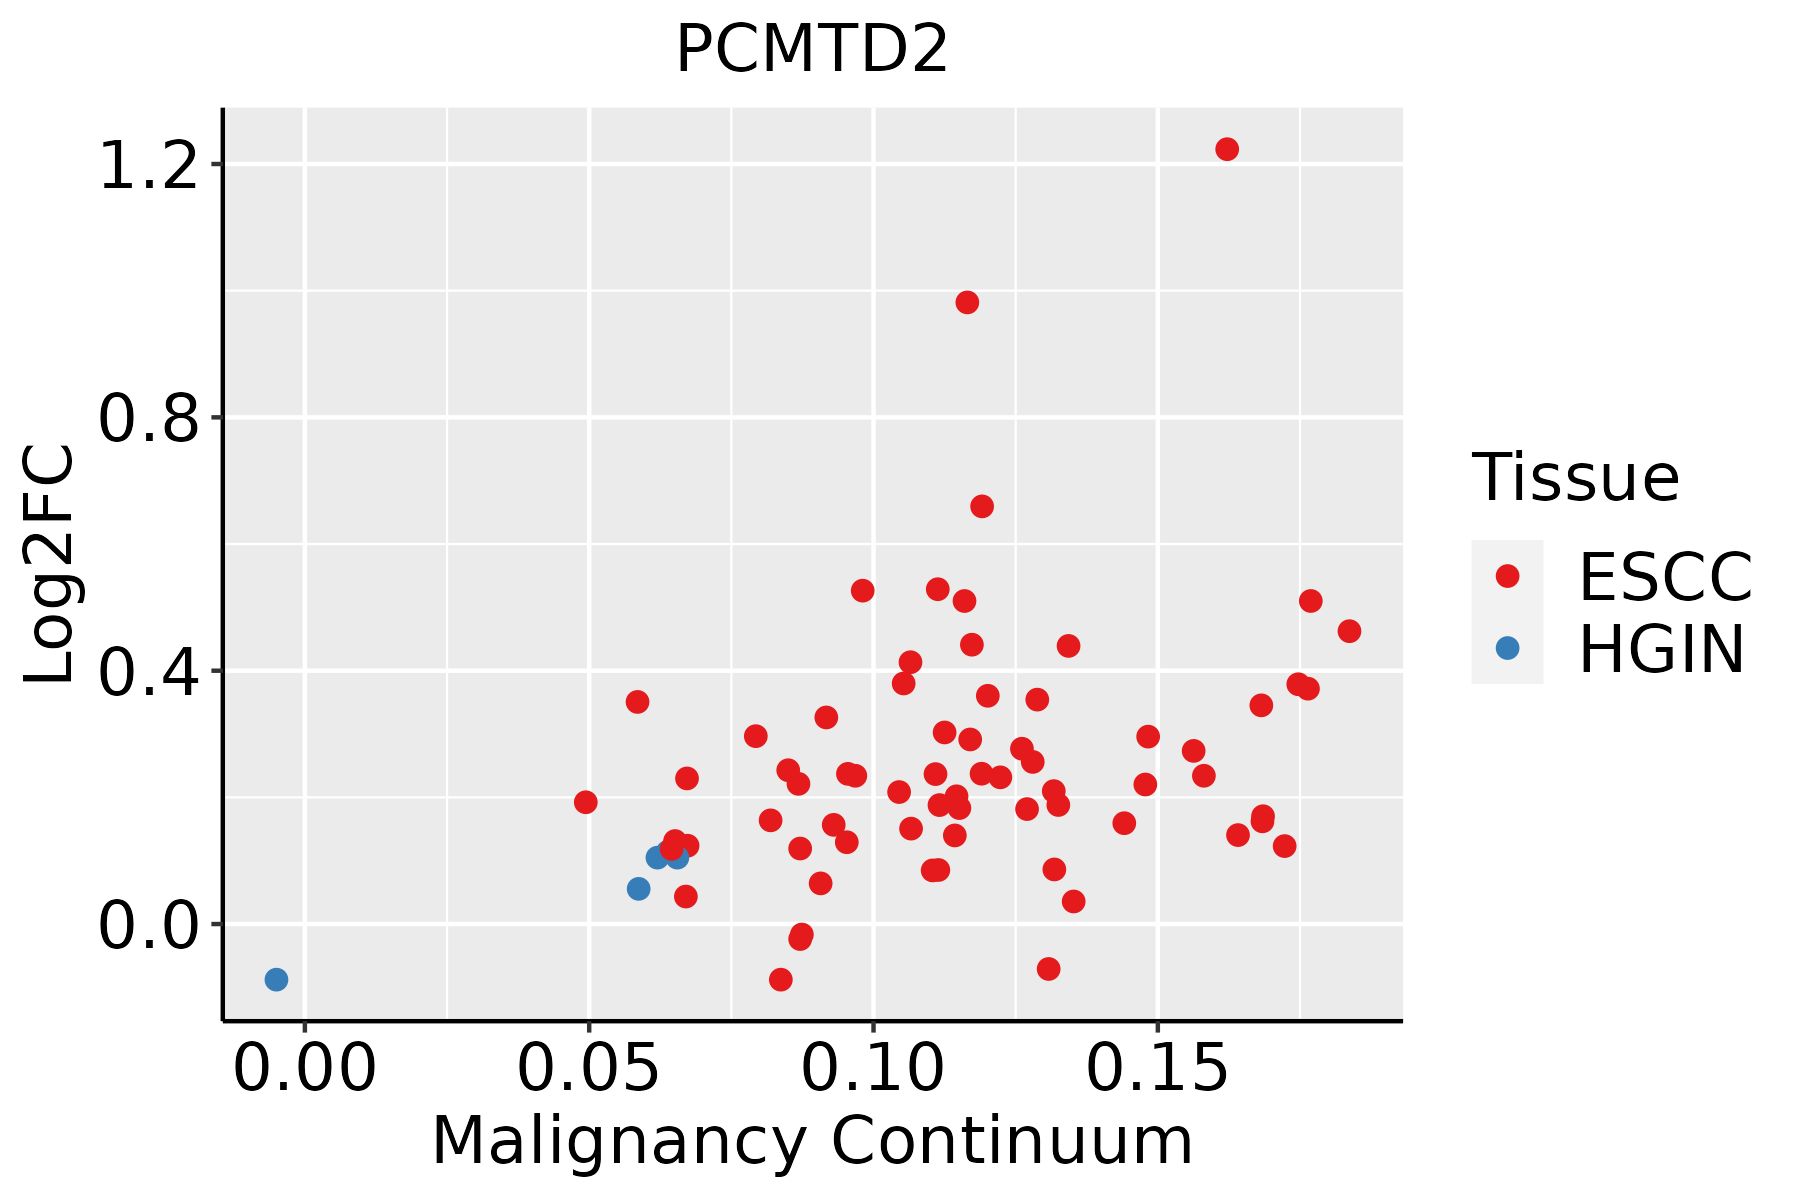 | ESCC: Esophageal squamous cell carcinoma |
| HGIN: High-grade intraepithelial neoplasias | ||
| LGIN: Low-grade intraepithelial neoplasias | ||
| Liver | 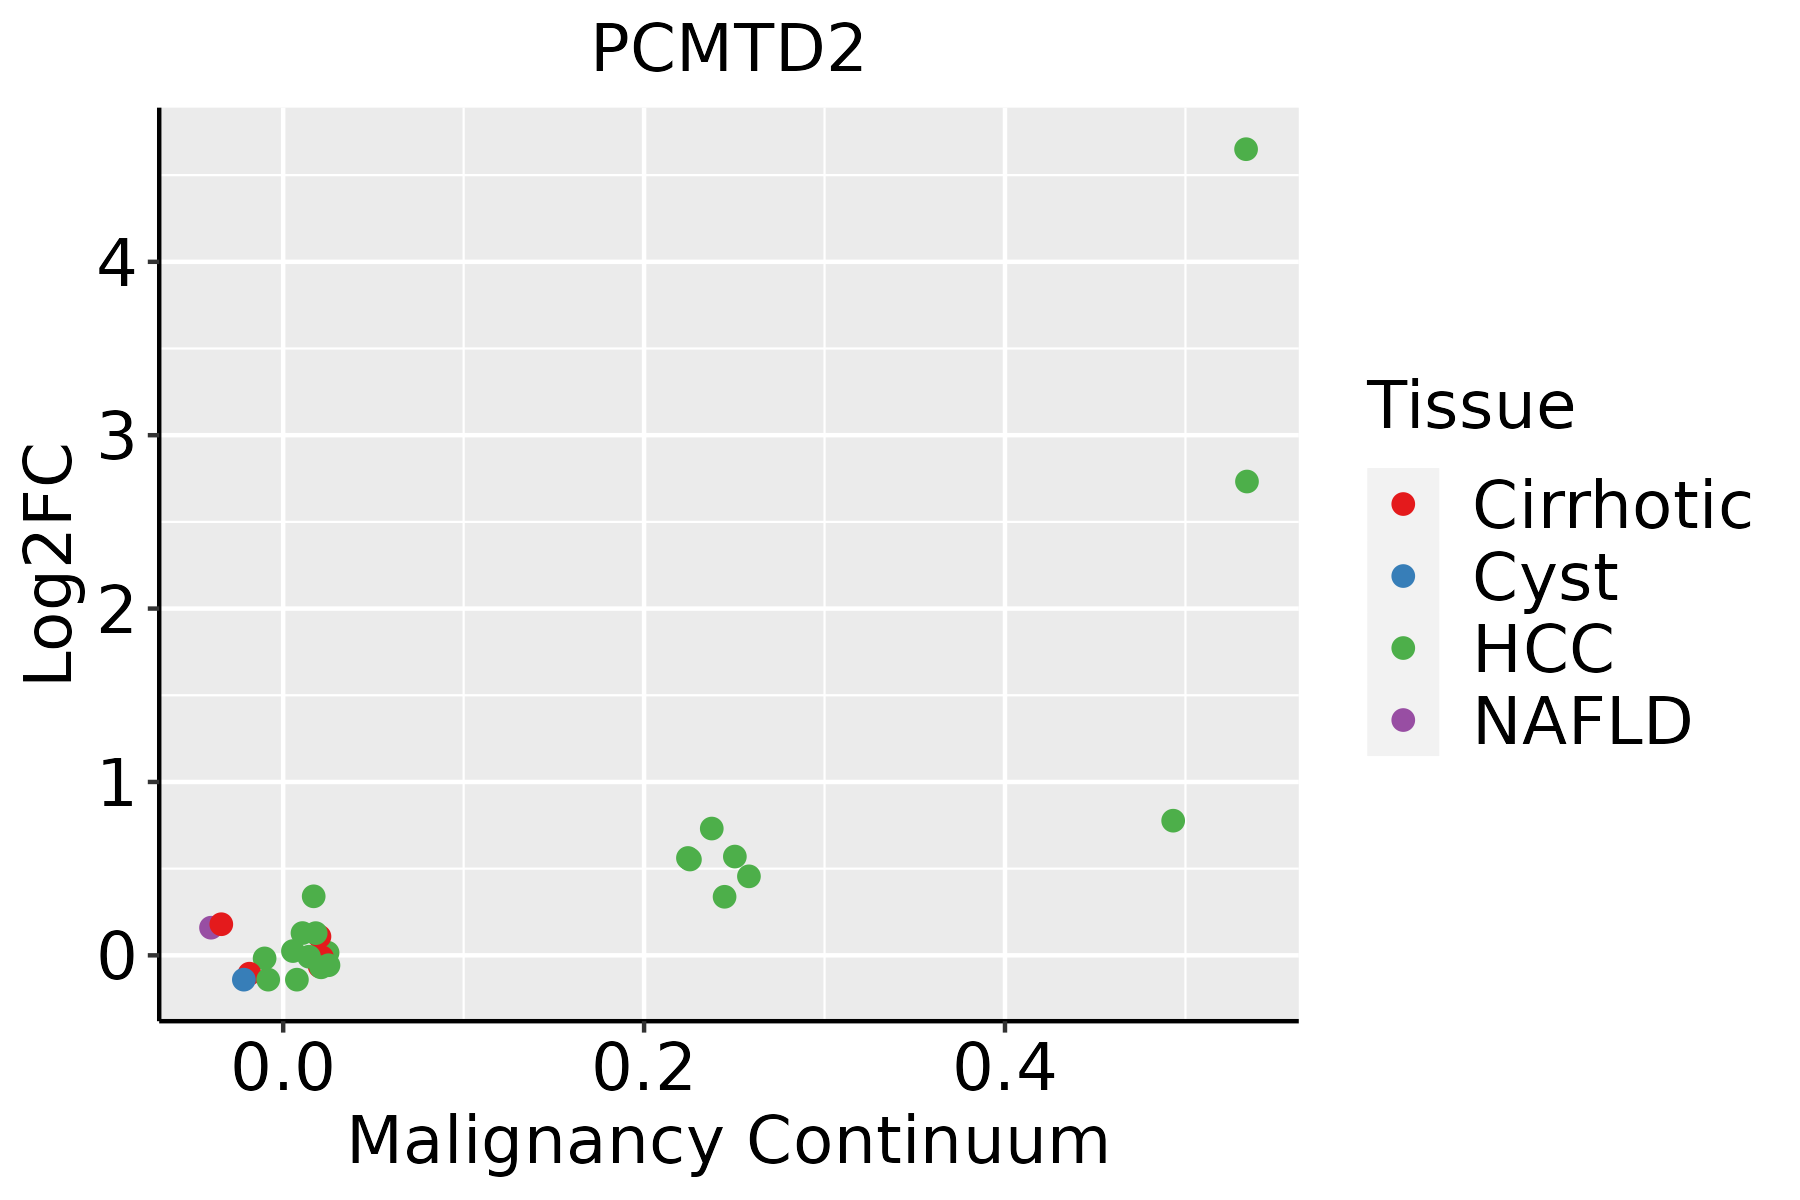 | HCC: Hepatocellular carcinoma |
| NAFLD: Non-alcoholic fatty liver disease | ||
| Prostate | 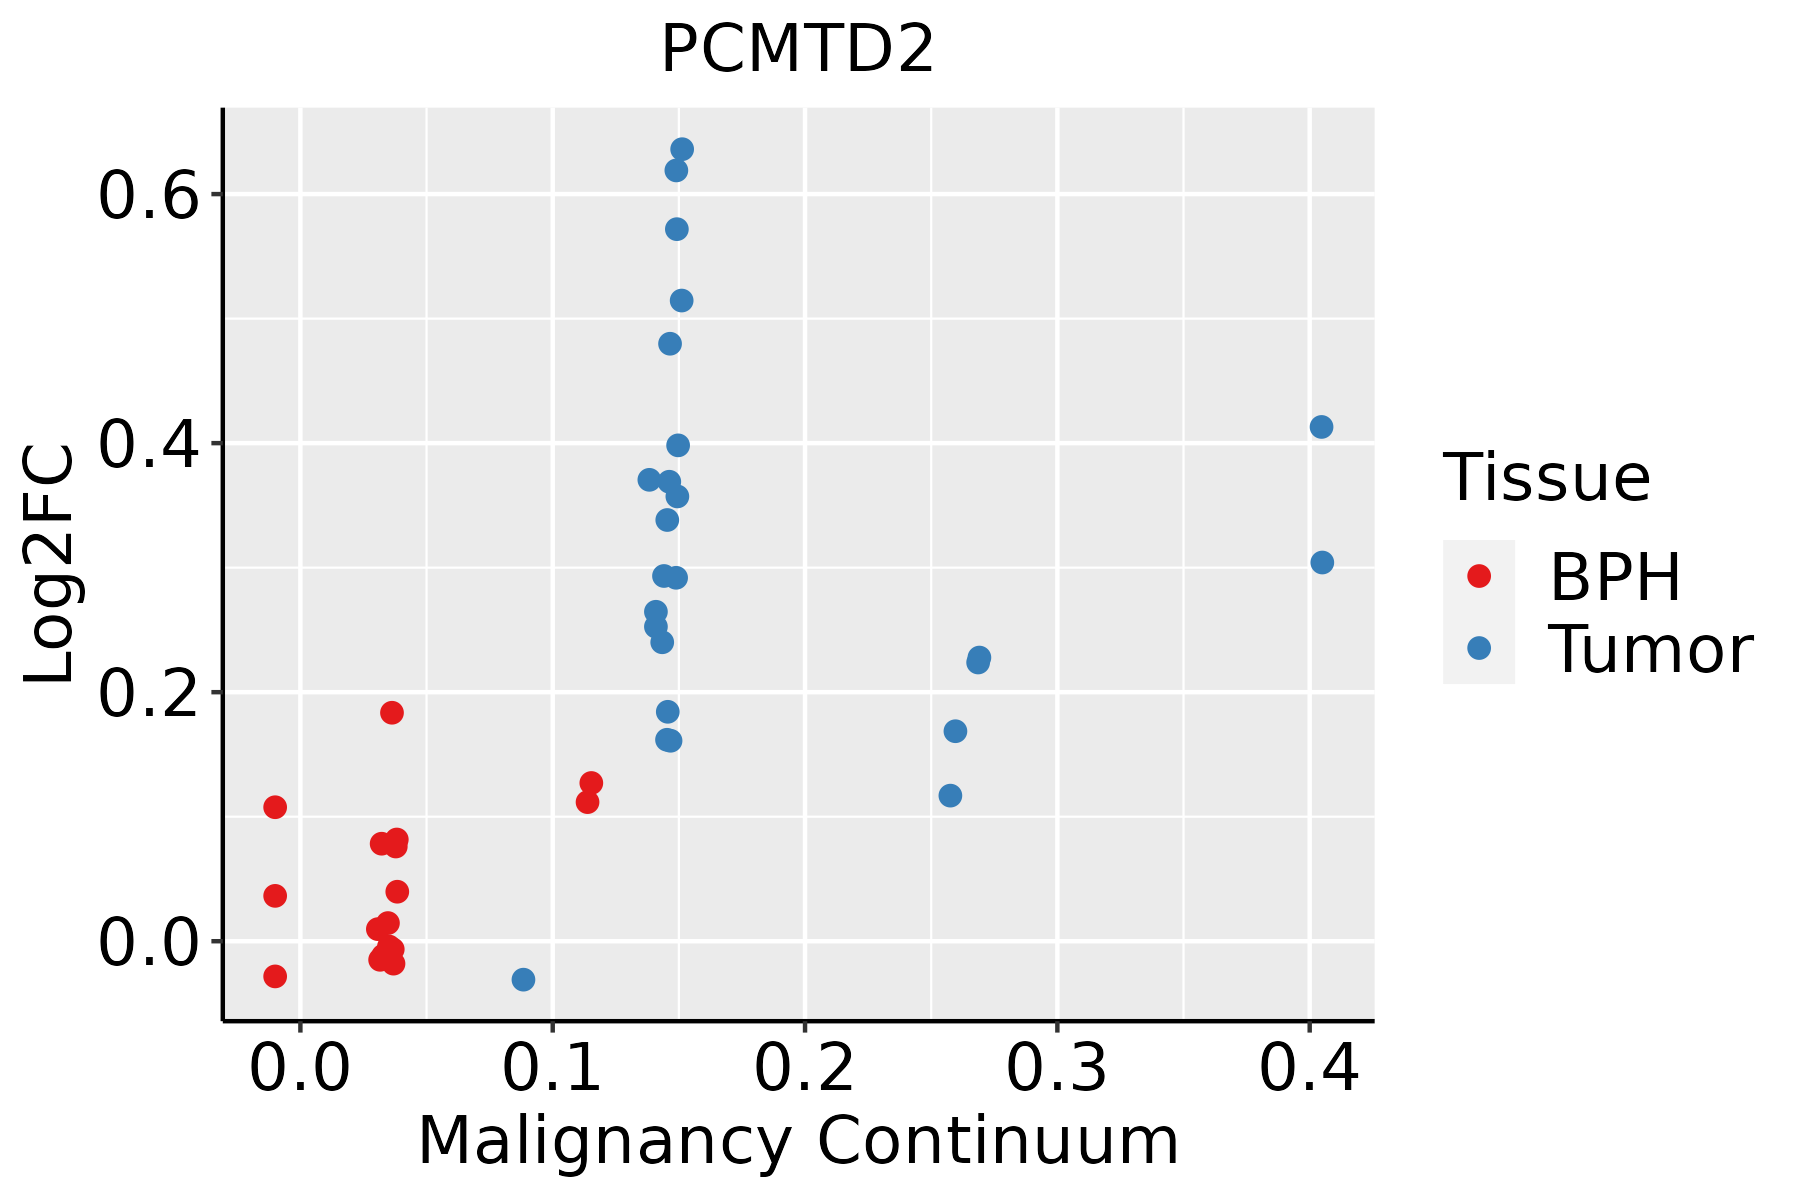 | BPH: Benign Prostatic Hyperplasia |
| Thyroid | 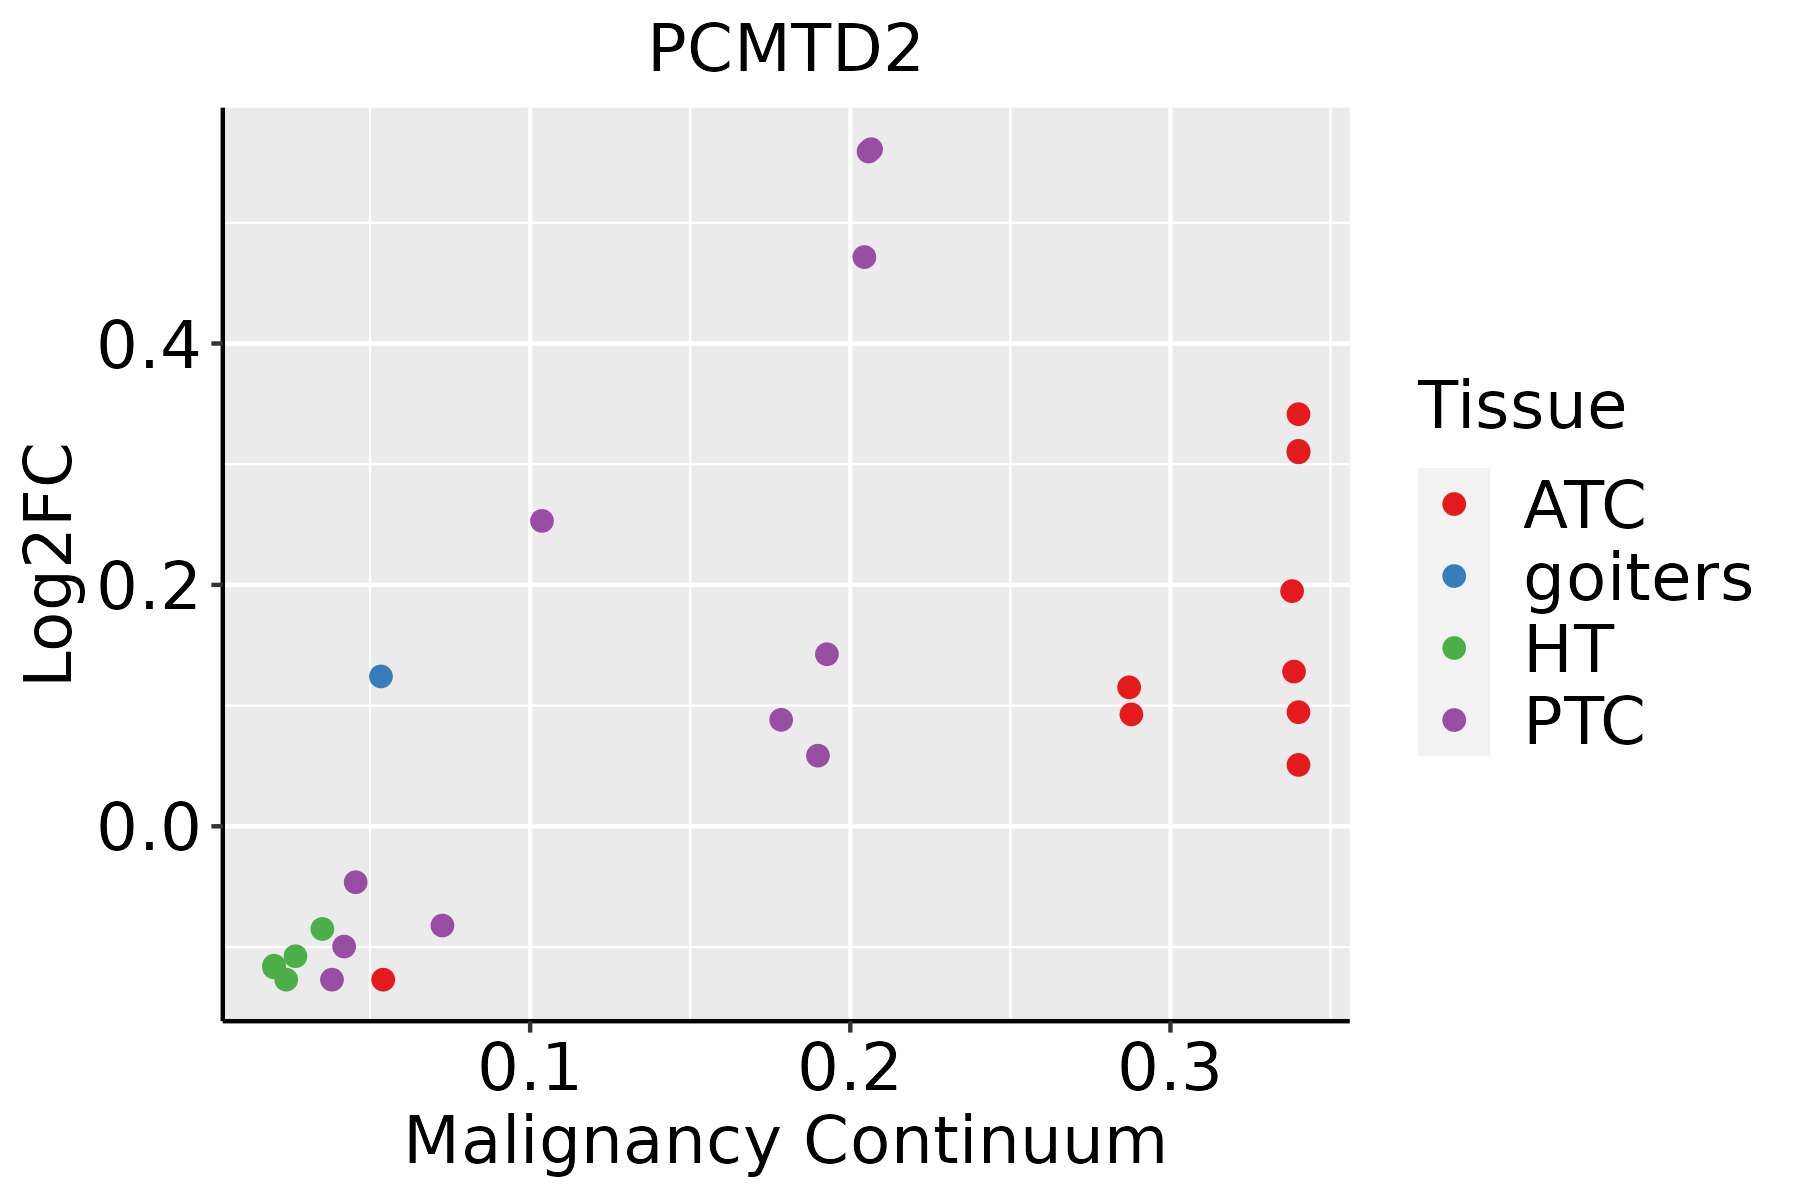 | ATC: Anaplastic thyroid cancer |
| HT: Hashimoto's thyroiditis | ||
| PTC: Papillary thyroid cancer |
| ∗log2FC in expression of this searched gene in stem-like cells from each diseased tissue sample relative to stem-like cells in normal samples in each tissue plotted against the malignancy continuum. Samples are colored based on if they are from different disease stage. |
Top |
Malignant transformation related pathway analysis |
| Find out the enriched GO biological processes and KEGG pathways involved in transition from healthy to precancer to cancer |
| Tissue | Disease Stage | Enriched GO biological Processes |
| Colorectum | AD |  |
| Colorectum | SER |  |
| Colorectum | MSS |  |
| Colorectum | MSI-H |  |
| Colorectum | FAP |  |
| ∗Top 15 enriched GO BP terms are showed in the bar plot of each disease state in each tissue. Each row represents a significant GO biological process which is colored according to the -log10(p.adjust). |
| Page: 1 2 3 4 5 6 7 8 9 |
| GO ID | Tissue | Disease Stage | Description | Gene Ratio | Bg Ratio | pvalue | p.adjust | Count |
| GO:0006479 | Colorectum | FAP | protein methylation | 39/2622 | 181/18723 | 3.60e-03 | 2.58e-02 | 39 |
| GO:0008213 | Colorectum | FAP | protein alkylation | 39/2622 | 181/18723 | 3.60e-03 | 2.58e-02 | 39 |
| GO:00434143 | Esophagus | ESCC | macromolecule methylation | 199/8552 | 316/18723 | 3.44e-10 | 9.57e-09 | 199 |
| GO:00322592 | Esophagus | ESCC | methylation | 222/8552 | 364/18723 | 2.26e-09 | 5.09e-08 | 222 |
| GO:000647914 | Esophagus | ESCC | protein methylation | 115/8552 | 181/18723 | 9.07e-07 | 1.16e-05 | 115 |
| GO:000821314 | Esophagus | ESCC | protein alkylation | 115/8552 | 181/18723 | 9.07e-07 | 1.16e-05 | 115 |
| GO:00434141 | Liver | HCC | macromolecule methylation | 183/7958 | 316/18723 | 2.00e-08 | 4.72e-07 | 183 |
| GO:0032259 | Liver | HCC | methylation | 206/7958 | 364/18723 | 3.35e-08 | 7.53e-07 | 206 |
| GO:00064792 | Liver | HCC | protein methylation | 111/7958 | 181/18723 | 2.36e-07 | 4.18e-06 | 111 |
| GO:00082132 | Liver | HCC | protein alkylation | 111/7958 | 181/18723 | 2.36e-07 | 4.18e-06 | 111 |
| GO:000647912 | Prostate | Tumor | protein methylation | 52/3246 | 181/18723 | 9.58e-05 | 9.35e-04 | 52 |
| GO:000821312 | Prostate | Tumor | protein alkylation | 52/3246 | 181/18723 | 9.58e-05 | 9.35e-04 | 52 |
| GO:000647910 | Thyroid | PTC | protein methylation | 82/5968 | 181/18723 | 1.01e-04 | 8.21e-04 | 82 |
| GO:000821310 | Thyroid | PTC | protein alkylation | 82/5968 | 181/18723 | 1.01e-04 | 8.21e-04 | 82 |
| GO:00322594 | Thyroid | PTC | methylation | 146/5968 | 364/18723 | 4.99e-04 | 3.26e-03 | 146 |
| GO:00434145 | Thyroid | PTC | macromolecule methylation | 127/5968 | 316/18723 | 1.02e-03 | 6.07e-03 | 127 |
| GO:000647916 | Thyroid | ATC | protein methylation | 85/6293 | 181/18723 | 1.27e-04 | 9.00e-04 | 85 |
| GO:000821316 | Thyroid | ATC | protein alkylation | 85/6293 | 181/18723 | 1.27e-04 | 9.00e-04 | 85 |
| GO:004341412 | Thyroid | ATC | macromolecule methylation | 131/6293 | 316/18723 | 2.01e-03 | 9.60e-03 | 131 |
| GO:003225911 | Thyroid | ATC | methylation | 148/6293 | 364/18723 | 2.69e-03 | 1.23e-02 | 148 |
| Page: 1 |
| Pathway ID | Tissue | Disease Stage | Description | Gene Ratio | Bg Ratio | pvalue | p.adjust | qvalue | Count |
| Page: 1 |
Top |
Cell-cell communication analysis |
| Identification of potential cell-cell interactions between two cell types and their ligand-receptor pairs for different disease states |
| Ligand | Receptor | LRpair | Pathway | Tissue | Disease Stage |
| Page: 1 |
Top |
Single-cell gene regulatory network inference analysis |
| Find out the significant the regulons (TFs) and the target genes of each regulon across cell types for different disease states |
| TF | Cell Type | Tissue | Disease Stage | Target Gene | RSS | Regulon Activity |
| ∗The dot plots of a searched regulon are shown for all cell subpopulations in each disease state of each tissue based on the regulon specific score inferred using pySCENIC and by calculating the average expression. |
| Page: 1 |
Top |
Somatic mutation of malignant transformation related genes |
| Annotation of somatic variants for genes involved in malignant transformation |
| Hugo Symbol | Variant Class | Variant Classification | dbSNP RS | HGVSc | HGVSp | HGVSp Short | SWISSPROT | BIOTYPE | SIFT | PolyPhen | Tumor Sample Barcode | Tissue | Histology | Sex | Age | Stage | Therapy Types | Drugs | Outcome |
| PCMTD2 | SNV | Missense_Mutation | novel | c.973A>C | p.Thr325Pro | p.T325P | Q9NV79 | protein_coding | tolerated_low_confidence(0.28) | benign(0.021) | TCGA-AO-A1KT-01 | Breast | breast invasive carcinoma | Female | >=65 | I/II | Chemotherapy | fluorouracil | SD |
| PCMTD2 | SNV | Missense_Mutation | c.520G>A | p.Glu174Lys | p.E174K | Q9NV79 | protein_coding | tolerated(0.05) | benign(0.055) | TCGA-BH-A0H0-01 | Breast | breast invasive carcinoma | Female | >=65 | I/II | Hormone Therapy | arimidex | SD | |
| PCMTD2 | SNV | Missense_Mutation | rs769213487 | c.698N>C | p.Val233Ala | p.V233A | Q9NV79 | protein_coding | tolerated(0.09) | benign(0.005) | TCGA-E2-A14N-01 | Breast | breast invasive carcinoma | Female | <65 | I/II | Chemotherapy | cyclophosphamide | SD |
| PCMTD2 | SNV | Missense_Mutation | rs372058955 | c.1015N>T | p.Arg339Cys | p.R339C | Q9NV79 | protein_coding | deleterious_low_confidence(0) | probably_damaging(0.99) | TCGA-OK-A5Q2-01 | Breast | breast invasive carcinoma | Female | <65 | I/II | Unknown | Unknown | SD |
| PCMTD2 | insertion | Nonsense_Mutation | novel | c.239_240insATCCTATTGATTTGCAAAACCTAATATTCAGCTCTAAAATCT | p.Pro80_Gly81insSerTyrTerPheAlaLysProAsnIleGlnLeuTerAsnLeu | p.P80_G81insSY*FAKPNIQL*NL | Q9NV79 | protein_coding | TCGA-A2-A04Y-01 | Breast | breast invasive carcinoma | Female | <65 | I/II | Chemotherapy | cytoxan | SD | ||
| PCMTD2 | deletion | Frame_Shift_Del | c.645delN | p.Phe216LeufsTer4 | p.F216Lfs*4 | Q9NV79 | protein_coding | TCGA-BH-A18G-01 | Breast | breast invasive carcinoma | Female | >=65 | I/II | Unknown | Unknown | SD | |||
| PCMTD2 | SNV | Missense_Mutation | c.742N>T | p.Arg248Cys | p.R248C | Q9NV79 | protein_coding | deleterious(0) | probably_damaging(0.993) | TCGA-LP-A4AV-01 | Cervix | cervical & endocervical cancer | Female | <65 | I/II | Unknown | Unknown | SD | |
| PCMTD2 | SNV | Missense_Mutation | c.437N>C | p.Val146Ala | p.V146A | Q9NV79 | protein_coding | deleterious(0.04) | benign(0.302) | TCGA-A6-6141-01 | Colorectum | colon adenocarcinoma | Male | <65 | I/II | Chemotherapy | 5-fu | SD | |
| PCMTD2 | SNV | Missense_Mutation | rs756506348 | c.847C>T | p.Arg283Cys | p.R283C | Q9NV79 | protein_coding | deleterious(0.01) | possibly_damaging(0.549) | TCGA-AA-A00N-01 | Colorectum | colon adenocarcinoma | Male | >=65 | I/II | Unknown | Unknown | PD |
| PCMTD2 | SNV | Missense_Mutation | c.109N>A | p.Asp37Asn | p.D37N | Q9NV79 | protein_coding | deleterious(0) | probably_damaging(0.971) | TCGA-CA-6717-01 | Colorectum | colon adenocarcinoma | Male | <65 | I/II | Chemotherapy | oxaliplatin | CR |
| Page: 1 2 3 4 5 6 |
Top |
Related drugs of malignant transformation related genes |
| Identification of chemicals and drugs interact with genes involved in malignant transfromation |
| (DGIdb 4.0) |
| Entrez ID | Symbol | Category | Interaction Types | Drug Claim Name | Drug Name | PMIDs |
| Page: 1 |

Copyright 2023-Present -The University of Texas Health Science Center at Houston |