| Tissue | Expression Dynamics | Abbreviation |
| Endometrium | 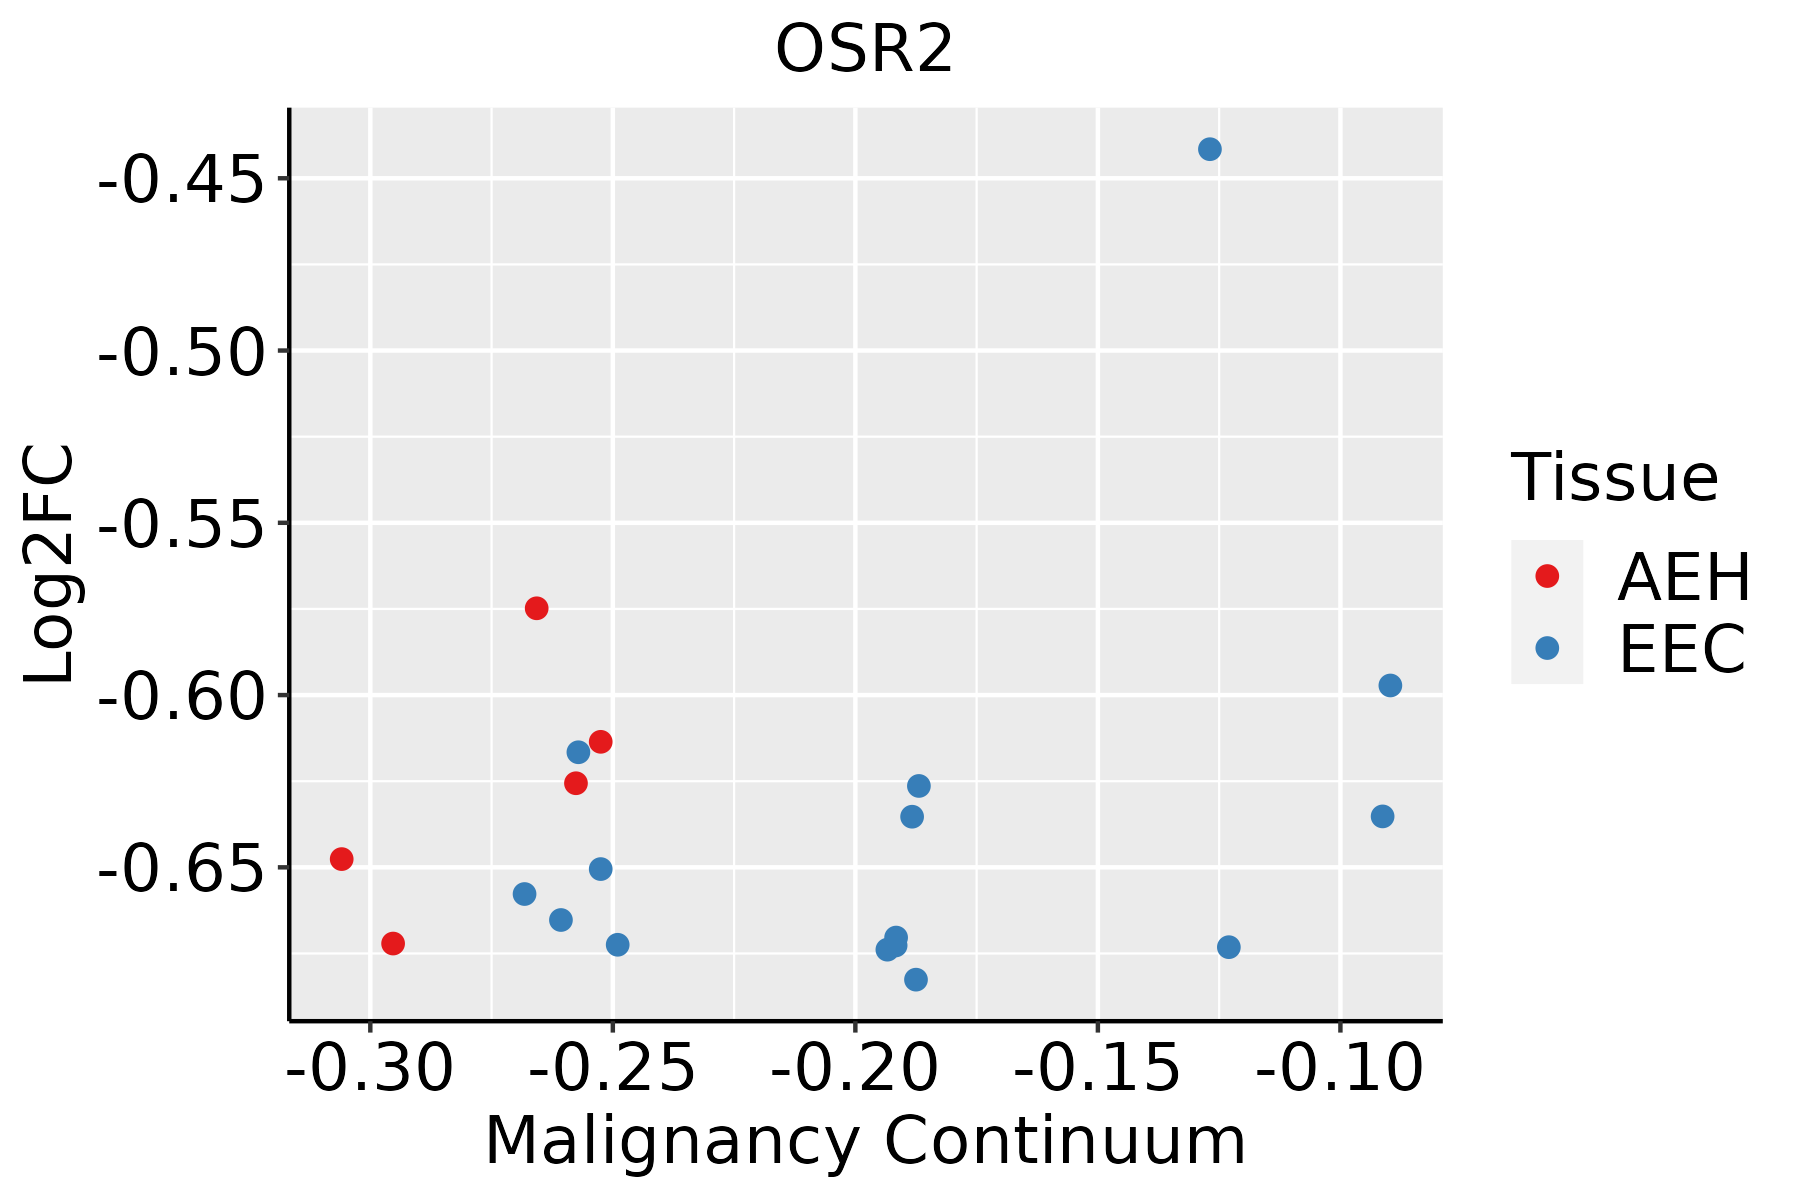 | AEH: Atypical endometrial hyperplasia |
| EEC: Endometrioid Cancer |
| Esophagus | 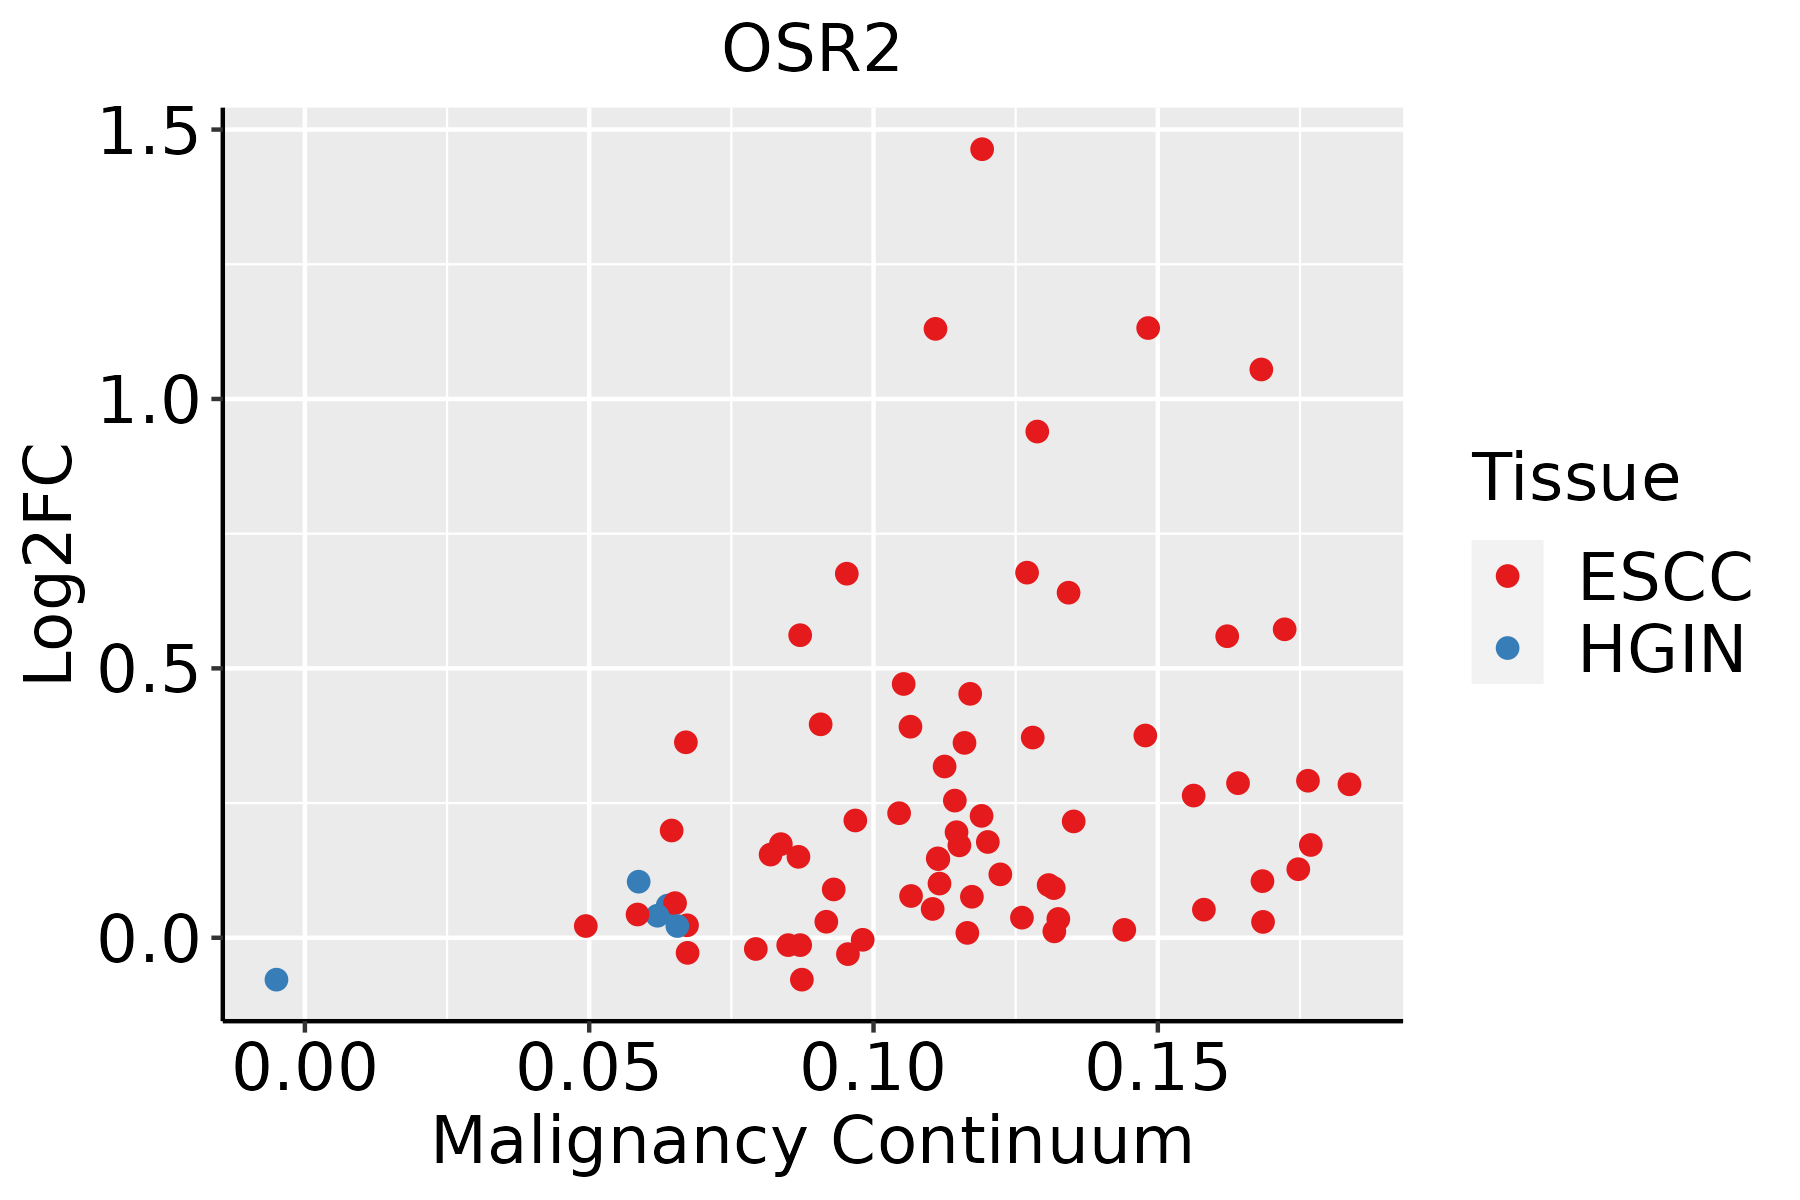 | ESCC: Esophageal squamous cell carcinoma |
| HGIN: High-grade intraepithelial neoplasias |
| LGIN: Low-grade intraepithelial neoplasias |
| Liver | 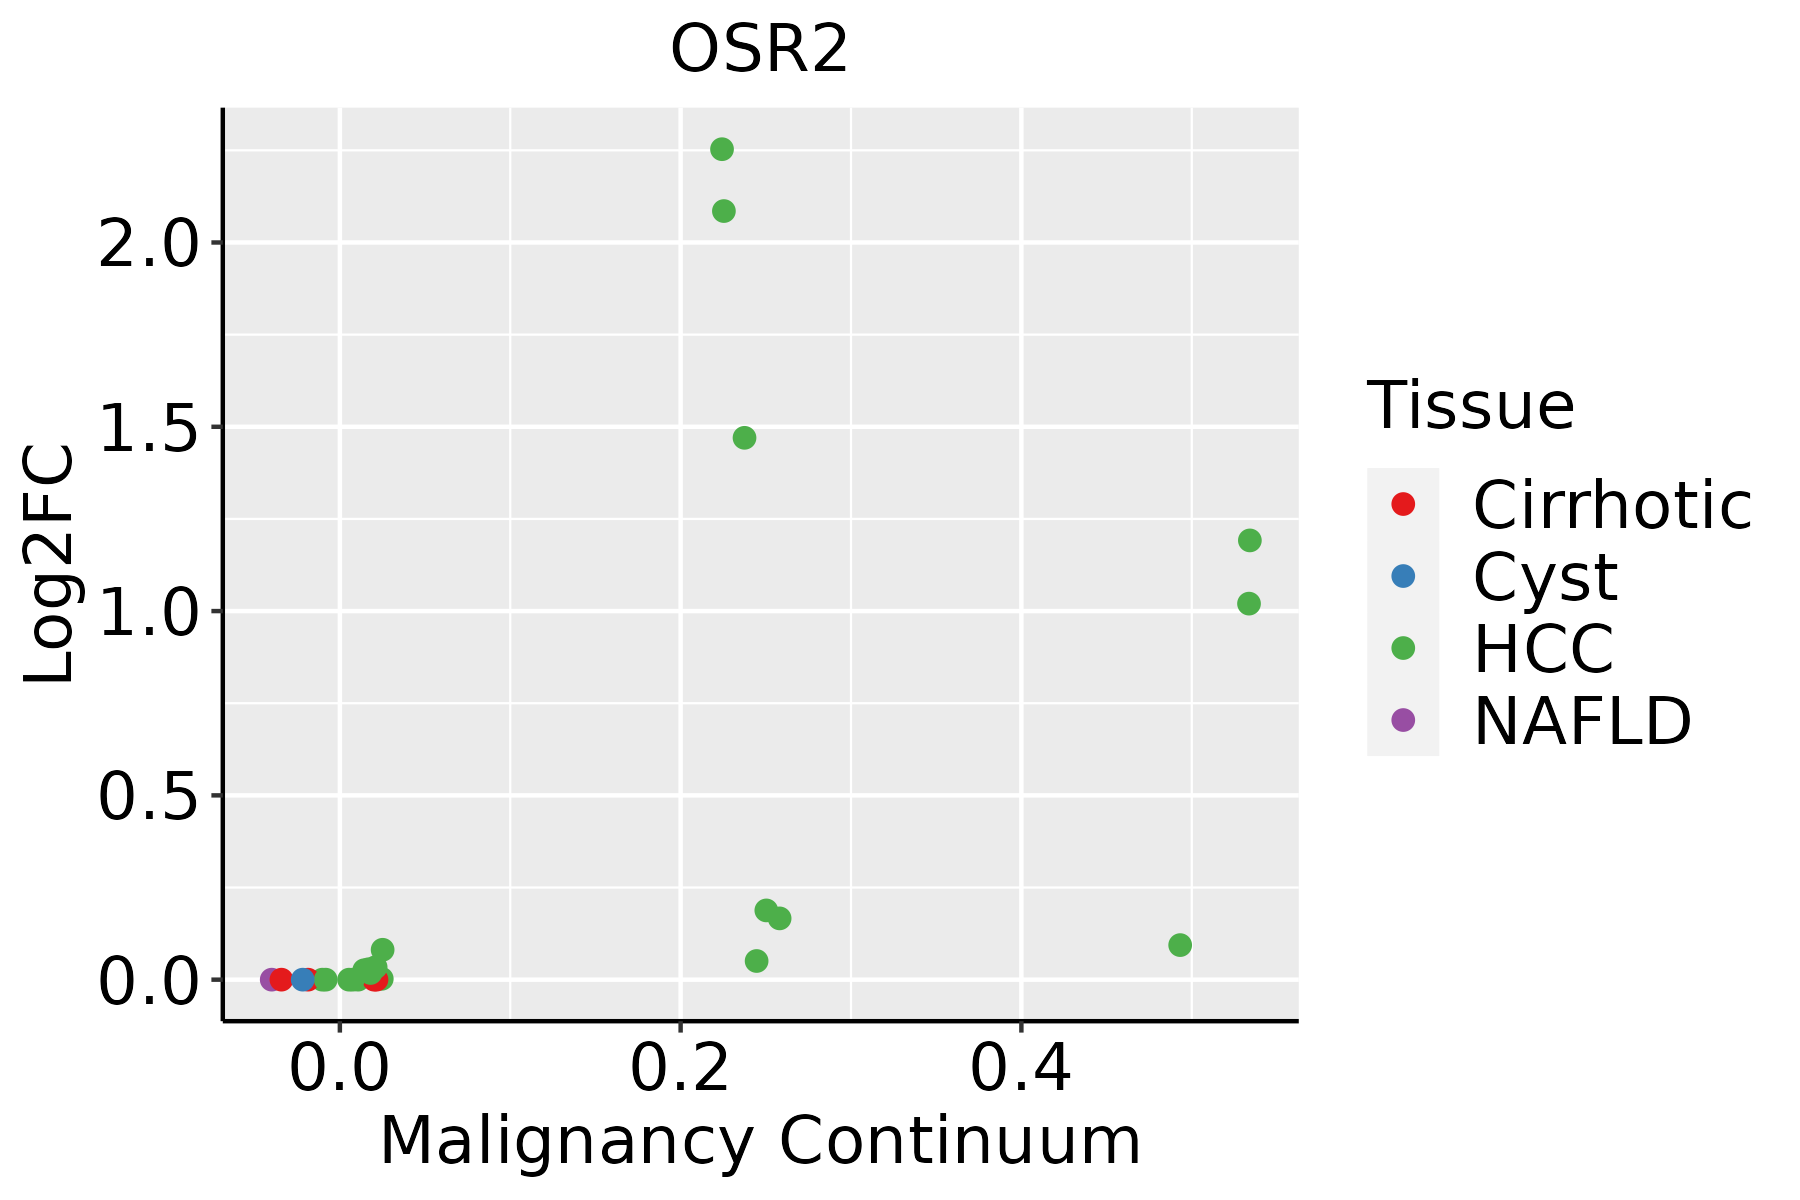 | HCC: Hepatocellular carcinoma |
| NAFLD: Non-alcoholic fatty liver disease |
| Oral Cavity |  | EOLP: Erosive Oral lichen planus |
| LP: leukoplakia |
| NEOLP: Non-erosive oral lichen planus |
| OSCC: Oral squamous cell carcinoma |
| GO ID | Tissue | Disease Stage | Description | Gene Ratio | Bg Ratio | pvalue | p.adjust | Count |
| GO:00506738 | Endometrium | AEH | epithelial cell proliferation | 84/2100 | 437/18723 | 4.88e-07 | 1.94e-05 | 84 |
| GO:00015038 | Endometrium | AEH | ossification | 78/2100 | 408/18723 | 1.54e-06 | 4.85e-05 | 78 |
| GO:00016556 | Endometrium | AEH | urogenital system development | 67/2100 | 338/18723 | 2.30e-06 | 6.76e-05 | 67 |
| GO:00506788 | Endometrium | AEH | regulation of epithelial cell proliferation | 73/2100 | 381/18723 | 3.04e-06 | 8.44e-05 | 73 |
| GO:00720015 | Endometrium | AEH | renal system development | 61/2100 | 302/18723 | 3.43e-06 | 9.24e-05 | 61 |
| GO:00018224 | Endometrium | AEH | kidney development | 57/2100 | 293/18723 | 2.25e-05 | 4.35e-04 | 57 |
| GO:00506795 | Endometrium | AEH | positive regulation of epithelial cell proliferation | 43/2100 | 207/18723 | 4.55e-05 | 7.61e-04 | 43 |
| GO:00016562 | Endometrium | AEH | metanephros development | 22/2100 | 85/18723 | 1.27e-04 | 1.74e-03 | 22 |
| GO:00336872 | Endometrium | AEH | osteoblast proliferation | 11/2100 | 32/18723 | 4.71e-04 | 4.91e-03 | 11 |
| GO:00351073 | Endometrium | AEH | appendage morphogenesis | 29/2100 | 138/18723 | 6.06e-04 | 5.94e-03 | 29 |
| GO:00351083 | Endometrium | AEH | limb morphogenesis | 29/2100 | 138/18723 | 6.06e-04 | 5.94e-03 | 29 |
| GO:00487366 | Endometrium | AEH | appendage development | 33/2100 | 172/18723 | 1.41e-03 | 1.18e-02 | 33 |
| GO:00601736 | Endometrium | AEH | limb development | 33/2100 | 172/18723 | 1.41e-03 | 1.18e-02 | 33 |
| GO:0061448 | Endometrium | AEH | connective tissue development | 44/2100 | 252/18723 | 1.92e-03 | 1.51e-02 | 44 |
| GO:00018232 | Endometrium | AEH | mesonephros development | 21/2100 | 96/18723 | 1.93e-03 | 1.52e-02 | 21 |
| GO:0030326 | Endometrium | AEH | embryonic limb morphogenesis | 23/2100 | 116/18723 | 4.58e-03 | 2.95e-02 | 23 |
| GO:0035113 | Endometrium | AEH | embryonic appendage morphogenesis | 23/2100 | 116/18723 | 4.58e-03 | 2.95e-02 | 23 |
| GO:0070167 | Endometrium | AEH | regulation of biomineral tissue development | 20/2100 | 97/18723 | 5.00e-03 | 3.14e-02 | 20 |
| GO:0035115 | Endometrium | AEH | embryonic forelimb morphogenesis | 9/2100 | 31/18723 | 5.59e-03 | 3.44e-02 | 9 |
| GO:00302822 | Endometrium | AEH | bone mineralization | 23/2100 | 119/18723 | 6.32e-03 | 3.75e-02 | 23 |
| TF | Cell Type | Tissue | Disease Stage | Target Gene | RSS | Regulon Activity |
| OSR2 | GLAN | Endometrium | ADJ | MMP11,SPON2,ISLR, etc. | 6.05e-01 |  |
| OSR2 | GLAN | Endometrium | AEH | MMP11,SPON2,ISLR, etc. | 3.92e-01 |  |
| OSR2 | PLA | Esophagus | Healthy | OTUD4,OVOL2,STAC, etc. | 2.68e-02 |  |
| OSR2 | MYOFIB | Esophagus | ADJ | ENTPD2,CTD-2003C8.2,CPZ, etc. | 6.05e-04 |  |
| OSR2 | SMC | Esophagus | ESCC | ENTPD2,CTD-2003C8.2,CPZ, etc. | 2.75e-02 |  |
| OSR2 | MYOFIB | Esophagus | Healthy | ENTPD2,CTD-2003C8.2,CPZ, etc. | 1.31e-03 | |
| OSR2 | INCAF | Esophagus | Healthy | ENTPD2,CTD-2003C8.2,CPZ, etc. | 1.53e-02 | |
| OSR2 | MSC | Esophagus | Healthy | ENTPD2,CTD-2003C8.2,CPZ, etc. | 3.30e-03 | |
| OSR2 | pDC | Prostate | BPH | PCOLCE,DCN,GPM6B, etc. | 1.61e-01 |  |
| OSR2 | INCAF | Prostate | BPH | OLFML3,DCN,LGALS3BP, etc. | 1.08e-01 | |
| Hugo Symbol | Variant Class | Variant Classification | dbSNP RS | HGVSc | HGVSp | HGVSp Short | SWISSPROT | BIOTYPE | SIFT | PolyPhen | Tumor Sample Barcode | Tissue | Histology | Sex | Age | Stage | Therapy Types | Drugs | Outcome |
| OSR2 | SNV | Missense_Mutation | | c.1124N>T | p.Ser375Phe | p.S375F | Q8N2R0 | protein_coding | deleterious_low_confidence(0) | possibly_damaging(0.76) | TCGA-AR-A1AI-01 | Breast | breast invasive carcinoma | Female | <65 | I/II | Chemotherapy | cytoxan | PD |
| OSR2 | SNV | Missense_Mutation | | c.699N>G | p.Asp233Glu | p.D233E | Q8N2R0 | protein_coding | tolerated_low_confidence(0.17) | benign(0.013) | TCGA-E9-A1NA-01 | Breast | breast invasive carcinoma | Female | <65 | I/II | Chemotherapy | cyclophosphamide | SD |
| OSR2 | SNV | Missense_Mutation | | c.502C>G | p.Gln168Glu | p.Q168E | Q8N2R0 | protein_coding | deleterious_low_confidence(0) | benign(0.244) | TCGA-EW-A1PA-01 | Breast | breast invasive carcinoma | Female | <65 | I/II | Chemotherapy | cyclophosphamide | SD |
| OSR2 | insertion | Nonsense_Mutation | novel | c.938_939insATTTTATTAAATCTTATATCCATATAGAAGAATAATTGCAACATAA | p.Thr314PhefsTer3 | p.T314Ffs*3 | Q8N2R0 | protein_coding | | | TCGA-A2-A0CT-01 | Breast | breast invasive carcinoma | Female | >=65 | I/II | Chemotherapy | cytoxan | SD |
| OSR2 | SNV | Missense_Mutation | | c.1078N>A | p.Gln360Lys | p.Q360K | Q8N2R0 | protein_coding | deleterious_low_confidence(0) | possibly_damaging(0.694) | TCGA-EK-A2PG-01 | Cervix | cervical & endocervical cancer | Female | >=65 | I/II | Unknown | Unknown | SD |
| OSR2 | SNV | Missense_Mutation | | c.496N>A | p.Ala166Thr | p.A166T | Q8N2R0 | protein_coding | deleterious_low_confidence(0.02) | probably_damaging(0.993) | TCGA-MA-AA3X-01 | Cervix | cervical & endocervical cancer | Female | <65 | III/IV | Chemotherapy | cisplatin | CR |
| OSR2 | SNV | Missense_Mutation | novel | c.1105N>C | p.Thr369Pro | p.T369P | Q8N2R0 | protein_coding | deleterious_low_confidence(0.01) | possibly_damaging(0.837) | TCGA-AA-3510-01 | Colorectum | colon adenocarcinoma | Male | >=65 | I/II | Unknown | Unknown | SD |
| OSR2 | SNV | Missense_Mutation | novel | c.820T>G | p.Leu274Val | p.L274V | Q8N2R0 | protein_coding | deleterious_low_confidence(0.03) | benign(0.297) | TCGA-AA-3684-01 | Colorectum | colon adenocarcinoma | Female | >=65 | III/IV | Unknown | Unknown | SD |
| OSR2 | SNV | Missense_Mutation | novel | c.709N>C | p.Phe237Leu | p.F237L | Q8N2R0 | protein_coding | deleterious_low_confidence(0.04) | probably_damaging(0.986) | TCGA-AA-3984-01 | Colorectum | colon adenocarcinoma | Female | <65 | I/II | Unknown | Unknown | SD |
| OSR2 | SNV | Missense_Mutation | | c.386N>T | p.Ala129Val | p.A129V | Q8N2R0 | protein_coding | deleterious_low_confidence(0) | probably_damaging(0.99) | TCGA-AD-6965-01 | Colorectum | colon adenocarcinoma | Male | <65 | III/IV | Chemotherapy | oxaliplatin | PD |


